

 PDF
PDF Citation
 Print
Print


INTRODUCTION
Subarachnoid hemorrhage (SAH) is a potentially devastating cerebrovascular attack with a high proportion of poor outcomes and mortality.1 Recent studies have reported a decrease in mortality with improvement in devices and techniques used for treating ruptured aneurysms and neurocritical care.123 However, the outcome after the management of SAH varies widely, according to patient-level factors such as age, sex, and clinical status. Moreover, the outcome is also affected by hospital-level factors such as the experience and skills of a surgeon, hospital volume, and stroke unit. Most studies reporting the outcomes after the treatment of SAH have been primarily performed in high-volume hospitals and by experienced surgeons,45 making it difficult to generalize these results to actual clinical settings. Consequently, studies using multicenter data are needed to investigate mortality after treatment of SAH. We used nationwide data to investigate the short- and long-term mortality after SAH treatment according to hospital volume.
METHODS
Data and study population
Since 2011, South Korea has developed the Acute Stroke Assessment Registry—a nationwide, prospectively collected database from 201 pre-selected hospitals to assess the quality of stroke care management and improve patients' outcomes with stroke in pre-selected hospitals. The healthcare and medical insurance systems in South Korea cover the entire population. The general population has good physical and financial access to medical services.
Acute Stroke Assessment Registry is devoted to improving acute stroke care. These records can be anonymously linked to the Health Insurance Review and Assessment Service (HIRA) database using encrypted personal identification numbers, which allowed us to determine survival outcomes among SAH patients. Skilled medical personnel in pre-selected hospitals are responsible for collecting detailed data of patients who visit the emergency department for stroke. Further, they share the data with HIRA. Using this data, the HIRA provides feedback to each hospital and assigns a grade. The patients' data are protected and kept anonymous throughout the process. This study was conducted in partnership with Health Insurance Review and Assessment Service under the National Registry Research Project.
We analyzed data collected from March-May 2013 to June-August 2014 from the Acute Stroke Assessment Registry. Acute hemorrhagic stroke patients were defined as those with hemorrhagic stroke as the primary disease (International Classification of Disease, 10th version [ICD-10]: I60, I61, and I62) who were admitted to the hospital via the emergency department within 7 days of the onset of symptoms. Patients who suffered a traumatic injury were excluded from the study to exclude trauma-induced hemorrhagic stroke. We limited our dataset to first-time hemorrhagic stroke patients who had not been hospitalized for a primary or secondary disease related to hemorrhagic stroke over the past year to minimize confusion resulting in mixed cases. The type of surgery was limited to aneurysmal clipping and coiling, which are the major surgical techniques used to treat SAH.
We analyzed acute stroke data of these selected patients and then tracked the administrative data during the follow-up period. All patients included in this study were monitored for five years. Mortality was identified based on Statistics Korea data, and records were linked to the HIRA database. Thus, this registry is a reliable way to study the long-term mortality of patients with acute stroke who need ongoing care.
Study population
During a period of 6 months, 20,202 acute stroke patients were admitted to the emergency departments. A total of 5,047 (25%) patients suffered an acute hemorrhagic stroke. To analyze and compare the effect of treatment, patients who received conservative treatment for SAH were excluded. A total of 4,422 patients were excluded as their initial Glasgow Coma Scale (GCS) was either not recorded on admission, or they did not receive surgical treatment (clipping or coiling). Six hundred and twenty-five patients were treated with surgical clipping (n = 355, 57%) or endovascular coiling (n = 270, 43%).
To avoid the intentional cut-off level bias, we divided patients into two groups according to the number of clipping and coiling procedures conducted in a hospital: high-volume hospitals (≥ 20 cases per year); and low-volume hospitals (< 20 cases per year).6 We divided the severity of clinical status into two groups according to GCS on admission: 1) severe clinical status (GCS ≤ 9); and 2) mild clinical status (GCS ≥ 10). To divide the severity of clinical status in patients with SAH, we determined a cut-off score of GCS 9 because it predicted poor outcome after SAH in a previous study.7 Economy status was divided into health insurance and medical aid. Based on smoking history, patients were divided into current smokers, ex-smokers, and non-smokers. The Charlson Comorbidity Index (CCI) was determined using the ICD-10 code and was divided into two groups: 0 and ≥ 1. The use of emergency medical services (EMS) before arrival at the hospital, onset-to-door time, and door-to-image time were also collected. The mortality rate after admission was divided into five categories: within 14 days; within one month; three months; one year; and five years.
Statistical analysis
We compared high-volume hospitals and low-volume hospitals using a χ2 test for categorical variables. Descriptive data are expressed as percentages. The primary outcome of this study was short-term survival (14 days and 3 months) and long-term (1-year and 5-year) follow-up after onset of SAH. We reported Kaplan–Meier survival estimates and the difference between survival curves tested using the log-rank test stratified by matched sets. Cox proportional hazard models were used to estimate the hazard ratio (HR) of SAH associated with the treatment method and 95% confidence intervals (CIs). The model was adjusted for potential confounding factors such as age, sex, health insurance type, type of surgery (clipping or coiling), clinical status on admission (severe or mild), CCI, medical facility type (high-volume or low-volume hospitals), and stroke unit. A proportional hazards assumption was used to validate the application of the Cox proportional hazard models. Data analysis was performed using SAS version 9.3 (SAS Institute, Inc., Cary, NC, USA). A two-sided test with P < 0.05 was considered statistically significant.
Ethics statement
The study was conducted according to the guidelines of the Declaration of Helsinki and approved by the Research Ethics Committee of Soonchunhyang University Hospital (IRB number SCHCH-2018-07-025). This study was performed under the National Stroke Quality Assessment Research with National Health Insurance Administration. The requirement for informed consent was waived due to the retrospective nature of the study.
RESULTS
Baseline characteristics
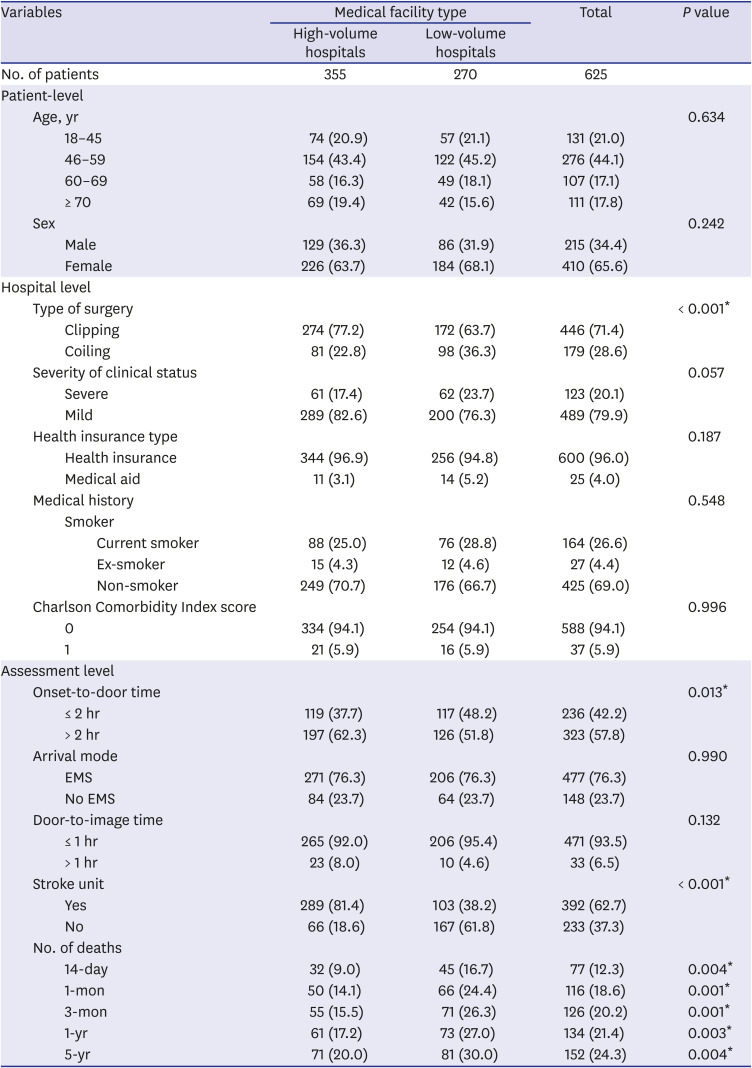
Table 1 demonstrates the baseline characteristics of SAH patients who underwent clipping and coiling procedures. A total of 625 patients with SAH underwent clipping and coiling within the six-month period. Forty-four percent of patients were 46–59 years old. The male-to-female ratio was 1:1.91. There were 446 (71%) patients who underwent clipping, and 179 (29%) underwent coiling. Of the 210 hospitals, 42 (20%) were high-volume. SAH patients were admitted to high-volume hospitals (n = 355) and low-volume hospitals (n = 270). Twenty percent of SAH patients had severe neurological status (GCS ≤ 9) on admission. Of the selected patients, 96% had health insurance, and 4% had medical aid. Forty-two percent of patients were admitted within two hours after symptom onset. Seventy-six percent of patients utilized EMS to travel to the hospital. Ninety-four percent of patients underwent computed tomography or magnetic resonance image within one hour after admission to the emergency department.
Table 1
Baseline characteristics of 625 patients who had coiling and clipping after subarachnoid hemorrhage
Mortality of SAH patients
Of all the patients, 12% died within 14 days of SAH treatment. The 1-month, 3-month, 1-year, and 5-year mortality rates of SAH patients who had clipping and coiling were 19%, 20%, 21%, and 24%, respectively.
Medical facility
High-volume hospitals treated 355 SAH patients. Of these, 274 (77%) patients underwent clipping. Low-volume hospitals had 270 SAH patients, of which 172 (64%) patients underwent clipping. Clipping was performed more commonly in high-volume hospitals (P < 0.001). High-volume hospitals received more SAH patients who had arrived within 2 hours after symptom onset than general hospitals (P = 0.013). The distribution of age, sex ratio, severity of clinical status, health insurance type, medical history, and CCI did not differ significantly between high-volume hospitals and low-volume hospitals. High-volume hospitals had a higher proportion of stroke units than low-volume hospitals (81% vs. 38%, P < 0.001, Table 1). The mortality rates of high-volume hospitals at 14 days, one month, three months, one year, and five years were 9%, 14%, 16%, 17%, and 20%, respectively. The mortality rates of low-volume hospitals at 14 days, one month, three months, one year, and five years were 12%, 19%, 20%, 21%, and 24%, respectively.
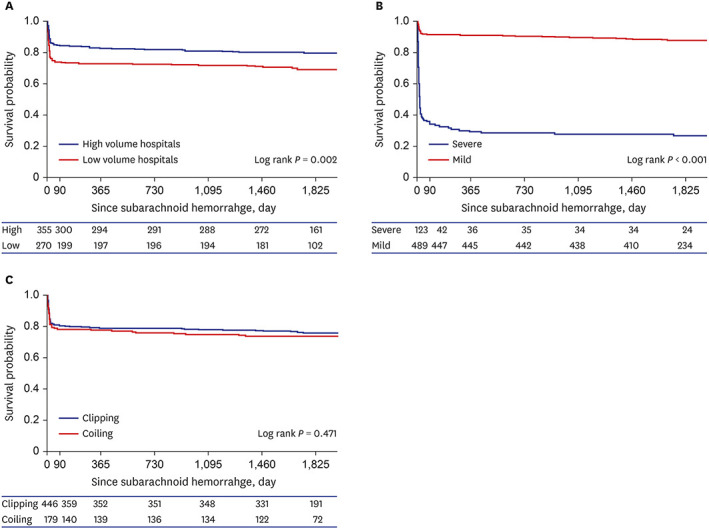
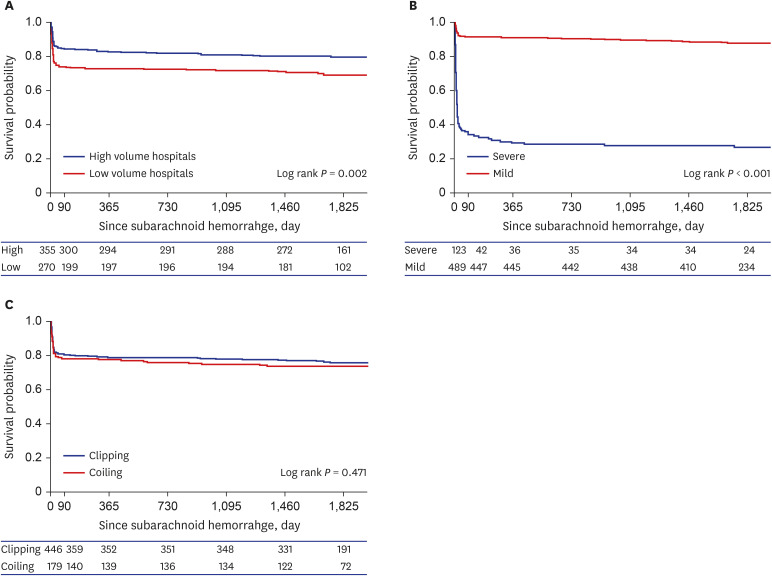
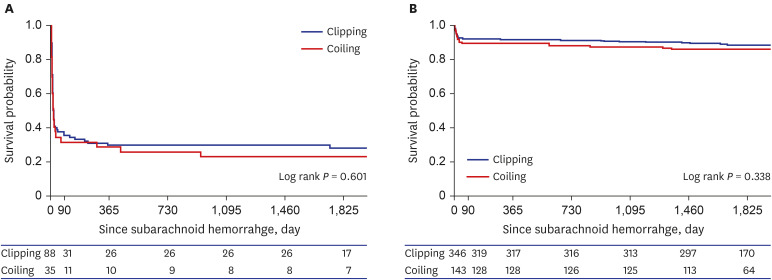
On univariate analysis, short- and long-term mortality rates of SAH patients who had been treated in high-volume hospitals were significantly lower than those of low-volume hospitals (P < 0.05). The Kaplan–Meier curve of patients who had been treated with clipping and coiling after SAH between low-volume hospitals and high-volume hospitals demonstrated that the survival rate in low-volume hospitals was lower than that of high-volume hospitals for 5 years (P = 0.002, Fig. 1A). The survival rate of patients with severe clinical status was significantly lower than that of patients with mild clinical status (P < 0.001, Fig. 1B). The survival rate between the clipping and coiling groups was not significantly different (P = 0.471, Fig. 1C).
Severity of clinical status
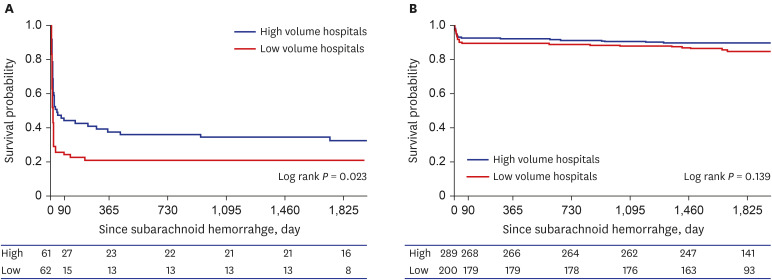
The survival rate of SAH patients in high-volume hospitals was significantly higher than that of patients in low-volume hospitals during long-term follow-up (P = 0.023,Fig. 2A). In the mild clinical status group, the survival rate of SAH patients in high-volume hospitals was higher than that in low-volume hospitals during long-term follow-up; however, the difference was not statistically significant (P = 0.139, Fig. 2B). There was no significant difference between the clipping and coiling groups in severe and mild clinical status (P > 0.05, Fig. 3).
Mortality between low-volume and high-volume centers
The in-hospital mortality within 14 days in the high-volume center was significantly lower than that at the low-volume center (9.0% vs. 16.7%, P = 0.004). The one-month mortality at the high-volume center was significantly lower than that at the low-volume center (14.1% vs. 24.4%, P = 0.001), and the three-month mortality at the high-volume center was significantly lower than that at the low-volume center (15.5% vs. 26.3%, P = 0.001). The one-year mortality at the high-volume center was significantly lower than that at the low-volume center (17.1% vs. 27.0%, P = 0.003), and the five-year mortality at the high-volume center was significantly lower than that at the low-volume center (20.0% vs. 30.0%, P = 0.004).
Cox analysis of death according to the severity of clinical status
Table 2 showed the Cox analysis of death of SAH patients who underwent clipping and coiling during short- and long-term follow-up. There was no statistical difference between high-volume hospitals group and low-volume hospitals group for SAH patients. We performed Cox regression analysis according to the severity of clinical status. On severe clinical status group, low-volume hospitals had a significantly higher HR for short-term (14-day and 3-month) mortality (Table 3) than the high-volume hospitals. However, there was no significant difference in long-term mortality (1-year and 5-year) between low-volume hospitals and high-volume hospitals (Table 3). In the severe clinical status group, females had a higher HR (4.01) than males at 14-days (P = 0.012); however, there were no statistically significant sex-specific differences at three months, one year, and five years. There was no statistical difference in terms of the type of surgery, age, health insurance type, smoking history, CCI, and stroke unit during short- and long-term follow-up.
Table 2
Cox analysis of death in subarachnoid patients who underwent clipping and coiling during short- and long-term follow-up
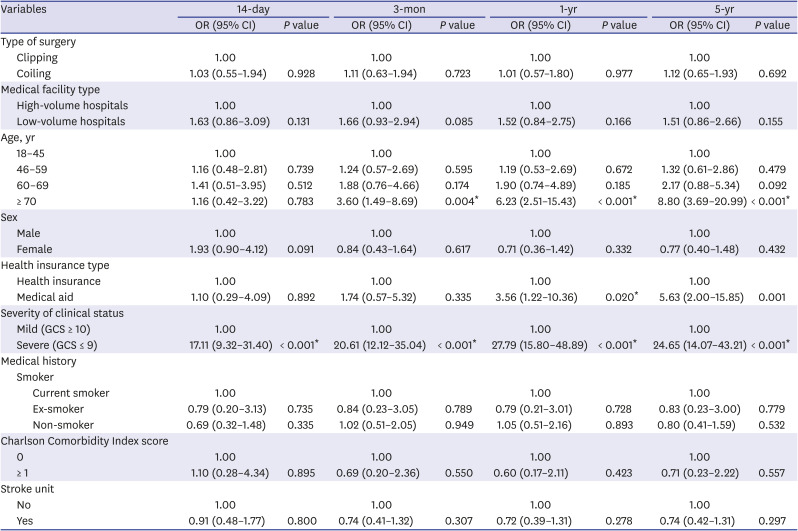
Table 3
Cox analysis of death in subarachnoid patients who underwent clipping and coiling during short- and long-term follow-up according to severe clinical status and mild clinical status on admission
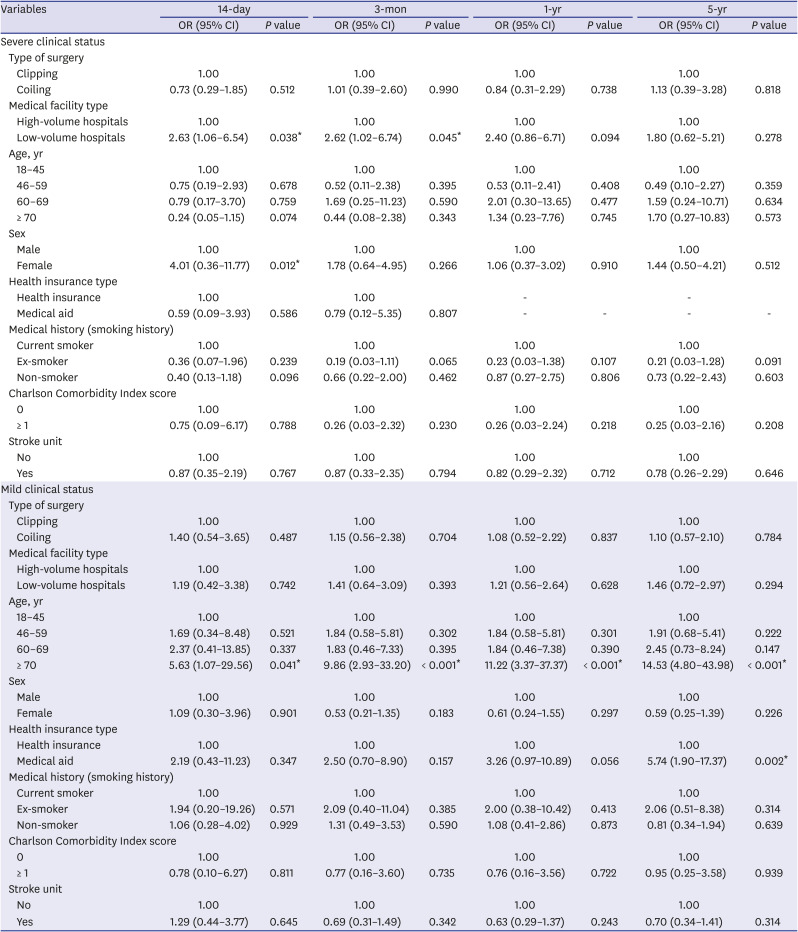
For Cox analysis of death in the mild clinical status group, low-volume hospitals had higher HRs than high-volume hospitals during short- and long-term follow-up; however, the difference was not statistically significant (P > 0.05). Very old age (≥ 70 years) had a significantly higher HR than patients aged 18–45 (P < 0.05). Medical aid showed a tendency toward a higher HR than health insurance, and the medical aid group had high HR (5.74) at five-year follow-up (P = 0.002). There was no statistical difference in terms of the type of surgery, medical facility type, sex, smoking history, CCI, and stroke unit during short- and long-term follow-up.
DISCUSSION
Mortality rates at one year and five years in Korea were 21% and 24%, respectively, and these results were similar to those obtained in the previous studies.38 This study investigated the association between hospital volume and mortality after SAH treatment, such as clipping and coiling. Our results showed that mortality from SAH decreased with an increasing volume of ruptured aneurysm cases. These results correlate with previous findings that a higher volume of surgery leads to better outcomes.9 SAH treatment does not always produce a good clinical outcome, even with a highly experienced surgeon or neurointerventionist. Previous studies have focused on the relationship between the volume of craniotomy and mortality caused by SAH. They also investigated data from a regional population or data from a few large centers.10 Our data included the outcome of clipping and coiling on pre-selected hospitals; selected by the government according to the well-designed and high-quality facilities in Korea. This study investigated national level interpretation using national health insurance claim data for Korea's general public who were being treated for a ruptured aneurysm. In our study, the low-volume center had significantly higher short and long-term mortality than the high-volume center and low-volume hospitals had significantly lower proportion of stroke units than high-volume hospitals (38% vs. 81%, Table 1). On Cox analysis of death in severe clinical status group, low-volume hospital had higher mortality on short-term follow up (Table 3). The general principle of high-quality care and outcomes from high-volume centers comes from the improvement of surgeons' and other assistants' skill and experience across numerous surgeries. Postoperative care—such as triple H therapy, cardiopulmonary care, and the check-up of neurological status every hour—is easy to achieve in high-quality intensive care units or stroke units with well-trained residents and nurses. Improved clinical outcomes in high-volume centers may reflect proper planning and treatment algorithms for treatment of ruptured aneurysms performed based on clinical status after SAH. Medical facilities such as stroke unit or number of surgery and skilled neurosurgeons is important on short-term outcome or hospital mortality.
Treatment for ruptured aneurysms is generally divided into clipping and coiling; however, the superiority of treatment outcomes for each of these methods is still debated. Clipping for SAH involves the temporary removal of a bone flap from the skull and ligation of the ruptured portion of the aneurysm. Clipping is considered to be a difficult procedure and involves a steep learning curve. Endovascular coiling is regarded as a first-line treatment for SAH since the International Subarachnoid Aneurysm Trial (ISAT). However, recent meta-analyses of SAH found that in-hospital mortality with surgical clipping was superior to that with endovascular coiling.1112 The learning curve of coiling has shortened over the years than that of clipping with the development of devices, and coiling is regarded as a less invasive procedure with a slightly shorter length of hospital stay.13 The ISAT and Barrow Ruptured Aneurysm Trial (BRAT) were performed under selected criteria; however, these results were similar at one year postoperatively. In BRAT, coiling resulted in significantly fewer poor outcomes (mRS score > 2) at one year compared to clipping (odds ratio, 1.68; 95% CI, 1.08–2.61; P = 0.021).14 Our results showed no significant difference in the three-month, one-year, and five-year mortality between clipping and coiling in patients with SAH. The three, six, and 10-year results of BRAT showed that there was no significant difference in clinical outcomes between clipping and coiling for ruptured aneurysms.5 Since our data were obtained from pre-selected hospitals with a well-designed protocol, our results were similar to those of BRAT—rather than ISAT which had high rebleeding rates in the clipped cohort.15 Cox analysis showed that coiling had a lower HR than clipping on severe clinical status, and clipping had lower HR than clipping on mild clinical status (Tables 2 and 3). However, there was no statistical difference between clipping and coiling for a ruptured aneurysm. Clipping for ruptured aneurysms requires a well-trained surgeon with skill and experience. The hematoma is removed and diluted in the subarachnoid space, and the intraparenchymal brain hematoma removal is simultaneously performed with open craniotomy. Surgical interventions such as hematoma evaluation and cerebrospinal fluid drainage with clipping could reduce the mortality of patients with SAH by decreasing the high intracranial pressure. However, severe clinical status SAH patients generally have high intracranial pressure accompanied by acute hydrocephalus, thick SAH, and intracranial hematoma. High intracranial pressure causes rebleeding during craniotomy, dura opening, sylvian dissection, or aneurysm dissection and clipping at every stage. As severe clinical status represents high intracranial pressure after SAH, clipping with severe clinical status could increase the difficulty of the surgical approach, as well illicit poor outcomes.
This study has a few limitations despite being comprised of nationwide data. First, the severity of stroke could not be assessed using brain imaging. To adjust for stroke severity, CCI and dichotomized GCS were used from prospectively collected data.16 The International Cooperative Study on the Timing of Aneurysm Surgery showed that the level of consciousness is important to predict death and disability and GCS has been used to assess the level of consciousness with worldwide acceptance for SAH patients who underwent an aneurysm operation at an early stage.171819 Therefore, we believe that Acute Stroke Assessment Registry should be examined for neurological status of SAH patients using GCS on initial admission. GCS could be a representative measure to access the outcome of SAH patients. Second, high-volume hospitals represented the number of cases per year of each hospital. Despite the concept that high-volume hospitals are related to a better experience, and evidence of the association between volume of surgery and outcome, we set the cut-off point as 20 cases per year for classifying the hospitals.9 Our results showed that patients with severe clinical status for SAH should be treated at a high-volume medical facility to reduce hospital mortality and improve short-term outcomes. The number of surgeries and coiling procedures represent the number of hospitalized patients. SAH is mainly caused by a ruptured cerebral aneurysm. However, no bleeding source could be identified in up to 10–15% of patients with SAH. An estimated 15% of patients die before reaching the hospital. Approximately 25% of patients die within 24 hours. About 60% of the patients diagnosed with SAH were treated either with surgery or coiling in this study. Many studies consistently proved that the cut-off number of 20 cases for aneurysm treatment is reliable for recognizing a hospital as a high-volume center.620 The proportion of high-volume and low-volume hospitals were 37% and 63% of the total 142 hospitals, respectively. High-volume hospitals were all tertiary general hospitals and had an average of 1,148 beds/hospital. Low-volume hospitals were all general hospitals and had an average of 562 beds/hospital. The status of manpower is as follows. The average number of doctors and nurses were 750 and 1,206 in high-volume hospitals, whereas the average number of doctors and nurses were 202 and 376 in low volume hospitals. These data suggested that high-volume hospitals can produce good clinical results with better medical environment and manpower. High-volume hospitals consisted of all tertiary general hospitals with trainees and a higher percentage of patients were being transferred from another hospital. The transfer of patients to higher level hospitals warranted that the high-volume critical diseases and teaching hospitals had a well-programmed neurocritical system and high quality of neurocritical care. High-volume hospitals performed significantly higher number of clipping procedures than low-volume hospitals (77% vs. 64%, P < 0.001). Surgical approach in patients with high intracranial pressure could not reduce hospital mortality. High-volume hospitals with surgical approach could lower the mortality for severe clinical status of stroke patients.
In SAH patients who undergo clipping and coiling, especially those with severe clinical status, low-volume hospitals had higher short- and long-term mortality than those of high-volume hospitals. On Cox regression analysis, the short-term mortality in low-volume hospitals was higher than that of high-volume hospitals. From our results based on the study of the nationwide database, it can be inferred that acute hemorrhagic stroke should be treated by a skilled neurosurgeon with adequate facilities.
 XML Download