

 PDF
PDF Citation
 Print
Print


INTRODUCTION
Liver cirrhosis refers to the development of hepatic fibrosis and regenerative nodules as a result of chronic liver injury, leading to portal hypertension and end-stage liver disease. The condition has diverse etiologies, and the clinical course, treatment methods, and prognosis differ according to these etiologies. Hepatitis B virus (HBV), hepatitis C virus (HCV), and alcohol are common causes of liver cirrhosis. Non-alcoholic fatty liver disease (NAFLD), autoimmune hepatitis, primary biliary cholangitis, and primary sclerosing cholangitis (PSC) can also result in liver cirrhosis. Chronic HBV infection has been reported to be the most common cause of liver cirrhosis in South Korea. However, since the introduction of antiviral agents and nationwide vaccinations for neonates after delivery, viral suppression has alleviated HBV prevalence and subsequently reduced chronic hepatitis due to HBV.1 Direct antiviral agents for HCV infection have been in use since 2016 in South Korea, and successful eradication of HCV has been reported in several studies.23 Therefore, the incidence of virus-related cirrhosis has been reduced due to the effective treatment of viral hepatitis in recent years.
Moreover, Korea is known to be among the highest alcohol-consuming countries in Asia and ranks first in terms of alcohol consumption per person.4 Despite the various alcohol-related national health policies, there have been no significant improvements in alcohol consumption rates due to poor adherence to the recommendations. A nationwide study assessing the etiology of cirrhosis in Korea between the 1980s and early 1990s reported HBV (56–73%) as the most common etiology, followed by alcohol consumption (7%); however, between the late 1990s and 2000s, the prevalence of HBV-related liver cirrhosis decreased to 41–58%, whereas that of alcohol-related cirrhosis increased to 26–37%.5
Recent trends have shown a marked increase in obesity due to sedentary lifestyles and overnutrition. Thus, the prevalence of NAFLD has also been increasing steeply and has become an important health issue.67 Additionally, the occurrence and prevalence of autoimmune diseases, including autoimmune hepatitis and primary biliary cholangitis, have been increasing; however, the total number of patients is relatively scarce compared to that of patients with other liver cirrhosis etiologies.89
There have been no recent studies on the epidemiology of cirrhosis, and the existing Korean data on the epidemiology and clinical course of cirrhosis are limited to the early 2000s; thus, studies examining more recent trends are needed. Therefore, we aimed to investigate the trends in the etiology of liver cirrhosis in Korea during a 10-year period, as well as how the prognosis differed among etiologies.
METHODS
Patient enrollment
Patients diagnosed with liver cirrhosis from six university hospitals in South Korea distributed in distinct districts were enrolled from January 2008 to December 2017; this study was conducted as a type of repeated cross-sectional study of each year. The first hospital records of every patient who visited the hospital at least once were retrospectively collected by each year. Patient data regarding liver cirrhosis complications, presence of hepatocellular carcinoma (HCC), hospitalization rate, and mortality were collected throughout the year. All patient data were collected and categorized by year. Newly enrolled patients of each year were defined as those who had newly visited the institution.
Liver cirrhosis diagnosis and etiology
The presence of liver cirrhosis was determined by abdominal ultrasonography or abdominal computed tomography, with or without transient elastography, and liver biopsies were performed in case of ambiguity. Chronic HBV infection was defined as the presence of HBV surface antigen for > 6 months, and chronic HCV infection was defined as a positive serum HCV RNA result. Alcohol-induced liver cirrhosis was defined as an average alcohol consumption of > 80 g of alcohol per day with seronegative HBV surface antigen and HCV RNA. Liver cirrhosis due to autoimmune hepatitis was diagnosed according to the physician's clinical decision, which was based on positive test results for serum markers related to autoimmune hepatitis, including anti-nuclear antibody titer, immunoglobulin G, anti-smooth muscle antibody, and anti-liver kidney microsome antibody with or without liver biopsy. Primary biliary cholangitis was diagnosed according to the presence of anti-mitochondrial antibody with or without liver histologic findings. Liver cirrhosis due to PSC was confirmed based on typical findings of cholangiography, with liver biopsy results suggestive of PSC. NAFLD was diagnosed according to the presence of fat deposition in the liver detected by ultrasonography or computed tomography, with the exclusion of other possible causes of liver cirrhosis. Patients with unknown etiologies of liver cirrhosis were categorized as cryptogenic liver cirrhosis.
The chronic hepatitis B group comprised patients with chronic HBV infection as the only etiology for liver cirrhosis, and the alcohol group included patients with alcohol-induced liver cirrhosis without other etiologies such as HBV or HCV.
Assessment of liver cirrhosis severity
Hematological and biochemical tests, including complete blood count, serum creatinine, blood urea nitrogen, aspartate aminotransferase, alanine aminotransferase, total bilirubin, albumin, and prothrombin time, were performed at baseline. The Child-Turcotte-Pugh (CTP) score, model for end-stage liver disease (MELD) score, and MELD-Na score were calculated to assess cirrhosis severity.
Liver cirrhosis-related complications
Patients with decompensated liver cirrhosis included those with a CTP score of B or C and those with cirrhosis-related complications, including ascites, hepatic hydrothorax, variceal bleeding, and encephalopathy. Ascites was diagnosed using ultrasonography or computed tomography and confirmed by paracentesis in the group of patients with ascites of uncertain etiology. Grading of hepatic encephalopathy was based on the criteria proposed in the CTP scoring system.10 Hepatic hydrothorax was diagnosed if transudative pleural effusion was present in a patient in whom other causes had been excluded. Esophageal and/or gastric variceal bleeding was determined based on endoscopy-associated clinical findings, including hematemesis, melena, or hematochezia. Spontaneous bacterial peritonitis (SBP) was defined as an ascitic fluid absolute polymorphonuclear leukocyte count of at least 250 cells/mm3 with or without a positive ascitic fluid bacterial culture in a patient without an intraabdominal surgically treatable source of infection.11 Hepatorenal syndrome was defined as the occurrence of acute kidney injury (increase in serum creatinine level of ≥ 0.3 mg/dL within 48 hours or increase in serum creatinine level to ≥ 1.5 times the baseline level) despite diuretic cessation and albumin infusion and chronic or acute hepatic disease with advanced hepatic failure and without any other apparent cause of acute kidney injury.1213
Rates of all-cause mortality and liver-related mortality
Mortality rate was defined as the number of deceased patients with underlying liver cirrhosis and was calculated for each year. All-cause mortality rate included the total number of deceased patients, and mortality due to liver cirrhosis complications such as variceal bleeding, SBP, and HCC was categorized as liver-related mortality.
Statistical analysis
Data are expressed as mean ± standard deviation or numbers with a percentage. Analysis of continuous variables was performed using linear regression analysis, and continuous variables are expressed as beta (B) coefficients. Analysis of non-continuous variables was processed via Poisson regression, and non-continuous variables are expressed as exponentiated values of the coefficients (Exp[B]). Every B and Exp(B) are described with a 95% confidence interval. All statistical analyses were performed using SPSS version 24.0 (IBM Corp., Armonk, NY, USA); P < 0.05 was considered statistically significant.
Ethics statement
The present study was approved by the Institutional Review Board of each center (approval No. KUMC 2019-06-026). All procedures were in accordance with the ethical standards of the responsible committee on human experimentation (institutional and national) and with the Helsinki Declaration of 1975, as revised in 2008. All authors have access to the study data and have reviewed and approved the final manuscript. The need for acquisition of informed consent from patients was waived because the patient data were de-identified.
RESULTS
Patients' baseline characteristics
From 2008 to 2017, 16,888 patient visit records from six hospitals were collected and analyzed. We compared patients' baseline characteristics between each year (Table 1). The mean age showed a constant increasing tendency (B = 0.420, P < 0.001), which might be caused by accumulated patients who survived. During the 10-year period, the proportion of patients with liver cirrhosis due to HBV decreased (Exp[B] = 0.975, P < 0.001), whereas that of alcohol cases increased (Exp[B] = 1.013, P = 0.003) (Fig. 1). Interestingly, the proportion of cirrhotic patients with immune-mediated hepatitis, including autoimmune hepatitis, primary biliary cholangitis (PBC), and PSC, and NAFLD increased over time despite their small number (Exp[B] = 1.093, P < 0.001). Both autoimmune hepatitis and PBC also showed increasing trends (P < 0.001, Exp[B] = 1.111; P < 0.001, Exp[B] = 1.009; respectively).
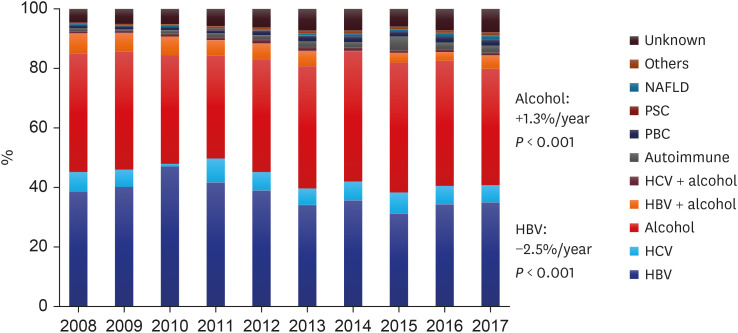
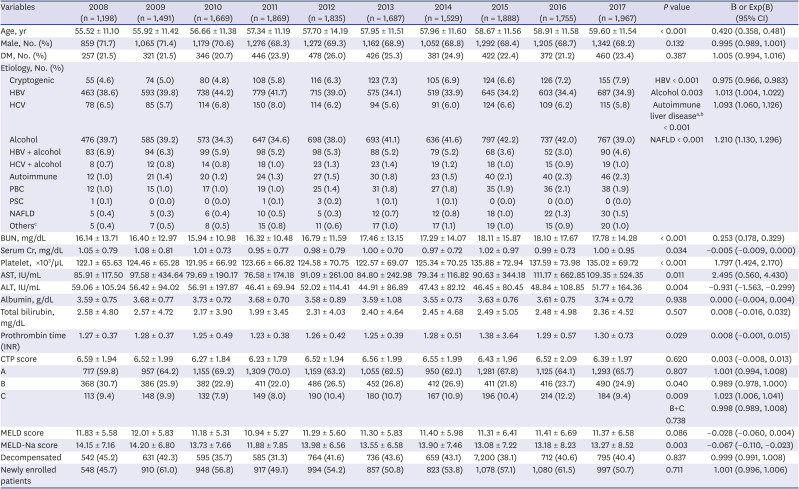
Fig. 1
Trends in the proportion of patients with underlying etiology of liver cirrhosis from 2008 to 2017. There was a significant decrease in hepatitis B virus-related liver cirrhosis cases and an increase in alcohol-related liver cirrhosis cases.
HBV = hepatitis B virus, HCV = hepatitis C virus, NAFLD = non-alcoholic fatty liver disease, PBC = primary biliary cholangitis, PSC = primary sclerosing cholangitis.
![]()
Table 1
Baseline characteristics of patients with liver cirrhosis from 2008 to 2017
Values are presented as mean ± standard deviation.
ALT = alanine aminotransferase, AST = aspartate transaminase, BUN = blood urea nitrogen, CI = confidence interval, Cr = creatinine, CTP = Child-Turcotte-Pugh, DM = diabetes mellitus, HBV = hepatitis B virus, HCV = hepatitis C virus, MELD = model for end-stage liver disease, NAFLD = non-alcoholic fatty liver disease, PBC = primary biliary cholangitis, PSC = primary sclerosing cholangitis.
aAutoimmune liver disease includes autoimmune hepatitis, primary biliary cholangitis, and primary sclerosing cholangitis; bAutoimmune hepatitis and primary biliary cirrhosis showed increasing trends (Exp[B] = 1.111, P < 0.001 and Exp[B] = 1.009, P < 0.001, respectively); cPatients with rare etiologies such as Budd-Chiari syndrome, membranous obstruction of the inferior vena cava, Wilson's disease, secondary biliary cirrhosis, and cardiogenic cirrhosis were categorized into this group.
![]()
Although there were no significant trends in the CTP score, the number of patients with CTP B decreased by 1.1%/year (P = 0.040), whereas that of patients with CTP C increased by 2.3%/year (P = 0.009). The number of patients with decompensated liver cirrhosis showed no specific trend.
Complications of liver cirrhosis and HCC occurrence
Various complications associated with liver cirrhosis were reviewed and categorized by year (Table 2). The number of patients with severe ascites or hepatic encephalopathy (Grade 3) showed decreasing trends (Exp[B] = 0.964, P = 0.002; Exp[B] = 0.932, P = 0.021, respectively). Moreover, the number of patients with variceal bleeding and SBP decreased (Exp[B] = 0.971, P = 0.005; Exp[B] = 0.937, P = 0.005, respectively). The overall occurrence rate of HCC during the 10-year period increased from 7.7% to 10.6%, exhibiting an insignificant trend.
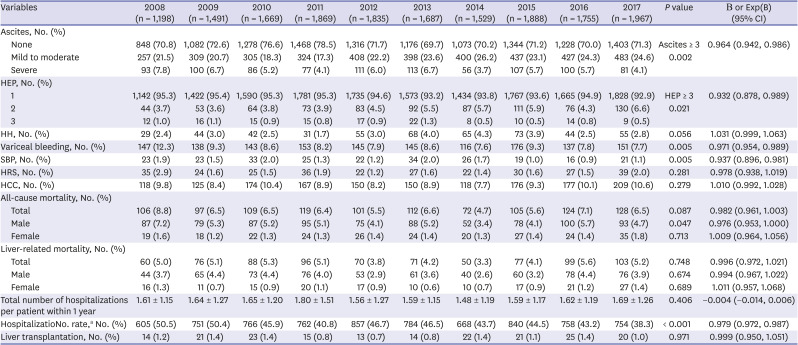
Table 2
Liver cirrhosis-related complications and hepatocellular carcinoma occurrence categorized by year
Values are presented as mean ± standard deviation.
CI = confidence interval, HH = hepatic hydrothorax, HCC = hepatocellular carcinoma, HEP = hepatic encephalopathy, HRS = hepatorenal syndrome, SBP = spontaneous bacterial peritonitis.
aThe rates of hospitalization were calculated as the numbers of patients who were hospitalized at least once during each year.
![]()
Mortality and hospitalization rates
All-cause mortality rate showed a slightly decreasing trend without statistical significance (Exp[B] = 0.982, P = 0.087) (Table 2). Men had higher all-cause and liver-related mortality rates than women (7.1% vs. 4.6%, P < 0.001; 5.3% vs. 3.2%, P < 0.001, respectively), and only the all-cause mortality rate decreased in men during the 10-year period (Exp[B] = 0.976, P = 0.047).
The hospitalization rate decreased by 2.1%/year (P < 0.001), but the total number of hospitalizations per patient within a year showed no trend.
Subgroup analysis of the HBV group
The average age of patients with HBV increased by year (B = 0.377, P < 0.001), and the number of patients receiving antiviral treatment markedly increased from 71.8% in 2009 to 87.3% in 2017 (Exp[B] = 1.019, P < 0.001) (Supplementary Table 1). The CTP score decreased by 0.025/year (P < 0.001), and the number of patients with CTP B or C significantly decreased by 3.1%/year (P < 0.001). The MELD and MELD-Na scores also decreased each year (B = −0.180, P < 0.001; B = -0.292, P < 0.001, respectively). The proportion of patients with decompensated liver cirrhosis decreased by 2.3%/year (P = 0.016), and both the hospitalization rate and total number of hospitalizations per patient within a year decreased (Exp[B] = 0.956, P < 0.001; B = −0.027, P < 0.001, respectively).
Subgroup analysis of the alcohol group
The alcohol group exhibited an increase in age by year and marked male predominance (82–89%) (Supplementary Table 2). However, the proportion of female patients had an increasing trend of 0.8%/year in this group, although it was not statistically significant (P = 0.078). Similar to the HBV group, the alcohol group showed a marked increase in the number of patients who abstained from consuming alcohol (Exp[B] = 1.054, P < 0.001). The proportion of patients with CTP C increased by 3.1%/year (P = 0.005), and the MELD and MELD-Na scores also worsened (B = 0.081, P = 0.005 and B = 0.136, P < 0.001, respectively). The hospitalization and all-cause mortality rates in the alcohol group decreased by 1.9%/year (P = 0.001) and 3.4%/year (P = 0.015), respectively.
Comparison between the HBV and alcohol groups
The two groups showed a similar profile with respect to age; the alcohol group had a larger proportion of men and a lower rate of treatment for the underlying etiology of cirrhosis (Supplementary Tables 1 and 2). The HBV group showed lower overall CTP, MELD, and MELD-Na scores with improving trends in liver function (Fig. 2), and the proportion of patients with CTP B or C and decompensated liver cirrhosis was higher in the alcohol group (Figs. 3 and 4). The alcohol group demonstrated a higher rate of cirrhosis-related complications during the study period and presented decreasing trends in variceal bleeding (Exp[B] = 0.954, P < 0.001), which was not observed in the HBV group. Although the overall prevalence of HCC was more dominant in the HBV group (11.3% vs. 6.7%, P < 0.001), the alcohol group showed increasing trends in HCC development by 4.6%/year (P = 0.005), whereas the HBV group presented no change. The hospitalization rate, total number of hospitalizations per patient within a year, and mortality rate were all significantly higher in the alcohol group (P < 0.001).
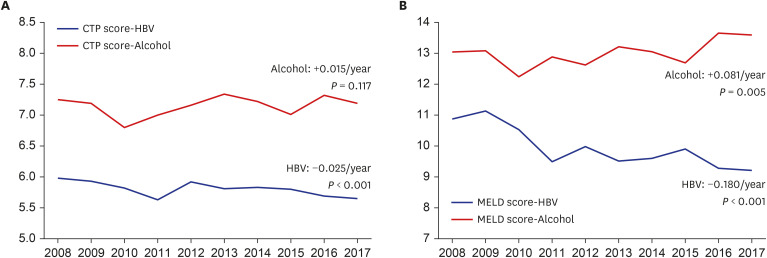
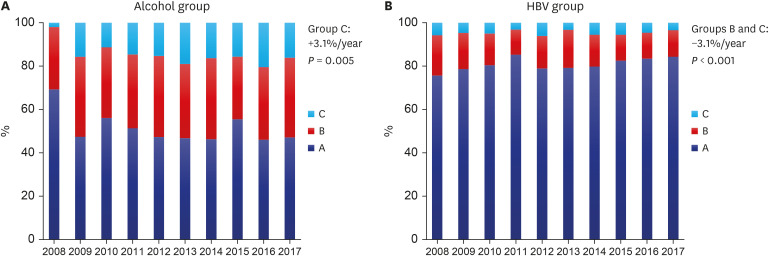
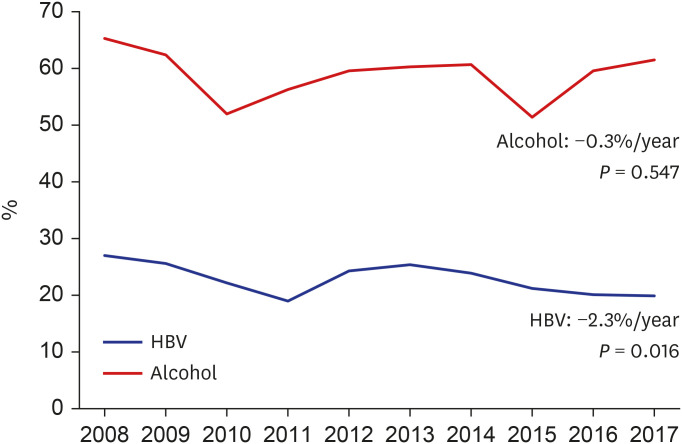
Fig. 2
Comparison of changes in the liver function between the alcohol and HBV groups from 2008 to 2017. (A) The CTP score of the HBV and alcohol groups. (B) The MELD score of the HBV and alcohol groups.
CTP = Child-Turcotte-Pugh, HBV = hepatitis B virus, MELD = model for end-stage liver disease.
![]()
Fig. 3
The CTP scores in the (A) alcohol and (B) HBV groups. The proportion of patients with CTP C in the alcohol group showed an increasing trend of 3.1%/year (95% CI, 0.9–5.3%; P = 0.005), whereas that of patients with CTP B and C in the HBV group showed a decreasing trend of −3.1%/year (95% CI, −5.0% to −1.1%; P < 0.001).
CI = confidence interval, CTP = Child-Turcotte-Pugh, HBV = hepatitis B virus.
![]()
Fig. 4
Decompensated liver cirrhosis rates in the HBV and alcohol groups. The alcohol group exhibited no significant difference in the decompensated liver cirrhosis rate during the 10-year period, whereas the HBV group showed a decreasing trend of −2.3%/year (95% CI, −4.1% to −0.4%; P = 0.016).
HBV = hepatitis B virus, CI = confidence interval.
![]()
DISCUSSION
This study shows recent 10-year trends in the etiology and clinical course of liver cirrhosis in South Korea. As there have been no epidemiologic studies reflecting changes in liver cirrhosis in the 2010s, our findings will be useful in disclosing the current state of liver cirrhosis and deciding national policies regarding liver cirrhosis.
Along with nationwide vaccination and immunization, various oral antiviral agents have been prescribed for HBV control in South Korea, and decreased prevalence of HBV infection has been reported.14 Suppression of HBV replication is known to reduce cirrhosis-related complications,1516 but the impact of HBV treatment on cirrhosis etiology and severity in South Korea has not yet been studied. Recently, several reports have indicated a consistent increase in the worldwide prevalence of NAFLD over the previous decades,1718 and as the lifestyle in South Korea becomes westernized and the rates of patients with obesity and diabetes mellitus increase, NAFLD prevalence is also expected to rapidly increase in South Korea. There have been a few cross-sectional epidemiologic studies on autoimmune liver diseases, including autoimmune hepatitis and PBC, in South Korea.1920 However, these studies did not investigate the changes in prevalence by year. Our study hereby represents the current trends in liver cirrhosis etiology and clinical severity, reflecting recent changes in the 2010s in South Korea.
In 2008, HBV (38.6%) and alcohol consumption (39.7%) were the two most common causes of liver cirrhosis noted in the country, but the prevalence of HBV as an etiology has decreased (P < 0.001, Exp[B] = 0.975), whereas that of alcohol has increased (P = 0.003, Exp[B] = 1.013). In previous reports, the proportion of patients with HBV-related cirrhosis in South Korea was high, at 56–73% in the 1980s, which decreased to 41–58% from 1990 to 2000.21 In the early 2010s, HBV-related cirrhosis prevalence decreased to 34–44%, and a decreasing trend persisted in the 2010s, as shown in our study. The prevalence of autoimmune liver disease, including autoimmune hepatitis, PBC, and PSC, demonstrated increasing trends (P < 0.001, Exp[B] = 1.093), which was comparable to the findings of a recent study,8 although the total number of patients was relatively small. The prevalence of NAFLD also increased during the 10-year period (P < 0.001, Exp[B] = 1.210), which was consistent with the results of a recent study.2223
The CTP score showed no trends during the 10-year period, but the proportion of patients with CTP B decreased (P = 0.040, Exp[B] = 0.989), whereas that of patients with CTP C increased (P = 0.009, Exp[B] = 1.023). This may be due to improvement in liver function in the HBV group who were receiving assertive antiviral treatment and who already had a relatively milder grade of cirrhosis, as well as the deterioration of liver function in patients in the alcohol group who had greater severity of cirrhosis, thereby polarizing the outcomes of the patient groups (Fig. 2). Compared to other studies, we showed higher decompensated liver cirrhosis rates, which may be due to the greater disease severity in the enrolled patients from tertiary hospitals.2425
We compared the trends in various cirrhosis-related complications during the 10-year period (Table 2). Severe grades of ascites and hepatic encephalopathy, higher than Grade 2, showed a decreasing trend in both groups (P = 0.002, Exp[B] = 0.964/P = 0.021, Exp[B] = 0.932, respectively). The regression of liver cirrhosis by treatment of the underlying etiology of liver cirrhosis may have prevented the development of complications.2627 Moreover, the number of patients with variceal bleeding decreased over the years, along with improvements in ascites, encephalopathy, and variceal bleeding, which are risk factors for SBP. In addition, the SBP rate also showed a decrease over the years. However, there was no specific change in the occurrence of hepatic hydrothorax, hepatorenal syndrome, or HCC.
All-cause and liver-related mortality rates showed no trend, and only all-cause mortality rate decreased in men during the observation period (P = 0.047, Exp[B] = 0.976) (Table 2). Although there was no change in the total number of hospitalizations per patient within a year, the hospitalization rate showed a decreasing trend, suggesting that the disease in patients with a milder grade of cirrhosis, mainly caused by HBV, showed improvement, whereas that in those with a severe grade of cirrhosis, mainly caused by alcohol, showed no improvement during the 10-year period. The proportion of patients undergoing liver transplantation has recently been increasing in South Korea; however, our data identified no trends, and only a small number of liver transplantation cases was found during the study period.28 In South Korea, liver transplantation is mainly performed in a few mega-sized hospitals, which might have influenced our study results.
The HBV treatment rate increased steeply, showing a constant increasing trend (P < 0.001, Exp[B] = 1.019), reaching up to 87.3% in 2017 (Supplementary Table 1), and the number of newly enrolled patients was lower in the HBV group than in the alcohol group, suggesting a higher adherence to treatment and regular follow-up in the HBV group. Along with these trends, the liver function improved in the HBV group, as indicated by the CTP and MELD-Na scores (P < 0.001, B = −0.025 and P < 0.001, B = −0.292, respectively). Similarly, the rates of decompensated liver cirrhosis, severe grades of ascites and hepatic encephalopathy, and hospitalization showed improvement. Despite the improved liver functions, the occurrence of HCC in the HBV group did not decrease during the study period and showed a higher rate than that in the alcohol group. Despite the antiviral medications, needs for HCC prevention remain unmet, and further studies on anti-cancer strategy are warranted.
The alcohol group showed an increased treatment rate (P < 0.001, Exp[B] = 1.054), but more than half of these patients were still consuming alcohol (Supplementary Table 2). Liver function, represented by the CTP, MELD, and MELD-Na scores, was poorer in the alcohol group than in the HBV group and showed a deteriorating trend during the 10-year period. Although the rate of abstinence showed improvement from 25.6% in 2008 to 45.0% in 2017, due to poor compliance to treatment and abstinence, the MELD score and proportion of patients with CTP class C increased. While the MELD score in 2008 between patients with and without abstinence showed no difference (13.14 vs. 12.75, respectively, P = 0.560), there was a significant gap in the MELD scores between patients with and without abstinence in 2017 (13.05 vs. 14.24, respectively, P = 0.027), reflecting the bipolarizing liver function between the two patient groups over time. In addition, the aspartate transaminase to platelet ratio index and Fibrosis-4 Index, which represent the underlying fibrosis of liver cirrhosis, showed worsening trends in the alcoholic cirrhosis group, whereas no change was observed in the hepatitis B group during the study period. More than half of the patients (51.4–65.3%) had decompensated liver cirrhosis with no change over time. Contrarily, the number of patients with severe grades of ascites and hepatic encephalopathy decreased, and the rate of variceal bleeding also showed a similar decreasing trend. Although the overall occurrence of HCC was lower in the HBV group, the alcohol group showed an increasing trend (P = 0.009, Exp[B] = 1.046). Furthermore, the alcoholic cirrhosis patient group showed higher all-cause and liver-related mortality rates during 2008–2017 than the patient groups with other etiologies (9.5% vs. 4.3%, P < 0.001, 6.9% vs. 3.3%, P < 0.001, respectively).
In conclusion, the nationwide vaccination program and use of antiviral medication have led to a decrease in the number of patients with liver cirrhosis caused by HBV and have improved the severity and clinical outcomes of these patients. Currently, alcohol consumption has become the most prevalent and utmost cause of liver cirrhosis. Alcoholic patients still presented poor treatment adherence, and the severity of cirrhosis showed no improvement in these patients. National policies for adequate management of alcoholic patients, along with environmental support and effective approaches in the society for abstinence, are essential.
Our study has some limitations. First, this study is based on clinical records of retrospective data from tertiary hospitals. A detailed history of the quantity of alcohol consumed and the presence of abstinence might be limited, and the enrolled patients are more likely to have severe liver cirrhosis. Furthermore, information regarding the number of follow-up visits and the duration of follow-up for each patient is lacking. Moreover, as the patients were enrolled from only six institutions, our results may have selection bias not representative of the true trends. As part of an effort to overcome selection bias, we recruited patients from widely distributed district hospitals in South Korea; even then, selection bias by recruiting patients from tertiary hospitals may have influenced on the severity of cirrhosis. Second, not all cases of NAFLD, autoimmune hepatitis, PBC, and PSC were confirmed by liver biopsies. Moreover, the number of patients with these diseases per year was relatively small compared to those included in the HBV and alcohol groups. Third, we enrolled patients from 2008 to 2017 and could not, therefore, present the effect of direct antiviral agents for HCV, which was only introduced in South Korea in 2016. Further studies including patients treated with direct antiviral agents in the late 2010s and early 2020s are needed to demonstrate the trends in cirrhosis due to HCV. Lastly, patients with alcoholic liver cirrhosis had worse liver function than those with HBV, and this disparity may have influenced the deteriorating liver function in alcoholic patients. Further studies comparing similar underlying liver function among different etiologies are warranted.
 XML Download