

 PDF
PDF Citation
 Print
Print


INTRODUCTION
The prevalence of non-alcoholic fatty liver disease (NAFLD) is significantly increasing in direct relation with the incidence of obesity. One study reported that nearly 30% of children with obesity had NAFLD.1 NAFLD is diagnosed when hepatic steatosis is present in imaging or histology, while excluding secondary causes of hepatic fat accumulation.2
Thyroid hormones are known to play an important role in regulating insulin resistance and lipid metabolism, which are known to affect the pathogenesis of NAFLD.3 Impaired thyroid hormone signaling reduces fatty acid utilization and the glucose-sensing machinery of β-cells in the liver, which contributes to hepatic insulin resistance.4 Other factors, such as oxidative stress, lipid peroxidation, and triglyceride accumulation, are caused by excessive thyroid-stimulating hormone (TSH) and induce liver damage.56 In addition, elevated TSH has a positive association with obesity through the mechanism of increasing the number of adipocytes; one study reported visceral adipose mass was the best predictor for TSH elevation.789 Thus, thyroid hormones may have a close relationship with liver disease, especially the pathogenesis of NAFLD and non-alcoholic steatohepatitis (NASH).10 In adults, subclinical hypothyroidism (SH) has been considered as a risk factor for metabolic syndrome and NAFLD. Furthermore, the possibility of liver steatosis improvement through SH treatment is also raised.1112 However, the current findings regarding the association of NAFLD with thyroid function remain controversial in children.1314
When treating NAFLD, detecting disease stage is important. In children, invasive methods such as liver biopsy can be difficult to perform. Scoring systems such as the fibrosis-4 (FIB-4) index and the aspartate aminotransferase to platelet count ratio index (APRI) can detect advanced fibrosis and disease progression more easily in patients with NAFLD.15 The clinical value of these markers is useful, so if any association were identified between these markers and SH, then TSH level could be used as a new biomarker for disease severity. A previous study reported a close relationship between thyroid function and NAFLD severity; specifically that advanced fibrosis was significantly higher in subjects with low to normal thyroid function and SH than in those with normal thyroid function.16
Therefore, we aimed to evaluate the prevalence of SH in NAFLD patients, and the association between NAFLD and SH in children. The second aim of the study was to assess the relationship between TSH elevation and liver disease severity in pediatric NAFLD patients.
METHODS
Patients and study design
Between January 2015 and December 2019, patients aged 4 to 18 years who had been diagnosed with NAFLD were included in this multicenter retrospective study, which was conducted at the pediatrics departments of 10 centers in Korea: Chungnam National University Hospital, Inje University Haeundae Paik Hospital, Chung-Ang University Hospital, Jeonbuk National University Hospital, Kyungpook National University Children's Hospital, Korea University Anam Hospital, Soonchunhyang University Bucheon Hospital, Nowon Eulji Medical Center, Keimyung University Dongsan Medical Center, and Inje University Ilsan Paik Hospital. The exclusion criteria were as follows: use of medications such as thyroid hormone and antithyroid drugs, or laboratory or clinical evidence suggesting or confirming an underlying chronic liver disease (e.g., viral hepatitis, autoimmune hepatitis, Wilson disease, or other liver disease).
Clinical and laboratory assessments
Body weight and height were measured by a trained technician, and the body mass index (BMI) was calculated by dividing the weight in kilograms by the square of the height in meters. Laboratory tests included the following: TSH, free thyroxine (FT4), alanine aminotransferase (ALT), aspartate aminotransferase (AST), gamma-glutamyl transferase (GTP), total cholesterol, triglyceride, low-density lipoprotein and high-density lipoprotein (HDL) cholesterol, and fasting glucose.
Definitions
NAFLD was diagnosed on the basis of bright or hyperechoic lesions on liver imaging and ALT level ≥ 30 IU/L.19 The degree of steatosis was classified as “mild” (grade I), “moderate” (grade II) and “severe” (grade III).20 After repeated thyroid function test, SH was defined as a serum TSH level of > 5.00 μU/L with an FT4 level between 0.90 and 1.80 ng/Dl.212223 Diabetes mellitus (DM) was defined as a fasting plasma glucose level of ≥ 126 mg/dL or a 2-hour oral glucose tolerance test result of ≥ 200 mg/dL.2425 Hypertension was defined as repeated blood pressure values at three separate visits greater than the 95th percentile for the age, sex, and height of the patient.2627
Statistical analysis
The data are presented as frequency and percentage for categorical variables and as the mean ± standard deviation for continuous variables. Differences in the study participants' characteristics were compared across subgroups using the χ2 test or Fisher's exact test for categorical variables and the independent t-test or Mann-Whitney's U test for continuous variables as appropriate. Differences in the study participants' characteristics were also compared across subgroups using the analysis of variance with Scheffe's post hoc test or the Kruskal-Wallis test with Dunn's post hoc test as appropriate. To check if the distribution was normal, we used Shapiro-Wilk's test. Univariate and multivariate analyses using logistic regression were performed to identify prognostic factors that are independently related to SH. For the prevalence of SH in pediatric NAFLD patients, the percentage and its Blyth-Still-Casella 95% confidence interval (CI) were calculated. Receiver operating characteristic (ROC) curve analysis was performed to assess the sensitivity and specificity of APRI for predicting SH. All statistical analyses were carried out using SPSS 24.0 (SPSS Inc., Chicago, IL, USA), and P values less than 0.05 were considered statistically significant.
RESULTS
Prevalence of SH in pediatric NAFLD patients and Baseline characteristics
A total of 428 patients were included, of which 29.4% were female, and the overall mean age was 12.18 ± 3.14 years. The prevalence of SH in pediatric NAFLD patients was 13.6%. The prevalences of SH according to the steatosis grade of liver sonography were 1.1%, 11.0%, and 55.4% in mild, moderate, and severe, respectively.
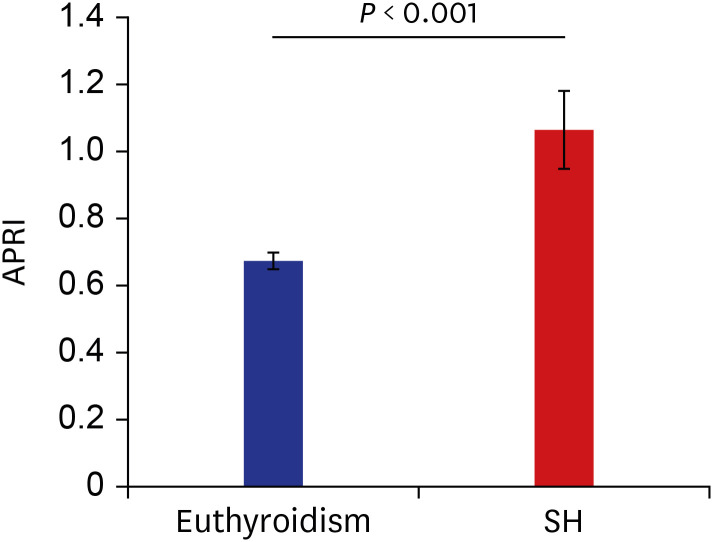
The characteristics of the study subjects according to TSH status are shown in Table 1. In comparison by TSH status, AST and ALT levels were higher in patients with SH than in those with euthyroidism. Although there was no short stature in both groups, significantly lower height z-score was observed in the SH group. The steatosis grade of liver sonography and the APRI score, a noninvasive marker of liver fibrosis, were also significantly higher in patients with SH than in those with euthyroidism (Fig. 1). However, total cholesterol, triglyceride, HDL-cholesterol, and presence of comorbidities were not different between patients with SH and those with euthyroidism.
Table 1
Patient characteristics according to TSH levels
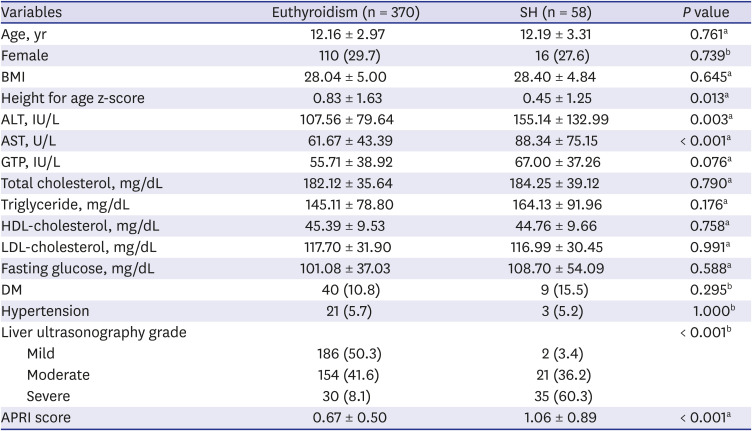
Values are displayed as either frequency with percentage in parentheses or the mean ± standard deviation. Shapiro-Wilk's test was employed to test the assumption of normality.
TSH = thyroid-stimulating hormone, SH = subclinical hypothyroidism, BMI = body mass index, ALT = alanine aminotransferase, AST = aspartate aminotransferase, GTP = gamma-glutamyl transferase, HDL = high-density lipoprotein, LDL = low-density lipoprotein, DM = diabetes mellitus, APRI = aspartate aminotransferase to platelet count ratio index.
aP values were derived from Mann-Whitney's U test; bP values were derived by Fisher's exact test.
Fig. 1
APRI score, a noninvasive marker of liver fibrosis, was significantly higher in patients with SH than in those with euthyroidism.
APRI = aspartate aminotransferase to platelet count ratio index, SH = subclinical hypothyroidism.
A comparison of parameters according to the steatosis grade as measured by ultrasonography is shown in Supplementary Table 1. Higher grades of steatosis confirmed by liver ultrasound were associated with higher levels of TSH, AST, ALT and prevalence of SH. In addition, in patients with moderate to severe grades of steatosis, BMI and GTP levels were higher than in those with mild severity, and the rate of diabetes increased.
Related factors of SH in pediatric NAFLD patients
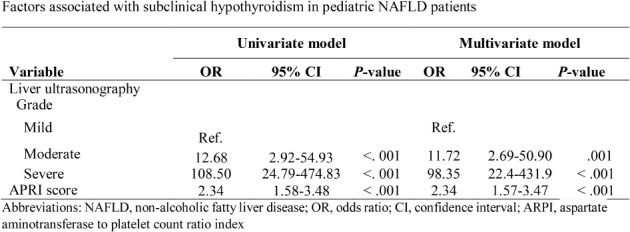
A univariate analysis of factors associated with SH in pediatric NAFLD patients found that SH was associated with AST, ALT, steatosis grade by liver ultrasonography, and the APRI score. In multivariate analysis, SH was positively correlated with steatosis grade by liver ultrasonography and with the APRI score (Table 2). Compared to patients with euthyroidism, the proportion of APRI scores > 1.5 was significantly higher and the proportion of APRI scores < 0.5 was lower in patients with SH (Supplementary Table 2, Supplementary Fig. 1).
Table 2
Factors associated with subclinical hypothyroidism in pediatric NAFLD patients by univariate and multivariate analyses
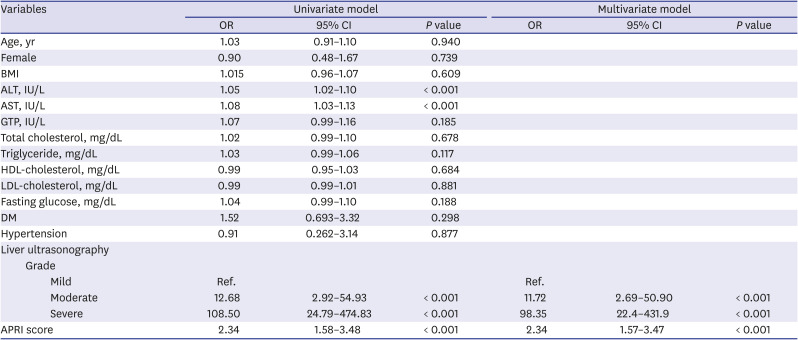
NAFLD = non-alcoholic fatty liver disease, OR = odds ratio, CI = confidence interval, BMI = body mass index, ALT = alanine aminotransferase, AST = aspartate aminotransferase, GTP = gamma-glutamyl transferase, HDL = high-density lipoprotein, LDL = low-density lipoprotein, DM = diabetes mellitus, APRI = aspartate aminotransferase to platelet count ratio index.
Cutoff value of APRI score for predicting SH
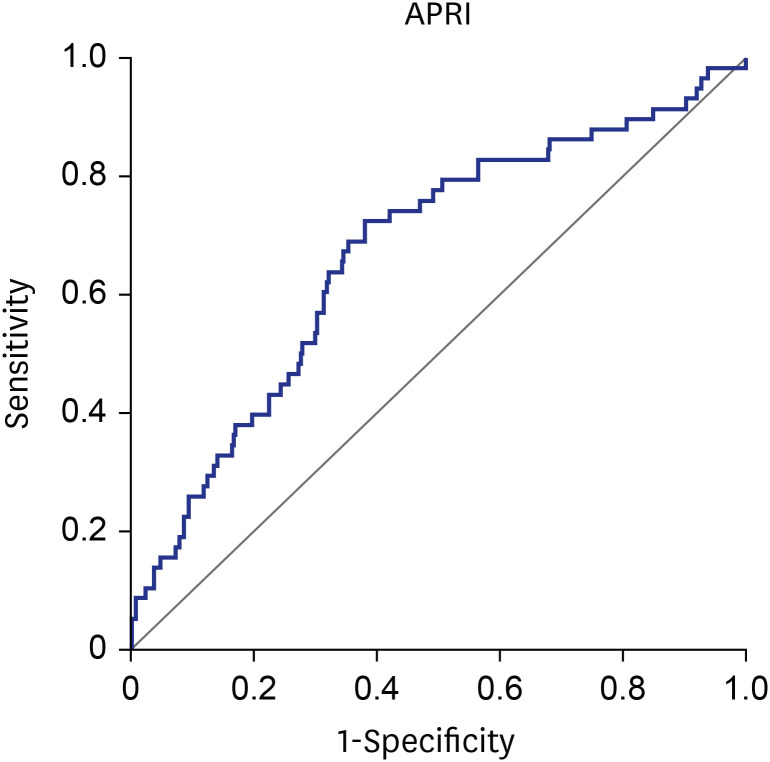
To evaluate the predictive accuracy of SH using the APRI score, area under the curve (AUC) values were calculated using an ROC curve. As a result, the APRI score was found to be significant as a predictor of SH when it was 0.6012 or higher (AUC, 0.670; P < 0.001) (Fig. 2). Sensitivity, specificity, positive predictive value, and negative predictive value were 72.4%, 61.9%, 23.0% and 93.5%, respectively (Table 3).
Fig. 2
Receiver operating characteristic curves of APRI to predict subclinical hypothyroidism.
APRI = aspartate aminotransferase to platelet count ratio index.

DISCUSSION
In this study, SH was often shown in pediatric patients with NAFLD, and these subjects had more severe steatosis in ultrasonography and higher liver fibrosis scores.
The liver plays an important role in the metabolism of thyroid hormones, and the thyroid hormones are also important to normal hepatic function.29 Previous studies suggested that SH have been thought to be important risk factors for NAFLD.30 Thyroid hormones stimulate lipolysis to generate circulating free fatty acids, and these are the major source of lipids for the liver.31 Elevated TSH stimulates TSH receptors, which are expressed in hepatocytes and which leads to hepatosteatosis via sterol regulatory element-binding protein-1c.32
A previous study reported a higher incidence of hypothyroidism among patients with NAFLD compared to controls (21% vs. 9.5%, P < 0.01) and especially among patients with NASH (25% vs. 12.8%, P = 0.03).33 A study of Korean adults3435 found the incidence of SH to be 3.7–5.4% in the general population. Our study showed a higher prevalence of 13.6%, and the higher the steatosis grade, the higher the prevalence of SH was statistically significant.
Recent studies reported a difference by gender in the risk of NAFLD among patients with SH. The Korean adult study found males with SH to have a higher risk of NAFLD (odds ratio [OR], 2.37; 95% CI, 1.09–5.12; P = 0.029),35 while another study reported that males had a 2.8-fold increased risk of NAFLD compared with females (OR, 2.836; 95% CI, 2.177–3.694).12 However, our study showed no gender difference in the association between euthyroidism and SH.
The most important finding of our study was that SH was related to the severity of NAFLD in children. Punekar et al.36 demonstrated that there were significant correlations between the levels of TSH and the severity of liver disease. In that study, patients with liver cirrhosis had significantly higher levels of TSH, compared with the controls. TSH might influence the progression of liver fibrosis, therefore the FIB‐4 index was higher in patients with SH than in those with euthyroidism.37
Similar to these studies, SH patients had more severe fatty infiltration in ultrasonography, and an APRI score greater than 0.6012 showed increased possibility of having SH. This finding suggests more severe liver damage is seen in patients with SH and NAFLD.
Thyroid dysfunction can cause metabolic changes by altering glucose and lipid metabolism. This finding is also evident in SH.38 Higher insulin levels and insulin resistance were positively correlated with TSH levels,39 and levels of common cholesterol and triglycerides were higher in cases of NAFLD with SH or overt hypothyroidism than in those with euthyroidism.40 In our study, metabolic profiles such as triglyceride and fasting glucose and comorbid metabolic syndromes such as DM were more frequent in patients with SH than in those with euthyroidism; however, the difference was not significant. Patients with a moderate or severe degree of hepatic steatosis were more likely to have DM.
The present study has several limitations. First, the retrospective study design may have affected the analysis variables. Second, liver biopsy was not performed in this study; however, most parents refuse this invasive procedure. Third, due to multicenter retrospective study design, sonography was not performed by a single radiologist, but the degree of steatosis was classified according to the reference guideline, and SH was also defined according to the references in the same unit. Fourth, changes in the sonographic or laboratory findings of NAFLD patients related to the therapeutic effect of SH and follow-up data of thyroid function test were not studied in this study. Further well-designed studies are needed to solve these limitations. Despite these limitations, our study is valuable because, we conducted study with relatively large-scale of pediatric patients and observed significant association between SH and severe steatosis of NAFLD.
In conclusion, this multicenter pediatric study showed a close association between NALFD and SH and between more severe hepatic steatosis and the liver fibrosis score in SH. TSH elevation can be taken as a predictor of a severe NAFLD. It is important to perform a thyroid function test in patients with NAFLD and follow-up periodically.
 XML Download