

 PDF
PDF Citation
 Print
Print


INTRODUCTION
Since its emergence, the coronavirus disease 2019 (COVID-19) has spread apace globally, with 81,658,440 confirmed cases (including 1,802,206 deaths) as of December 31, 2020.1 The impact of the COVID-19 pandemic has changed almost every aspect of life, from daily living on the socioeconomic dimension to direct damage and loss to the victims of the disease, with tremendous premature deaths and reduced life expectancies. Earlier findings confirmed that in the first 6 months of the outbreak, a total of approximately 4 million years of life were lost due to COVID-19 in high-incidence countries.2 In addition, more than a year's life expectancy is predicted to be lost in regions with a prevalence higher than 1 or 2%.3
While the significance of controlling the disease and deaths due to the infection is well-recognized, a limited number of studies have explored COVID-19-induced deaths, confirming factors such as older age and comorbidities of cardiovascular disease, hypertension, diabetes, congestive heart failure, chronic kidney disease, and cancer as risk factors for non-survival.45 Other studies showed that symptoms on admission such as headache and shortness of breath result in higher odds of death, while headache, runny nose, and sore throat did not.67 In addition, corroborating the association between shortness of breath and clinical outcomes, supplemental oxygen at admission was found to be a predictor for intensive care unit (ICU) admission or death.8
In Korea, by December 31, 2020, 61,769 individuals were confirmed to have COVID-19 and 917 had died of the disease.9 According to previous findings, the leading infected age group was those aged 45 to 64 in the overall cohort, while those aged 65 or above were more frequently in a severer state requiring mechanical ventilation.10 Early symptom presentations and comorbid conditions varied widely among patients, with the mainly displayed symptoms of cough (40.8%), fever (28.8%), and sputum (25.9%) and common comorbidities of hypertension (15.8%), diabetes (8.4%), and dementia (2.5%).10 However, despite the importance of determining risk factors for death in the general population, earlier Korean studies in COVID-19 patients focused mostly on the description of the demographic and clinical course of disease, while only a few underscored the determinants of definite clinical outcomes with a limited number of patients.
Therefore, our study aimed to determine the risk factors of death and severe illness requiring supplemental oxygen therapy from the demographic and clinical characteristics of COVID-19 patients in Korea. In particular, we focused on the early symptoms of the disease and how the symptomatic disease and the presence of each symptom at the time of admission are associated with the clinical course. With this aim, we analyzed data provided by the Korea Disease Control and Prevention Agency (KDCA) on the epidemiological and clinical profile of all patients, who were confirmed and discharged or deceased from the disease, enabling an unbiased investigation.
METHODS
Data collection and study participants
KDCA provides clinical-epidemiological profiles of patients confirmed with COVID-19 to researchers under the aim of building scientific evidence-based preventive measures against the current pandemic and its coming second wave. The profile of COVID-19 patients was collected by the Central Disease Control Headquarters and the National Medical Center through the electronic medical records of the individuals filled by physicians and attending clinical workers. The dataset provided by KDCA includes the clinical characteristics and epidemiological profile of 5,628 patients confirmed with COVID-19, who were discharged alive or dead until April 30, 2020. In this study, we analyzed a total of 5,068 patients with COVID-19, excluding 19 pregnant women and 544 individuals with missing data.
Statistical analysis
In this study, we performed statistical analysis to determine the impact of early symptoms on survival and severe disease requiring oxygen therapy. First, to compare demographic and clinical characteristics in COVID-19 patients according to their clinical outcomes (death and discharge) and the need for oxygen support (i.e., disease severity), we performed a χ2 test and Student's t-test. Need for oxygen support was defined from the maximum disease severity identified during the inpatient period, based on a previous definition of severity scores.10 Patients with no limitations of daily activities are defined as level 1, those with limitations of daily activities but with no need for supplemental oxygen therapy as level 2, those who need oxygen supplementation by nasal cannula as level 3, those who need oxygen supplementation via facial mask as level 4, those who need high-flow oxygen or non-invasive mechanical ventilation as level 5, those who need invasive mechanical ventilation as level 6, those who have multi-organ failure or in need for extracorporeal membrane oxygenation as level 7, and death as level 8. Among the 8 levels of disease severity, we compared patients in levels 1 and 2 against those in levels 3 to 8, based on the need for oxygen therapy.
The demographic and clinical features included sex, age, body mass index (BMI), number of comorbidities, vital signs on admission (systolic blood pressure, diastolic blood pressure, heart rate, and body temperature), number of symptoms on admission, prevalence of symptoms on admission, and laboratory findings from blood tests on admission (white blood cell, lymphocyte, hemoglobin, hematocrit, and platelet counts). The number of comorbidities were defined as the counted number of diagnosed diseases among the following, which were provided by the COVID-19 clinical-epidemiological profile data: diabetes, hypertension, chronic heart disease (chronic cardiovascular diseases excluding hypertension), asthma, chronic obstructive pulmonary disease, chronic kidney disease, malignancy, chronic liver disease, rheumatic/autoimmune diseases, and dementia. Among the symptoms on admission, representative symptoms of COVID-19 patients, including fever, cough, sputum, sore throat, rhinorrhea, myalgia, fatigue, dyspnea, headache, altered mental status, nausea/vomiting, and diarrhea were considered.
Second, the χ2 test and Student's t-test were also performed to analyze the difference in overall severity of the disease between those with or without symptoms on admission, by comparing the length of hospitalization, clinical outcomes (death or discharge), admission to the ICU (admitted or not admitted), and the highest disease severity level during hospitalization.
Finally, to explore the overall aim of the study, which is to determine the association between early symptoms and later clinical outcomes, including death and the need for supplemental oxygen therapy, we performed logistic regression analyses. Logistic regression models included sex, age, number of comorbidities, blood pressure, heart rate, and body temperature as the adjusting variables. A high correlation was suspected among the independent variables in the logistic regression models; however, this was not confirmed, because the number of variance inflation factors ranged from one to two, and the 95% confidence intervals of the estimated odds ratio were not too wide. The goodness of fit for the logistic regression models was assessed using C-statistics and the Hosmer-Lemeshow test; the models were found to be well-fitted. All statistical analyses were performed with SAS 9.4 (SAS Institute, Cary, NC, USA) and significance was determined at the 5% level.
Ethics statement
This study conformed to the Guidelines on De-identification of Personal Data of Korea and was approved by the Kyung Hee University's Institutional Review Board (IRB) [IRB No. KHSIRB-20-301(EA)] as a review exemption study. As the study used de-identified data, informed consent was waived by the board.
RESULTS
Demographic and clinical characteristics of COVID-19 patients
Table 1 shows the demographic and clinical characteristics of COVID-19 patients included in the study according to their clinical outcomes and the presence of oxygen therapy. Among the 5,068 patients with COVID-19, 555 died and 4,846 were discharged alive. Compared to the proportion of those who survived, a greater proportion of those who died from COVID-19 were female; aged over 80 years; had one or more comorbidities and a higher heart rate; and had a BMI, diastolic blood pressure, and/or body temperature of > 18 kg/m2, ≤ 80 mmHg, and ≥ 36.5°C, respectively. A higher number of patients had fever, fatigue, dyspnea, or altered mental status at the time of admission among those who died compared to the surviving group. On the other hand, the non-survivor group showed a lower incidence of cough, sore throat, rhinorrhea, myalgia, and headache as early symptoms than those who survived. Laboratory findings showed that white blood cell counts were higher while lymphocyte, hemoglobin, hematocrit, and platelet counts were lower in the non-survivor group than in the survivor group.
Table 1
Demographic and clinical characteristics
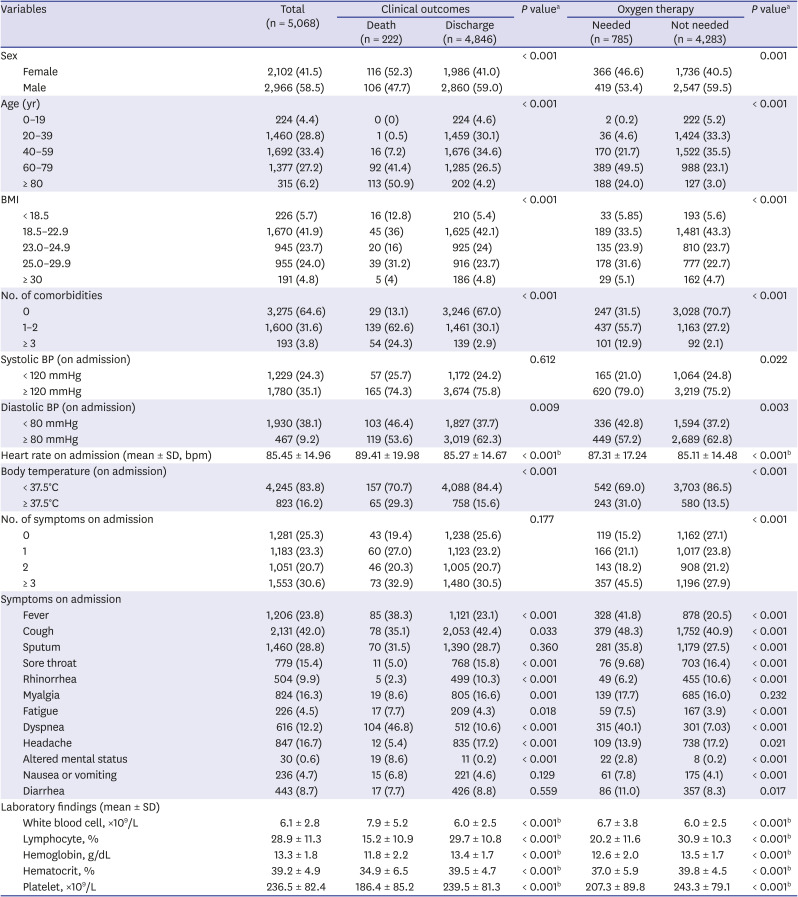
Of the 5,068 patients included in the study, 785 required supplemental oxygen therapy and 4,283 did not. Compared to those who did not require oxygen support, a greater proportion of individuals who required oxygen support were predominantly female; aged 60–79 years; had one or more comorbidities and higher heart rates; and a systolic blood pressure, diastolic blood pressure, and/or body temperature of ≥ 120 mmHg, ≤ 80 mmHg, and ≥ 36.5°C, respectively. Among the symptoms on admission, fever, cough, sputum, fatigue, dyspnea, altered mental status, nausea or vomiting, and diarrhea were more prevalent in the group requiring supplemental oxygen than in the group not requiring oxygen support. Conversely, fewer individuals with oxygen therapy had sore throat and rhinorrhea at the time of admission compared to those without the need for oxygen therapy. Laboratory findings showed that more patients needing oxygen support had higher white blood cell, lymphocyte, hemoglobin, hematocrit, and platelet counts than those without oxygen support.
Early symptoms of COVID-19 and treatment outcomes
Fig. 1 shows the prevalence of symptoms on admission among patients with COVID-19 in each age group. Cough was the most prevalent (2,131; 42.0%) among all patients, followed by sputum (1,460; 28.8%), fever (1,206; 23.8%), headache (847; 16.7%), and myalgia (824; 16.3%). Patients who experienced cough as one of the symptoms on admission mostly consisted of those aged 40–59 years, followed by those aged 20–39 years and 60–79 years. In all age groups under 80 years, cough was the most prevalent early symptom of COVID-19, followed by fever and sputum. Cough was also the most prevalent early symptom in patients aged 80 years or older, followed by myalgia and fever.
Fig. 1
Symptoms on admission among patients with coronavirus disease 2019 by age group. (A) Total, (B) 0–19 years, (C) 20–39 years, (D) 40–59 years, (E) 60–79 years, (F) ≥ 80 years.

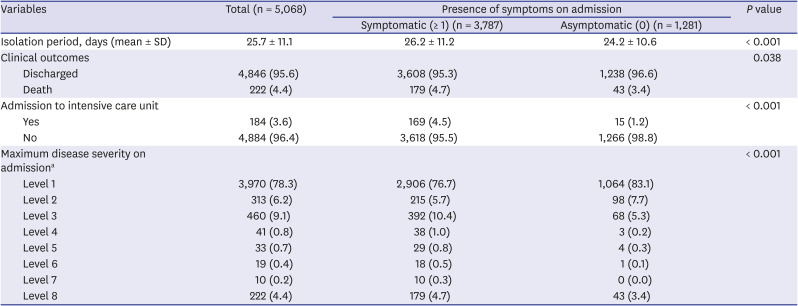
Table 2 displays the outcomes of treatment by the presence of symptoms on admission among COVID-19 patients. Overall, a total of 3,787 (74.7%) patients had one or more symptoms on admission, while 1,281 patients were asymptomatic at the time of admission (25.3%). Among the symptomatic patients, the average isolation duration (26.2 ± 11.2 days) was longer than that of the asymptomatic group (24.2 ± 10.6 days). The duration of isolation was long, because even after discharge, COVID-19 patients were only released from isolation 3 weeks after onset. In addition, patients with early symptoms had a higher proportion of deaths (4.7% vs. 3.4%) and admission to the ICU (4.5% vs. 1.2%), and those with disease severity levels 3–8 needed supplemental oxygen therapy (17.6% vs. 9.3%).
Table 2
Outcomes of treatment in coronavirus disease 2019 patients with respect to the presence of symptoms on admission
SD = standard deviation.
aLevel 1: Patients with no limitations of daily activities; Level 2: Patients with limitations of daily activities but no need for supplemental oxygen therapy; Level 3: Patients who need oxygen supplement by nasal cannula; Level 4: Patients who need oxygen supplementation via facial mask; Level 5: Patients who need high-flow oxygen or non-invasive mechanical ventilation; Level 6: Patients who need invasive mechanical ventilation; Level 7: Patients who have multi-organ failure or need extracorporeal membrane oxygenation; Level 8: Death.
Influencing factors of in-hospital death and supplemental oxygen therapy
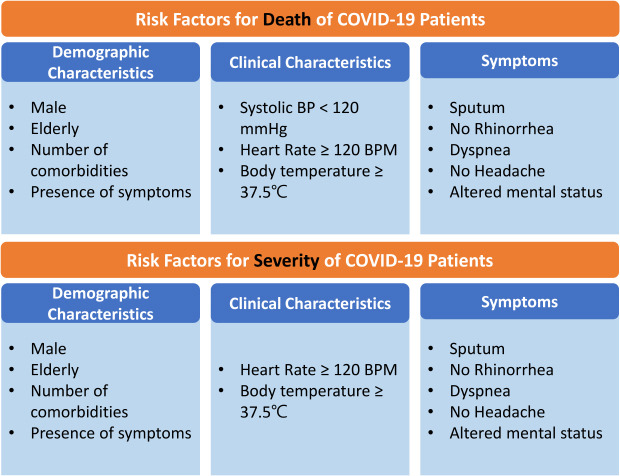
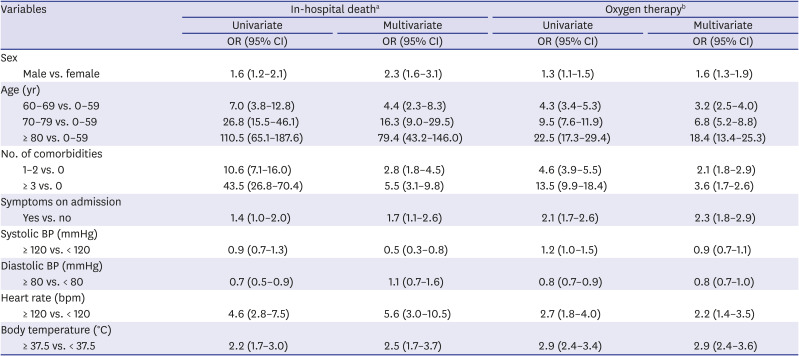
Table 3 shows risk factors associated with in-hospital death and severe cases that required supplemental oxygen therapy within COVID-19 patients. According to the results from univariate analyses, male sex, older age, presence of comorbidities, presence of symptoms on admission, lower diastolic blood pressure, higher heart rate, and higher body temperature were associated with higher crude odds of death and a severer state needing oxygen therapy. In addition, those who had systolic blood pressure of 120 mmHg or higher had a greater likelihood of requiring supplemental oxygen. In multivariate analyses, male sex, older age, higher number of comorbidities, presence of symptoms on admission, heart rate 120 bpm or higher, and body temperature 37.5°C or higher resulted in greater odds of in-hospital death and oxygen therapy.
Table 3
Risk factors associated with in-hospital death and severe cases requiring oxygen therapy
OR = odds ratio, CI = confidence interval, BP = blood pressure.
aC-statistics = 0.93, P value for the Hosmer-Lemeshow test = 0.768; bLogistic regression models (univariate and multivariate) with maximum disease severity level 3 or higher as the dependent variable (C-statistics = 0.83, P value for Hosmer-Lemeshow test = 0.008).
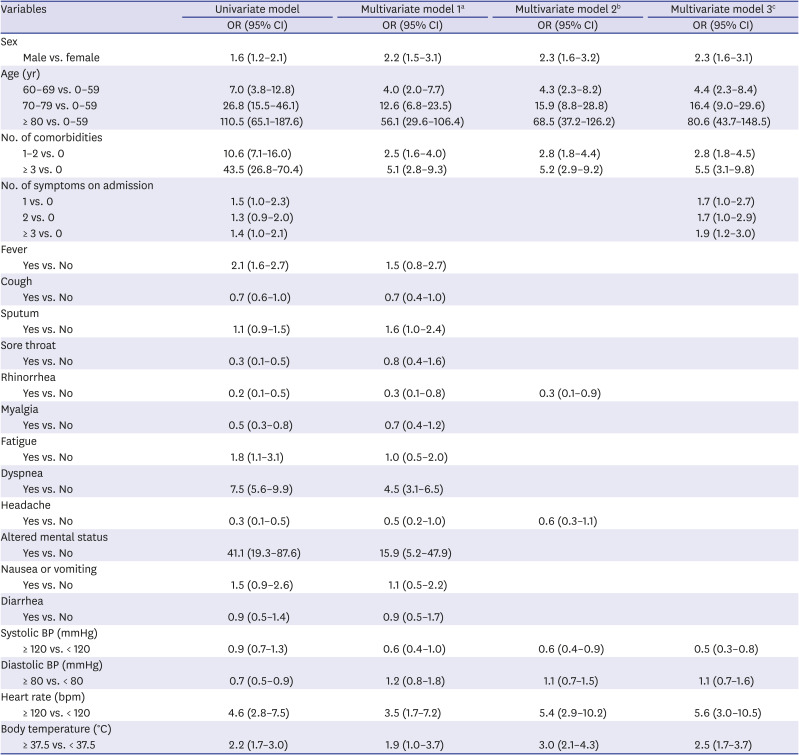
Table 4 displays the results of the logistic regression analyses on the association between the presence of early symptoms and in-hospital death in COVID-19 patients. In the univariate analysis, male sex, age 60 years or older, prevalence of one or more comorbidities, and having a single symptom on admission were related to higher odds of death during hospitalization compared to female sex, age below 60 years, no comorbidity, and asymptomatic status. In addition, those with fever, fatigue, dyspnea, altered mental status, heart rate 120 bpm or higher, and body temperature 37.5°C or higher resulted in greater crude odds of in-hospital death, while cough, sore throat, rhinorrhea, myalgia, headache, and diastolic blood pressure 80 mmHg or higher resulted in lower crude odds of death in hospital.
Table 4
Early symptoms associated with in-hospital death
OR = odds ratio, CI = confidence interval, BP = blood pressure.
aLogistic regression model for death in COVID-19 patients as the dependent variable and the presence of each symptom on admission as the main predictor variable (C-statistics = 0.95, P value for the Hosmer-Lemeshow test = 0.819); bLogistic regression model for death in COVID-19 patients as dependent variables and the presence of rhinorrhea and headache on admission were the main predictor variables (C-statistics = 0.93, P value for the Hosmer-Lemeshow test = 0.738); cLogistic regression model for death in COVID-19 patients as the dependent variable and the number of symptoms prevalent on admission as the main predictor variable (C-statistics = 0.93, P value for the Hosmer-Lemeshow test = 0.586).
In the multivariate analysis, after adjusting for sex, age, number of comorbidities, and vital signs on admission, patients with sputum (odds ratio [OR], 1.6; 95% confidence interval [CI], 1.0–2.4), dyspnea (OR, 4.5; 95% CI, 3.1–6.5), and altered mental status (OR, 15.9; 95% CI, 5.2–47.9) had higher odds of death, while patients with rhinorrhea (OR, 0.3; 95% CI, 0.1–0.8) and headache (OR, 0.5; 95% CI, 0.2–1.0) had lower odds of death. When rhinorrhea and headache were separately analyzed as independent variables and adjusted for sex, age, number of comorbidities, vital signs on admission, odds of death were lower in patients with rhinorrhea (OR, 0.3; 95% CI, 0.1–0.9) while insignificantly associated with headache at the point of admission. In the analysis with the number of symptoms on admission as the independent variable, a higher number of symptoms on admission resulted in higher odds of death, with the presence of one symptom resulted in 1.7-fold (95% CI, 1.0–2.7), two symptoms in 1.7-fold (95% CI, 1.0–2.9), and three or more symptoms 1.9-fold (95% CI, 1.2–3.0) higher mortality in patients. In all three multivariate models, patients had higher odds of death if they were male, aged 60 years or older, had one or more comorbidities, had systolic blood pressure 120 mmHg or lower, and heart rate 120 bpm or higher.
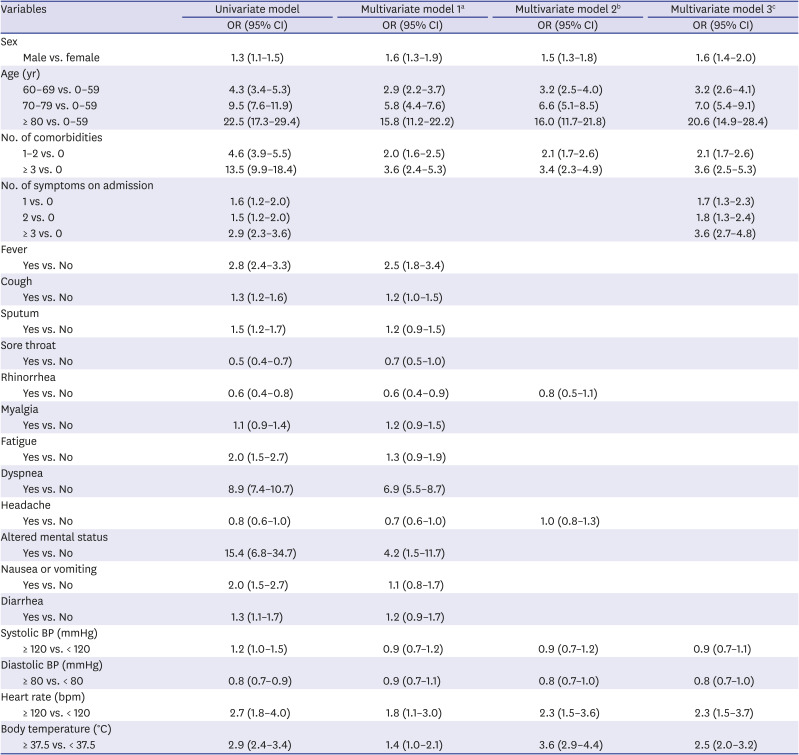
Table 5 shows the results of the logistic regression analyses on the association between the presence of early symptoms and severe illness requiring supplemental oxygen therapy. Results from the univariate analysis showed that male sex, age 60 years or older, prevalence of one or more comorbidities, and having one or more symptoms on admission were related to higher odds in more severe states requiring supplemental oxygen during hospitalization, compared to female sex, age below 60 years, no comorbidity, and asymptomatic status. In addition, those with fever, cough, sputum, fatigue, dyspnea, altered mental status, nausea or vomiting, systolic blood pressure 120 mmHg or higher, heart rate 120 bpm or higher, and body temperature 37.5°C or higher resulted in higher crude odds of disease severity level 3 or higher (i.e., in need of oxygen therapy) during hospitalization. In contrast, sore throat, rhinorrhea, headache, and diastolic blood pressure 80 mmHg or higher resulted in the opposite of lower crude odds to be critical patient in need of ventilation.
Table 5
Early symptoms associated with severe cases requiring oxygen therapy
OR = odds ratio, CI = confidence interval, BP = blood pressure, COVID-19 = coronavirus disease 2019.
aLogistic regression model for severe COVID-19 requiring supplemental oxygen therapy as the dependent variable and the presence of each symptom on admission as the main predictor variable (C-statistics = 0.87, P value for the Hosmer-Lemeshow test = 0.914); bLogistic regression model for severe COVID-19 requiring supplemental oxygen therapy as the dependent variable and the presence of rhinorrhea and headache on admission as the main predictor variables (C-statistics = 0.83, P value for the Hosmer-Lemeshow test = 0.080); cLogistic regression model for severe COVID-19 requiring supplemental oxygen therapy as the dependent variable and the number of symptoms prevalent on admission as the main predictor variable (C-statistics = 0.84, P value for the Hosmer-Lemeshow test = 0.143).
In the multivariate analysis, after adjusting for sex, age, number of comorbidities, and vital signs on admission, patients with fever (OR, 2.5; 95% CI, 1.8–3.4), dyspnea (OR, 6.9, 95% CI, 5.5–8.7), and altered mental status (OR, 4.2; 95% CI, 1.5–11.7) had higher odds of needing supplemental oxygen, while patients with rhinorrhea (OR, 0.6; 95% CI, 0.4–0.9), and headache (OR, 0.7; 95% CI, 0.6–1.0) had lower odds of being in such a state. When rhinorrhea and headache were separately analyzed as independent variables and adjusted for sex, age, number of comorbidities, vital signs on admission and odds of severe state in need of oxygen therapy were insignificantly associated with both rhinorrhea and headache at the point of admission. In the analysis with the number of symptoms on admission as the independent variable, a higher number of symptoms on admission resulted in higher odds of a severe state requiring oxygen therapy, with the presence of one symptom resulting in 1.7-fold (95% CI, 1.3–2.3), two symptoms in 1.8-fold (95% CI, 1.3–2.4), and three or more symptoms in 3.6-fold (95% CI, 2.7–4.8) higher mortality in patients. In all three multivariate models, patients who were male, aged 60 or older, had one or more comorbidities, had a heart rate of 120 bpm or higher, and whose body temperature was 37.5°C or higher had greater odds of severe illness with a need for supplemental oxygen therapy.
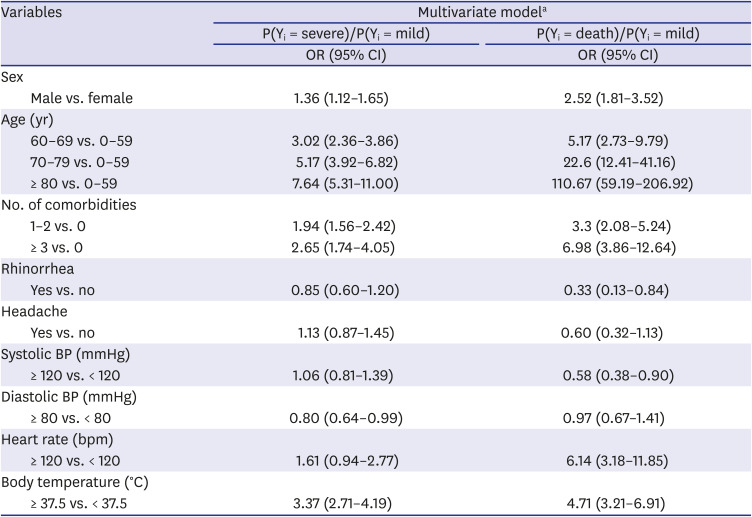
Table 6 presents the results of the polychotomous logistic analysis. The maximum severity on admission was considered as the outcome variable, and was used to categorize mildly affected, severely affected, and death patients. Mildly affected patients were defined as those who did not require oxygen therapy (levels 1–2), while severely affected patients were defined as those who required oxygen therapy (levels 3–7). The results obtained were similar to those obtained during dichotomous logistic analyses. Male sex, age ≥ 60 years, prevalence of one or more comorbidities, diastolic blood pressure ≤ 80 mmHg, and body temperature ≥ 36.5°C were related to a higher severity of the disease. Furthermore, the male sex, age ≥ 60 years, prevalence of one or more comorbidities, absence of rhinorrhea, systolic blood pressure ≤ 120 mmHg, heart rate ≥ 120 bpm, and body temperature ≥ 36.5°C were associated with a higher risk of death.
Table 6
Polychotomous logistic analysis for early symptoms associated with coronavirus disease 2019 severity
DISCUSSION
In this study, we described the demographic and clinical characteristics, as well as the early symptom presence in all patients with COVID-19 in Korea who had definite clinical outcomes (i.e., were confirmed to be discharged or deceased). Thereafter, the association between early symptoms of COVID-19 at the time of admission with death and severe illness during the isolated period were analyzed. Among a total of 5,068 patients included in the study, 222 (4.4%) were deceased and 4,846 (95.6%) were discharged alive; when estimated by the highest severity level reached during the period, 785 (15.5%) patients were at level 3 or above with supplemental oxygen requirements, while the other 4,283 (84.5%) did not need oxygen therapy. This result showed higher death and severe illness among the patients compared to a previous study in Korea, in which 1.4% were deceased and the other 98.6% were discharged alive among the patients who were no longer isolated; in addition, 93.0% were in level 1 and 2 with no need for supplemental oxygen therapy, while the other 7.0% were in a more severe state requiring oxygen support.10 Unlike previous studies in Korea, the present study included patients with clearly confirmed clinical outcomes and excluded those who were still admitted to the hospital. As an earlier study in Korea included all three dimensions of deceased, discharged, and hospitalized, it might have led to the inclusion of patients with lower severity levels. Thus, our findings could provide a more accurate estimation of death and disease severity progression within the Korean population.
Some of the clinical features described in our study include the laboratory findings on admission of COVID-19 patients. In a previously conducted study, white blood cell count was lower, while lymphocyte count, hemoglobin, and platelet count were higher in the survivor group.4 Corroborating results from our research showed that white blood cell counts were higher while lymphocyte, hemoglobin, hematocrit, and platelet counts were lower in the deceased than in survivors and patients with severe illness (i.e., oxygen support required) and those in a less severe state. However, previous findings confirm that these laboratory findings do not have a direct association with death or ICU admission when other factors were adjusted.51112
Another set of findings in this study was the presence of symptoms on admission and its association with later clinical outcomes. In this study, 3,787 (74.7%) patients were symptomatic, while 1,281 (25.3%) were asymptomatic at the time of admission. Among the symptoms, cough (2,131; 42.0%), sputum (1,460; 28.8%), and fever (1,206; 23.8%) were most prevalent in the total study population. However, when stratified by age, cough, fever, and sputum were the top three symptoms on admission in age groups under 80 years, while those aged 80 years or above showed the highest presence of cough, myalgia, and fever. It is notable that a considerably large proportion of infected cases were asymptomatic in the earlier phase. According to Jeong et al.,13 13.0% of patients with COVID-19 are pre-symptomatic, meaning they do not show any symptoms on admission and developed one or more after hospitalization. This implies that patients included in our study too could have developed more symptoms during the isolation period, in or out of the hospital. However, early asymptomatic infections in our study were 25.3%, which is higher than previous findings in Korea (13.0%) and China (7.9%).1314 Considering the data source used in our study and the study population, which includes all patients confirmed with COVID-19 and released from isolation in Korea, it can be inferred that earlier counts have underestimated the presence of asymptomatic cases.
Results of the current study show that the proportion of patients with fever, fatigue, dyspnea, or altered mental status at the time of admission were higher in the non-survivor group than in the survivor group, while those with cough, sore throat, rhinorrhea, myalgia, and headache as early symptoms took a higher proportion of the survivor group than the non-survivor group. In addition, individuals with fever, cough, sputum, fatigue, dyspnea, altered mental status, nausea or vomiting, and diarrhea more frequently required oxygen therapy, while those with sore throat and rhinorrhea did not. A similar association was found in previous studies: fever and shortness of breath or dyspnea were found to be predictors for higher odds of critical and mortal outcomes, while cough, diarrhea, runny nose, and headache were predictors for lower odds.6715 Particularly, rhinorrhea was also associated with lower odds of mortality in patients with simple rhinovirus infections.16
Furthermore, this study was based on secondary data from the Korea Disease Control & Prevention Agency; therefore, some possible risk and prevention factors were not considered. For example, vitamin D deficiency could be a risk factor of COVID-19 infection. To the best of our knowledge, this is the first study to investigate the factors influencing death and cases of severe illness needing oxygen support in Korea, particularly with a focus on early symptoms on admission. Despite the recognized importance of screenings and control of the infection as well as determinants of death, earlier studies in Korea focused more on descriptions of the clinical and demographical features in COVID-19 patients, while only a few analyzed factors influenced definite outcomes with a limited number of participants. In a previous study by Moon et al., patients with COVID-19 who were aged 70 years or older, with an existing malignancy, body temperature higher than 37.5°C, and with diabetes mellitus had higher odds of death compared to those aged under 70, without malignancy, body temperature 37.5°C or lower, and without diabetes.17 However, the study included patients in two hospitals in Gyeongsangbuk-do province, which cannot be extrapolated to other areas.
There are some limitations regarding potential bias within the current study. First, all epidemiological and clinical records were reported by physicians and healthcare workers. Therefore, as the record depends on providers' judgments, differences in defining a symptom or disease severity could be present depending on the recorder. However, as each item within the profile consists of guidelines for reporting (e.g., fever as body temperature of 37.5°C or higher), the gap between individuals is predicted to be minor. Second, in this study, we included patients who were confirmed and were released from isolation until April 30, 2020. In Korea, COVID-19 infection was largely in Daegu and Gyeongsangbuk-do province until the early phase of the outbreak due to the outbreak from the Shincheonji church cluster. In contrast, the second wave of the epidemic from August was mostly based in Seoul and surrounding areas. Thus, the demographic and clinical course may differ between the periods before and after April 30, 2020. However, as the pandemic continues, settles down, and becomes endemic, investigations of the disease should be carried out when regardless the end of the crisis.
In conclusion, as far as we could determine, this was the first study to investigate the association between early symptoms on admission, death, and severe illness that needs oxygen support among COVID-19 patients in Korea. The findings showed that cough, sputum, and fever are the most common symptoms on admission, while a considerable number of patients were asymptomatic. When analyzed for each symptom on admission, sputum, dyspnea, and altered mental status were related to higher odds of death among the patients, while the presence of rhinorrhea and headache showed the opposite. The same is true for factors influencing severe illness in need of oxygen support, except for sputum, which becomes insignificant, and fever, which results in higher odds of COVID-19-induced deaths. Thus, patients with high-risk early symptoms on admission, such as dyspnea and altered mental status, and those without low-risk symptoms of rhinorrhea and headache should be included in priority treatment groups.
 XML Download