

 PDF
PDF Citation
 Print
Print


INTRODUCTION
Cancer is a major cause of death and contributes to a high treatment burden for cure.12 As malignant tumors develop commonly in older adults, ongoing demographic changes in population growth and aging are expected to markedly increase cancer incidence and, correspondingly, the demand for anticancer treatment.345 Therefore, physicians need to be prepared and should focus on the current conditions of cancer occurrence and trends related to cancer management to provide patients with appropriate treatment.6
Radiotherapy (RT) is considered an essential treatment modality in the management of cancer; approximately 50% of cancer patients are treated with RT in Western countries.78 Over the last two decades, remarkable advances have been made by improving sophisticated imaging and technological advances in treatment delivery systems, which has resulted in dynamic changes in the RT landscape.910 Hence, it is necessary to evaluate how often RT is being implemented for cancer patients and how it has changed with these advances.
The purpose of this study was to assess the trends in RT utilization according to the modality in South Korea to understand the evolution of contemporary RT utilization and identify the implications of changing trends.
METHODS
Data source of RT
The Korean government has operated the National Health Insurance Service (NHIS) for over 40 years, which is primarily mandatory for all citizens and covers more than 98% of the entire population.11 Information on medical activities based on claims and reimbursement records of the NHIS is provided by the Korean Health and Insurance Review and Assessment Service (HIRA).12 We obtained 10-year data on RT utilization from 2010 to 2019 from the HIRA using the insurance codes associated with the radiation treatment plan. A total of 12 codes matching treatment planning with the following modalities were used in the analysis: 2-dimensional RT (2DRT), 3-dimensional conformal RT (3DCRT), stereotactic RT (SRT), proton RT (PRT), brachytherapy, and intensity-modulated RT (IMRT) (Table 1). The detailed methods are described in a previous study.13 The number of patients was used to assess the rate of RT utilization in total cancer patients (primary endpoint), whereas the number of RT applications was used to assess trends in RT utilization according to the modality (secondary endpoint). The number of patients can be 10–15% smaller than that of application due to re-irradiation in the same patient or boost planning during treatment.
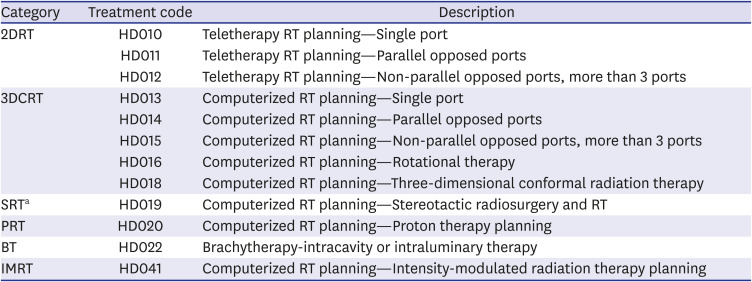
Table 1
Categorization of RT codes
HD017 (computerized radiotherapy planning intraoperative radiation therapy), HD021 (brachytherapy-mold therapy), and HD023 (brachytherapy-interstitial therapy) were excluded because their average number of applications were < 20 per year.
RT = radiotherapy, 2DRT = 2-dimensional radiotherapy, 3DCRT = 3-dimensional conformal radiotherapy, SRT = stereotactic radiotherapy, PRT = proton radiotherapy, BT = brachytherapy, IMRT = intensity-modulated radiotherapy.
aSRT included both stereotactic body radiotherapy and stereotactic radiosurgery.
![]()
Data source of nationwide cancer incidence
Nationwide cancer incidence was assessed using the Korean Statistical Information Service (KOSIS) data, conducted by the Statistics Korea (https://kosis.kr/index/index.do). Since cancer incidence was available until 2017, incidences from 2018 and 2019 were estimated using the annual increase estimate (AIE) calculated using Poisson regression analysis. Cancer incidence in the capital and non-capital areas was calculated by multiplying the nationwide incidence with the population ratio of capital and non-capital areas, which was assessed using KOSIS.
Study endpoints
The primary endpoint was the rate of RT utilization, which was calculated as the number of patients who received RT divided by the number of all cancer patients in the same period. The secondary endpoints of this study were trends in RT utilization according to the modality between 2010 and 2019. The AIE was calculated to quantitatively assess the trends. Changing trends in advanced modality applications, including IMRT and SRT, were specifically assessed. Differences between capital and non-capital regions were assessed in terms of the primary and secondary endpoints. The capital region includes administrative districts including Seoul, Incheon, and Gyeonggi-do, whereas non-capital areas include all other administrative areas.
RESULTS
Rate of RT utilization from 2010 to 2019
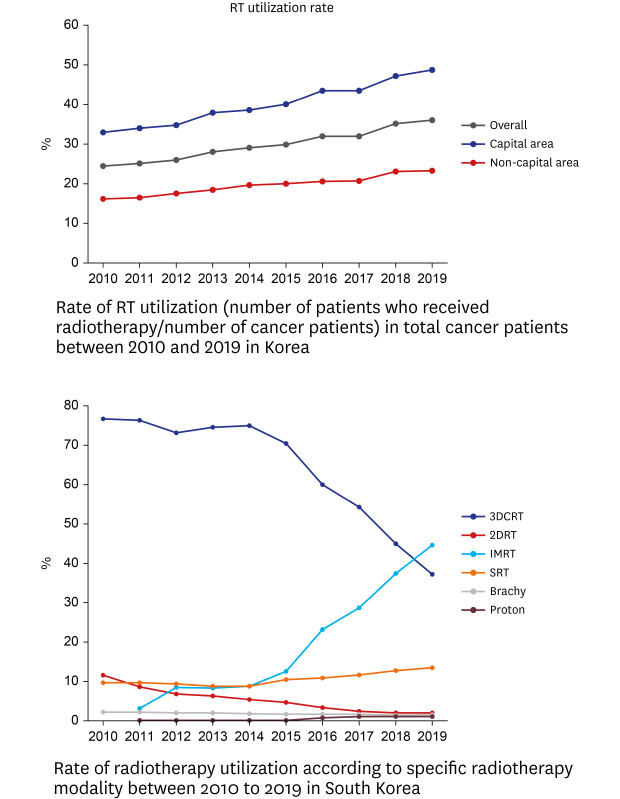
The number of cancer patients in South Korea was 208,154 in 2010, which gradually increased to 235,072 in 2019 (AIE, 0.5%, P < 0.001). The rate of RT utilization was 24.5% in 2010, which increased to 36.1% in 2019 (AIE, 4.5%; 95% confidence interval [CI], 4.5, 4.6; P < 0.001). In the capital area, the rate of RT utilization was 33.1% in 2010, whereas it was 48.9% in 2019, with an AIE of 4.6% (95% CI, 4.5, 4.7). In the non-capital area, the rate was 16.2% in 2010 and 23.4% in 2019, with an AIE of 4.2% (95% CI, 4.1, 4.4). These data, including the evaluation process, are shown in Table 2 and Fig. 1. The overall number of patients who underwent RT between 2010 and 2019 was 676,035 (Supplementary Table 1).

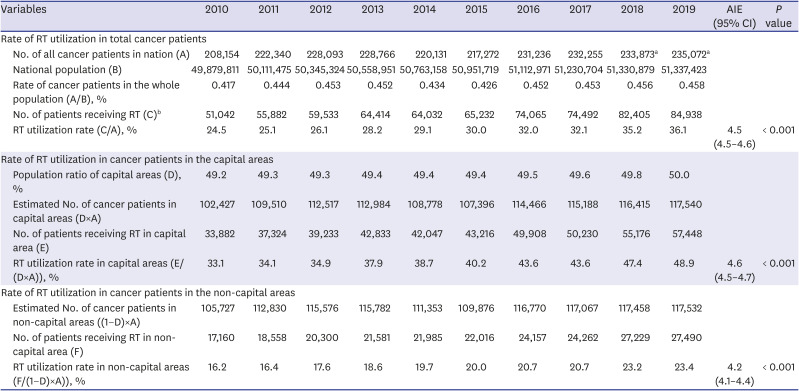
Fig. 1
Rate of RT utilization (number of patients who received RT/number of cancer patients) in total cancer patients and according to region between 2010 and 2019.
RT = radiotherapy.
![]()
Table 2
Rate of RT utilization in cancer patients
AIE = annual increase estimate, RT = radiotherapy, CI = confidence interval.
aEstimated using Poisson regression analysis of data from 2010 to 2018; bMight be small than the number of utilizations owing to re-irradiation in the same patient or adaptive planning (additional planning during a treatment).
![]()
Trend in RT utilization according to specific modalities
From 2010 to 2019 in South Korea, the total number of RT applications was 752,607 (Table 3). Among the modalities, 3DCRT was the most commonly used modality (467,133, 62.1%), followed by IMRT (149,417, 19.9%). However, during the study period, the use of 3DCRT steadily decreased, with an AIE of −7.1% (95% CI, −7.1%, −7.0%), whereas that of IMRT increased, with AIE of 33.5% (95% CI, 33.2%, 33.8%). The rate of IMRT utilization was lower than that of 3DCRT until 2018; however, the rate of IMRT utilization exceeded that of 3DCRT in 2019 (44.5% vs. 37.2%). Furthermore, the use of SRT and PRT increased, with an AIE of 4.8% (95% CI, 4.5, 5.1) and 49.1% (95% CI, 46.6, 51.7), respectively, whereas that of 2DRT and brachytherapy decreased with and AIE of −26.8% (95% CI, −26.4, −26.2) and −4.1% (95% CI, −4.7, −3.5), respectively. These 10-year trends in RT utilization nationwide are summarized in Table 3 and Fig. 2.
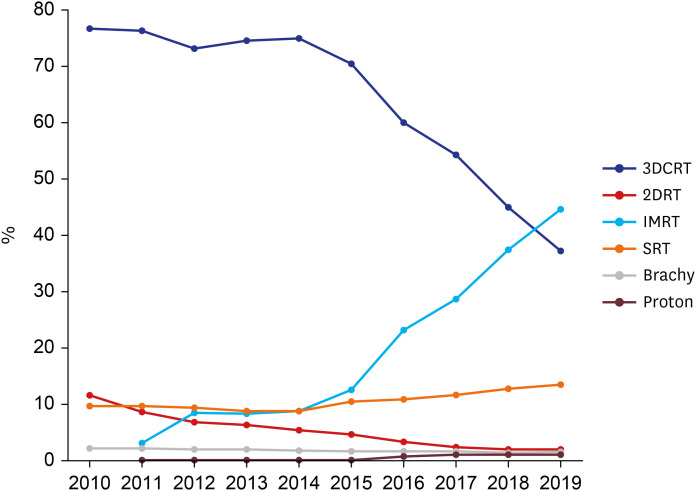
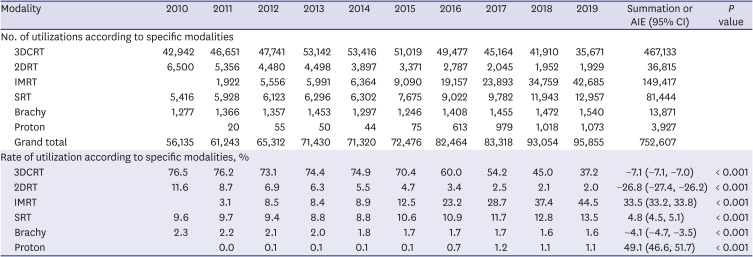
Fig. 2
Rate of RT utilization according to specific RT modality between 2010 to 2019 in South Korea.
RT = radiotherapy, 3DCRT = 3-dimensional conformal radiotherapy, 2DRT = 2-dimensional radiotherapy, IMRT = intensity-modulated radiotherapy, SRT = stereotactic radiotherapy, Brachy = brachytherapy, Proton = proton therapy.
![]()
Table 3
Rate of RT utilization according to specific modalities
RT = radiotherapy, AIE = annual increase estimate, CI = confidence interval, 3DCRT = 3-dimensional conformal radiotherapy, 2DRT = 2-dimensional radiotherapy, IMRT = intensity-modulated radiotherapy, SRT = stereotactic radiotherapy, Brachy = brachytherapy, Proton = proton therapy.
![]()
Utilization rate of specific RT modalities according to regions
From 2010 to 2019, the total number of RT applications in capital and non-capital areas were 505,841 and 246,766, which comprise 67.2% and 32.8%, respectively, of the nationwide utilization. In capital and non-capital areas, the rate of IMRT utilization was 3.2% and 3.1%, respectively, in 2011 and 45.7% and 42.1%, respectively, in 2019. The rate of IMRT utilization significantly increased in capital and non-capital areas, with an AIE of 33.8% (95% CI, 33.4, 34.2) and 32.9% (95% CI, 32.4, 33.5), respectively. The difference in the AIE between the capital and non-capital areas was significant (P < 0.001). The rate of SRT utilization was 11.4% and 6.2% in capital and non-capital areas, respectively, in 2010, which increased to 15.5% and 9.3%, respectively, in 2019. The rate of SRT utilization significantly increased in the capital and non-capital areas, with an AIE of 4.8% (95% CI, 4.5, 5.1) and 4.7% (95% CI, 4.2, 5.3), respectively. The difference in the AIE between the areas was significant (P < 0.001) despite a small numeral gap of 0.1% between AIEs. The rate of 3DCRT utilization continuously decreased in both the capital and non-capital areas. In the capital and non-capital areas, the rate of 3DCRT utilization was 75% and 79.5%, respectively, in 2010, which decreased to 32.9% and 46.4%, respectively, in 2019, with an AIE of −8.1% (95% CI, −8.2, −8.0) and −5.2% (95% CI, −5.4, −5.1), respectively. The difference in the AIE between the areas was significant (P < 0.001), demonstrating that the decrease was abrupt in the capital area. The comparative data between capital and non-capital areas are summarized in Table 4. Trends in the utilization of advanced modalities and 3DCRT are described in Fig. 3.
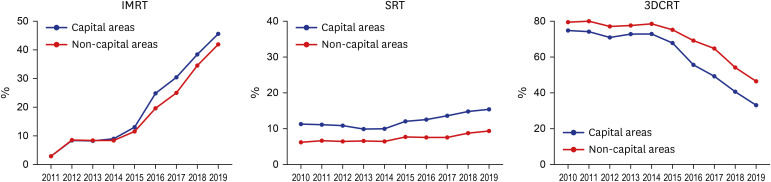
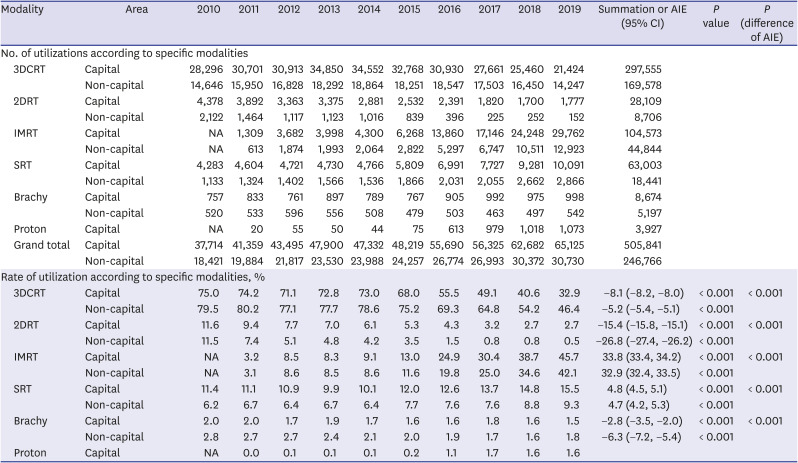
Fig. 3
Rate of advanced modality RT and 3DCRT utilization according to region (capital areas [blue lines] vs. non-capital areas [red lines]).
RT = radiotherapy, 3DCRT = 3-dimensional conformal radiotherapy, IMRT = intensity-modulated radiotherapy, SRT = stereotactic radiotherapy.
![]()
Table 4
Regional comparison of radiotherapy utilization according to specific modalities
AIE = annual increase estimate, CI = confidence interval, 3DCRT = 3-dimensional conformal radiotherapy, 2DRT = 2-dimensional radiotherapy, IMRT = intensity-modulated radiotherapy, SRT = stereotactic radiotherapy, Brachy = brachytherapy, Proton = proton therapy.
![]()
DISCUSSION
In the current study, we have reported the trends in RT utilization according to the modality and region in South Korea from 2010 to 2019. The rate of RT utilization gradually increased from 24.5% (2010) to 36.1% (2019). There was an abrupt increase in the use of IMRT utilization, coupled with a decline in the use of 3DCRT. IMRT has been more widely used than 3DCRT since 2019 and had the highest utilization rate. Moreover, the use of SRT has also been on the rise over the past decade, although increase in its utilization rate has been slower than of IMRT. The AIE regarding the trend toward a decrease in 3DCRT utilization and an increase in IMRT and SRT utilization was significantly higher in the capital area than in the non-capital area.
In the last decade, the rate of RT utilization has increased nationwide, with an AIE of 4.5%, including the capital and non-capital areas, with an AIE of 4.6% and 4.2%, respectively. In 2010, Smith et al.14 predicted that the demand for RT would increase rapidly from 2010 to 2020, and our results are consistent with the forecast. This growing trend stems from the increase in cancer incidence, which was attributed to the development of medicines, enhancement of quality of life, and a corresponding increase in life expectancy.15 We observed a steady decline in the percentage of patients receiving 3DCRT (AIE, −7.1%) and an abrupt increase in the percentage of patients receiving IMRT (AIE, 33.5%), a trend similar to that observed in our previous study.13 In particular, the rate of IMRT utilization has increased noticeably since 2016, which was associated with the extension of national insurance for IMRT by the NHIS. In 2016, the NHIS announced that the national insurance will cover IMRT for all tumors, if IMRT was implemented to spare an organ at risk or to reduce the irradiated dose to normal organs, aiming to reduce RT complications. In addition, we found that the rate of SRT utilization has increased untiringly in the last decade and has sustained above 10% since 2015. Similar to the reason for increasing IMRT utilization, the increase in SRT utilization was due to the change in the NHIS policy, which expanded the coverage of SRT from craniospinal tumors or inoperable lung cancer to whole body tumors in 2015. In these comprehensive insurance environments, the utilization of advanced RT has grown, indicating that the use of IMRT outpaced that of 3DCRT, and the utilization rate of SRT reached 13.5% in 2019.
These practice changes were the reflection of the increased incidence and the updated practice guidelines of several high incidence malignancies in Korea, which influenced the national insurance policy to be changed accordingly. According to the recent cancer statistics in South Korea, common cancer types, with more than 10,000 new cases per year, included cancers of stomach, colorectum, liver, lung, breast, and prostate (except thyroid cancer).16 Among them, RT utilization has steadily increased recently in treating cancers of breast, lung, prostate, and liver, in which the advanced RT modalities were commonly utilized. Moreover, along with the increasing proportion of the long-term cancer survivors, the awareness regarding the need to reduce sequelae related to cancer management has emerged.17 Consequently, the intention of RT has expanded beyond the cure of cancer to include reducing toxicity, which affects patient quality of life.9101819 Therefore, it can be speculated that the use of advanced RT modalities such as IMRT and SRT, which have enabled the irradiation of tumors with high radiation doses and reduced treatment-related toxicity, has increased nationwide. Specifically, IMRT uses advanced planning software and a dynamic multileaf collimator to produce a highly conformal plan that enables dose escalation to tumor and protection to normal organs.1820 SRT delivers high doses precisely in a short treatment time by implementing numerous beams, frequent use of noncoplanar beam arrangements, use of inhomogeneous dose distributions, and advanced image monitoring,2122 which distinguish SRT from conventional RT. It has been reported that IMRT provides the improvement in therapeutic ratio compared to 3DCRT.232425 Several meta-analyses demonstrated that IMRT decreases the incidence of radiation-induced toxicities without compromising oncologic outcomes, in the setting of primary treatment application as well as repeated RT courses.26272829 IMRT has been used with application rates ranging from 40% to 76% globally, which is on the way to replace conventional RT modality (e.g., 3DCRT).153031 SRT started the dissemination for management in a variety of disease sites, including oligometastases and spine, lung, prostate, liver, and head and neck tumors.103233 Overall, our study showed that changes in RT practice patterns were directed toward improving tumor control and reducing post-RT complications. Thereafter, to provide optimal advanced RT to cancer patients while executing its unique properties within these increasing utilizations of advanced RT, a strategy related to qualitative evaluation that monitors whether advanced RT is performed while maintaining its quality might be required.343536
We found small gaps in the annual increase of IMRT and/or SRT and correlating gaps in the annual decrease in 3DCRT and 2DRT between the capital and non-capital areas. These differences between the capital and non-capital areas were not associated with inadequate access to advanced medical care in non-capital areas, but they were associated with the concentration of medical institutions in the capital area and patients preference for hospitals located in the capital area,37 which was mentioned in a previous study.13 More than 50% of medical resources, in terms of general hospitals and medical doctors, are concentrated in the capital areas of South Korea.26 This phenomenon can be accelerated further as cancer patients become increasingly knowledgeable about their disease and treatment including RT. We should strive to establish balanced settlement of facilities capable of providing advanced RT across South Korea, so that all cancer patients can access optimal treatments with convenience.838 As application of advanced RT modalities becomes common, efforts to standardize RT techniques and reduce technical difference are necessary, to assure quality of treatment across all regions.
This study has several limitations. Because the claims and reimbursement records from the HIRA include only insured treatment, uninsured patients such as those with benign diseases that are not covered by insurance or foreigners were excluded. In addition, while our data simply examined the national rate of RT utilization according to the modality and region, it did not reflect RT fractionation patterns (e.g., hypofractionation), suggesting the use of RT advances.
In conclusion, our results show the growing utilization of advanced RT during the past 10 years regardless of the administrative region, showing that IMRT adoption ranked the highest and SRT continued to increase as a latecomer. The growth trend of advanced RT applications has reflected the practical implication of RT, which was toward reducing treatment-related toxicity and improving the therapeutic ratio. Accordingly, we should ensure nationwide implementation of advanced RT, which is suitable as a future standard RT modality.
 XML Download