

 PDF
PDF Citation
 Print
Print


INTRODUCTION
In 1984, 14 pediatric surgeons (PSs) established the Korean Association of Pediatric Surgeons (KAPS) and Korean PSs have since made steady progress. During the past 35 years, 155 PS and trainees have registered with the KAPS, and in 2019, 49 who were under the age of 65 years were actively working in Korea.1 In 1991, for the first time in Korea, a national survey of chief pediatric surgical diseases was conducted with members of the KAPS.2 Since then, national surveys of these diseases have been performed with KAPS members every year, and the members frequently communicate with each other through regular meetings and academic conferences.
In Korea, a surgeon who has trained in general surgery becomes qualified as a PS when he/she completes a fellowship in pediatric surgery at an institution accredited by the KAPS. In the past, general surgeons (GSs) without a pediatric surgical subspecialty have often performed surgery on children, and many pediatric surgeries are still being performed by GS. This is because the concept and policies of the pediatric surgical subspecialty are not well established, and there is no consensus on whether GS with an adult surgical subspecialty should treat pediatric patients. There are still some tertiary hospitals without PS in Korea. The involvement of GS in the care of pediatric surgical patients has also occurred for those with the main pediatric surgical diseases, such as congenital anomalies, and neonatal intensive care unit (NICU) patients. Several studies have reported that the outcomes of surgery for some main pediatric surgical diseases are better when the surgery is performed by PS than when performed by GS.3456789
During the development of surgery, interest in surgical subspecialists has increased, and since 2013, the Korean Surgical Society has promoted subspecialty certification. As a result, the awareness of surgical subspecialists has gradually risen not only among surgeons but also among the public. As such, in the current study, we were interested in the degree of involvement of PS and GS in the treatment of pediatric surgical diseases in Korea and what the outcomes are.
Therefore, the purpose of our study, which used the National Health Insurance Service (NHIS) database, was to 1) investigate the involvement of PS and GS in pediatric surgery in Korea, 2) compare the outcome of surgery in a specific cohort by analyzing NICU patients, and 3) calculate the workload of the PS and estimate the appropriate PS workforce in Korea.
METHODS
This study was a retrospective cohort study that used the NHIS database. The NHIS database contains all claims data for the population covered by the National Healthcare Insurance program and Medical Aid program in Korea. The data were given to the researchers after de-identification, following the request to use the data for research purposes.10 The big data of the NHIS database used in this study included all health insurance subscribers from 2002 to 2017, and it was structured by combining the qualification database, treatment database, and clinic database. The qualification database included basic information about the participants, who were NHIS subscribers and Medicare recipients (but not foreigners), and it provided information about their sex, age, location, type of subscription, and socioeconomic variables, such as income rank, disability, death, and so on. The treatment database contained a statement, details of the treatment, the type of disease, and details of the surgical patient's prescription. The clinic database provided information about the clinics' status, facility, equipment, and personnel by type, establishment, and location (city, county, and district). The big data did not include a resident registration number in order to protect personal information, but a personal serial number was provided that could link the medical information and clinic information.
The primary outcome measured the following in the pediatric surgery that was performed from 2002 to 2017: 1) the percentage of surgeries performed by PS according to the patients' age and year, 2) the percentage of surgeries conducted by PS in terms of the index operation and surgical cases of main pediatric diseases, and 3) the mortality of patients who underwent acute abdominal surgery in the NICU. The secondary outcome was an estimate of the PS workforce that would be appropriate in Korea.
Study population
We used the NHIS database to collect all surgical data from pediatric and adolescent patients (age < 19 years) in hospitals nationwide from January 2002 to December 2017. These data included the sex of the patient, the location of the operation, the age at the time of the operation, the diagnostic and surgical codes at the time of surgery, number of days in hospital, and so on. In addition, the patients who were admitted to the NICU were assessed in terms of body weight at birth and deaths within 30 days, 180 days, and 365 days of birth.
We selected 288 surgical codes for the pediatric surgery area from all codes for surgery in Korea's Health Insurance Review and Assessment Service (Supplementary Table 1). This classification was performed by 5 PS (Oh C, Chang HK, Lee S, Ahn SM, and Seo JM) who participated in this study. The NHIS provides data for the administrative districts of each city (Si), county (Gun), and district (Gu). However, it does not provide specific regional information in the districts (Gu). Therefore, the survey could not be conducted by matching the data of a specific hospital in a specific area. As such, we devised a way to identify a hospital that specializes in pediatric surgery. By selecting the index operation (Table 1), which is difficult to perform unless by a PS, the hospital with the PS was considered to have the highest index operation rate among the NHIS data. We surveyed the number of index operations performed in all hospitals nationwide from 2002 to 2017 using the NHIS data. From 2002 to 2017, the 37 hospitals where KAPS members actually worked and the top 37 hospitals with a large number of index operations were matched. The number of hospitals matched in the district (Gu) was identical to the number of hospitals where KAPS members worked in the district (Gu). The pediatric surgery performed in these 37 hospitals was considered to be performed by PS, and the pediatric surgery conducted in the other hospitals was considered to be performed by GS.
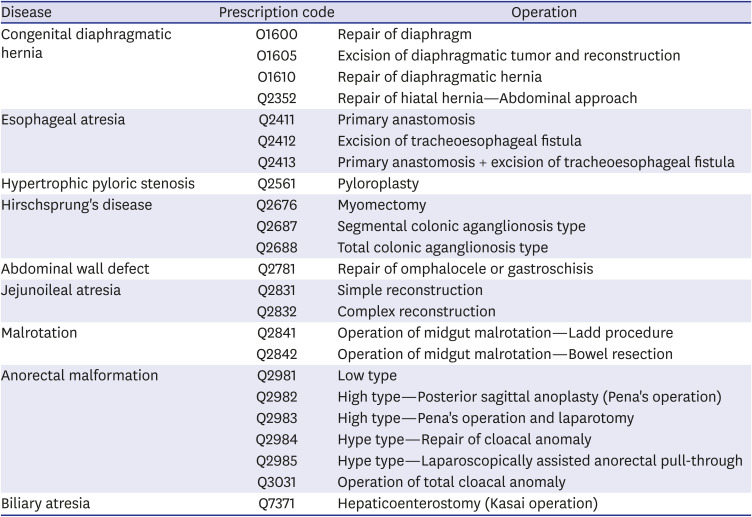
Table 1
Index operations
![]()
NICU patients
We analyzed hospitalized NICU patients who underwent surgery for acute abdomen. Because patients admitted to the NICU are assigned a NICU admission fee code, we classified patients with this code as NICU patients. In this study, acute abdominal surgery in NICU patients was defined as a case of surgery for intestinal problems, such as necrotizing enterocolitis, spontaneous intestinal perforation, meconium-related ileus, or non-meconium-related ileus (Table 2). In order to compare the results of the patients' acute abdominal surgery, we examined their mortality within 30 days, 180 days, and 365 days of birth.
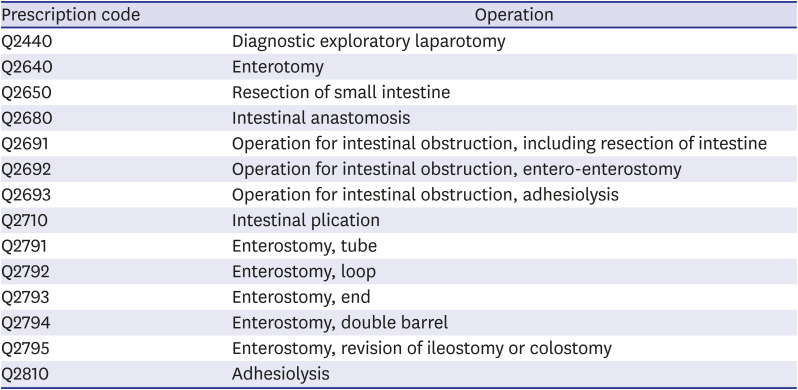
Table 2
Acute abdominal surgery in neonatal intensive care unit patients
![]()
Analysis of recent trends in pediatric surgery
To examine the recent trends in pediatric surgery, we further analyzed 13 main pediatric diseases, which are relatively common congenital anomalies and benign diseases, that occurred during the last 5 years of the study period.
Estimation of the PS workforce in Korea
It is not easy to identify the appropriate number of PS for any country. This is because various factors, such as the country's population model, medical environment, and economic condition, work in combination. We estimated the number of PS currently needed in Korea for each situation by assuming that PS would perform all operations in terms of the index operation, surgeries for main pediatric diseases, acute abdominal surgeries in the NICU, and all pediatric surgeries. We examined the number of PS in the Organisation for Economic Co-Operation and Development member countries and the countries surrounding Korea.11 Furthermore, we looked at the gross domestic product per capita of each country surveyed. The gross domestic product per capita data were for 2019, and in US dollars, as reported by the World Bank. Based on this, we attempted to estimate the appropriate number of PS required in Korea in the future.
Statistical analysis
The NICU patients' mortality after acute abdominal surgery was compared using the χ2 test or Fisher's exact test. The Kaplan-Meier survival curve for after acute abdominal surgery, according to the case volume, was calculated and a log-rank test was performed. All analyses were performed using SAS version 9.4 (SAS Institute, Cary, NC, USA) and P < 0.05 was considered significant.
RESULTS
Role of PS in pediatric surgery from 2002 to 2017
The total number of surgeries, which were conducted in Korea from 2002 to 2017 and analyzed using 288 pediatric surgical codes, was 3,721,554 and 232,597 were performed annually. The absolute number of pediatric surgeries increased by 124% from 2002 to 2017. Approximately 10.25% of the total number of pediatric surgeries was performed by PS. The percentage of surgeries performed by PS was approximately 8.32% in 2002, and it was increased to approximately 15.92% in 2017 (Table 3). According to the Statistics Korea, the number of people under the age of 19 years in Korea steadily decreased from 12,450,123 in 2002 to 9,225,025 in 2017.12 The number of pediatric surgeries for this population increased by approximately 168%, from 15 cases per 1,000 pediatric population in 2002 to 25.15 cases in 2017 (Fig. 1).
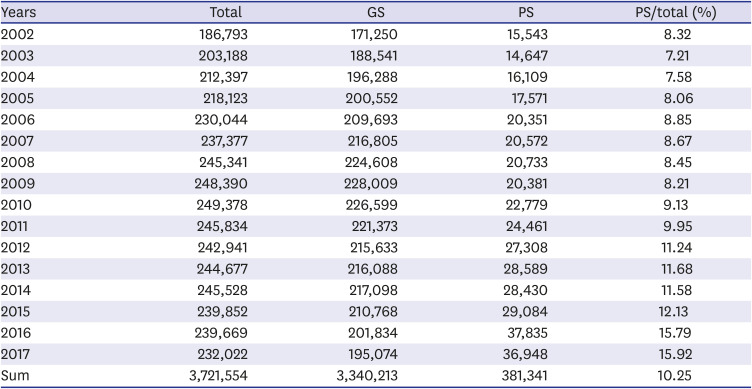
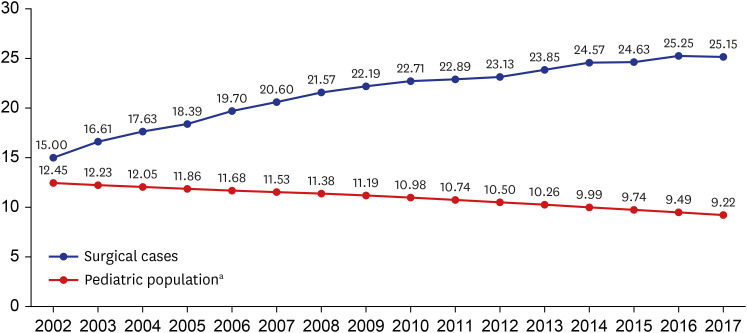
Table 3
Annual cases of pediatric surgery in Korea
![]()
When pediatric surgery was analyzed by age, the percentage of surgeries conducted by PS was higher in younger patients and it decreased with age (Table 4). It was highest with patients aged 0 and 1 years, at 26.49% and 27.68%, respectively, and it was lowest with patients aged 13 and 14 years, at 4.89% and 4.73%, respectively.
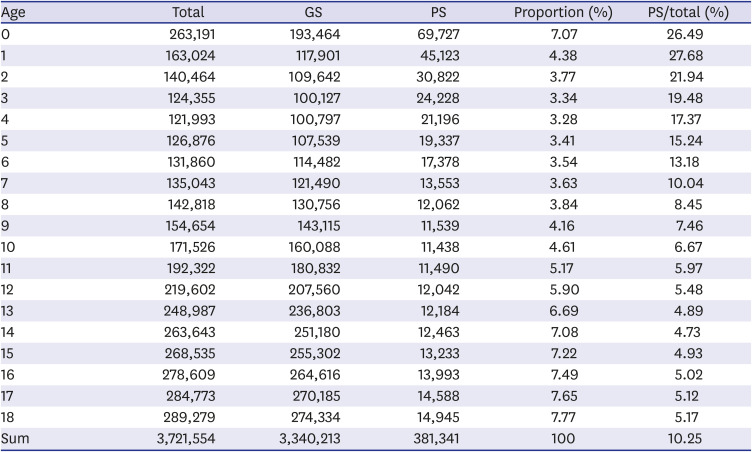
Table 4
Number of surgeries by age from 2002 to 2017
![]()
A total of 11,568 index operations were performed during the study period of 16 years, with an annual average of 723. The annual average of the percentage of index operations performed by PS was approximately 62.44%, and it was approximately 47.81% in 2002; however, it was approximately 88.79% in 2017 (Table 5).
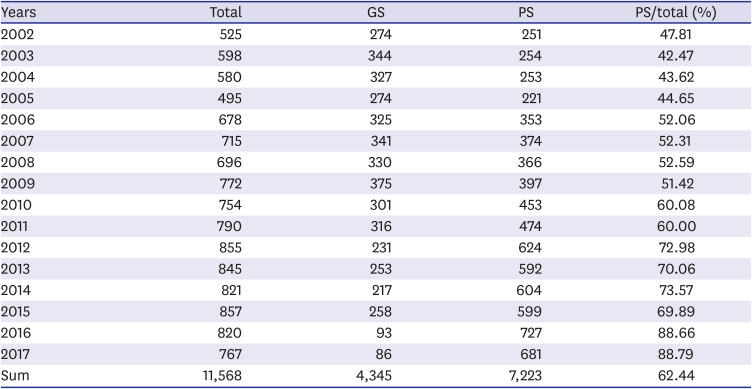
Table 5
Annual cases of index operations
![]()
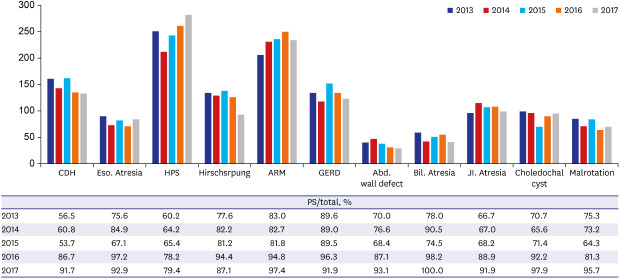
During the last 5 years of the study period, the number of surgeries conducted for main pediatric diseases decreased from 37,283 in 2013 to 29,464 in 2017, and the average annual number of surgeries for main pediatric diseases was approximately 33,228. The percentage of surgery performed by PS steadily increased, with 79.4% for hypertrophic pyloric stenosis and 100% for biliary atresia in 2017 (Fig. 2A). However, the proportions of surgery performed by PS for inguinal hernia and appendicitis remained low in the most recent years, with an annual average of approximately 41.6% and 11.9%, respectively (Fig. 2B).
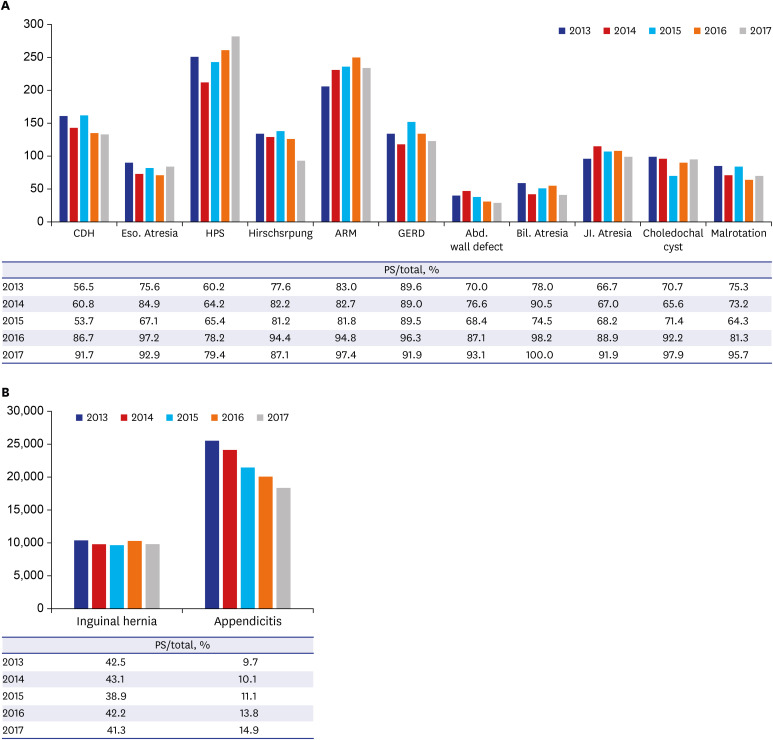
Fig. 2
Annual surgical cases of main pediatric disease from 2013 to 2017 (A), annual surgical cases of inguinal hernia and appendicitis (B).
CDH = congenital diaphragmatic hernia, Eso. Atresia = esophageal atresia, HPS =hypertrophic pyloric stenosis, Hirschsprung = Hirschsprung's disease, ARM = anorectal malformation, GERD = gastroesophageal reflux disease, Abd. wall defect = abdominal wall defect, Bil. Atresia = biliary atresia, JI. Atresia = Jejunoileal atresia, PS = pediatric surgeon.
![]()
Comparison of the outcomes for acute abdominal surgery in the NICU between PS and GS
A total of 6,342 surgeries were conducted in NICU patients with acute abdomen for 16 years, and the average was approximately 396.4 cases per year. The occurrence of these operations increased from 109 in 2002 to 524 in 2017. The percentage of surgery performed by PS was 44% in 2002, but it had recently risen to 89.7% in 2017 (Table 6). When comparing the mortality after acute abdominal surgery by PS and GS from 2002 to 2017, there was no statistically significant difference for all NICU patients, including babies with a birth weight of 2,500 g or more. However, for the 180-day mortality of patients with extremely low birth weight, there was a significant difference when it was performed by PS (31.7%) and GS (39.9%) (P = 0.029). Additionally, in patients with a birth weight of less than 1,500 g, those who underwent surgery by PS had a significantly lower mortality within all follow-up periods (Table 7). We further examined this when limited to the last 5 years. The 30-day mortality was significantly lower in all birth weight groups who were operated on by PS rather than GS. Regarding the 180-day and 365-day mortality, although patients operated on by PS appeared to have a lower mortality rate than those operated on by GS, the difference was not statistically significant (Fig. 3). We calculated the Kaplan-Meier survival curve using this data, and found that there was a significant difference in survival between NICU patients who underwent surgery for acute abdomen by PS and GS (log-rank test: P < 0.001) (Fig. 4).
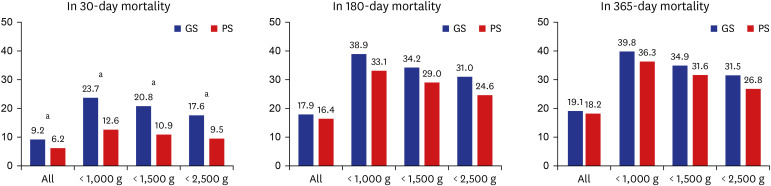
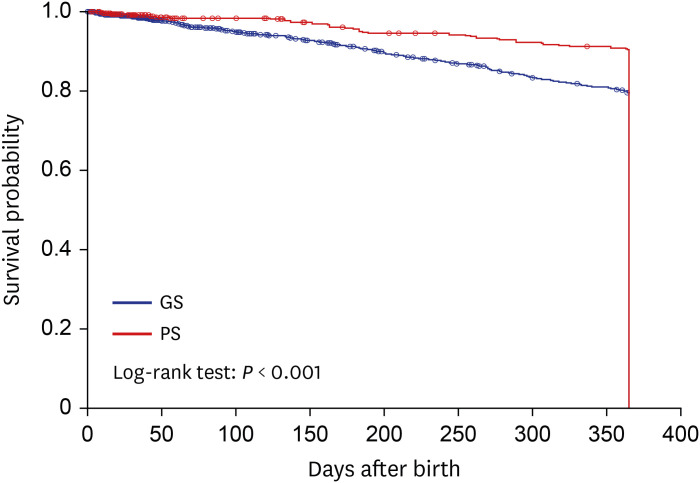
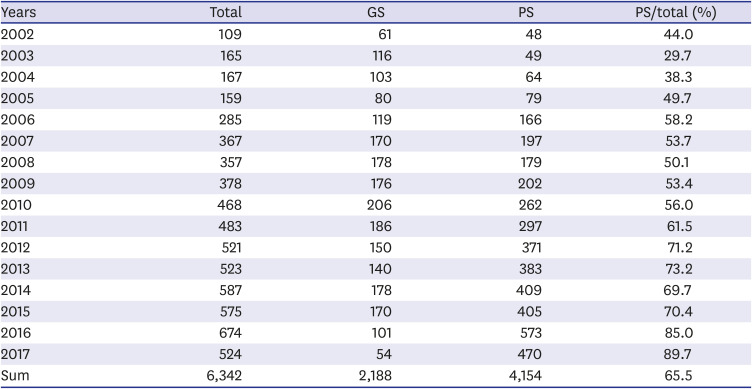
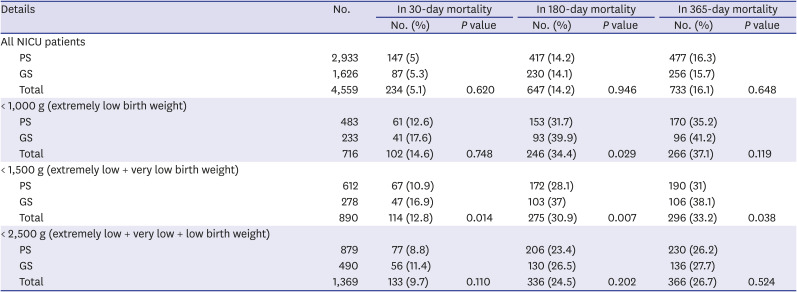
Fig. 3
Mortality comparison of acute abdominal surgery in the neonatal intensive care unit from 2013 to 2017.
GS = general surgeon, PS = pediatric surgeon.
aP < 0.05 between GS and PS.
![]()
Fig. 4
Kaplan-Meier survival curve after neonatal intensive care unit patients' acute abdominal surgery from 2013 to 2017.
GS = general surgeon, PS = pediatric surgeon.
![]()
Table 6
Annual cases of acute abdominal surgery in the neonatal intensive care unit
![]()
Table 7
Mortality comparison of acute abdominal surgery in neonatal intensive care units from 2002 to 2017
![]()
Estimated PS workload and workforce
The index operations, surgeries for main pediatric diseases, acute abdominal surgeries in the NICU, and all pediatric surgeries of the 288 pediatric surgical codes in the last 5 years of the study period are summarized in Table 8. Forty-nine PS who were qualified by the KAPS were working in 37 hospitals in Korea. To estimate the recent annual workload of 1 PS, the total number of each types of surgeries performed by PS in last 5 years of the study period was divided by the recent number of PS in Korea (49 PS); the number of the index operations was 13.1 per year, the number of surgeries for main pediatric diseases was 159.5 per year, and the number of neonatal acute abdominal surgeries was 9.1 per year, respectively. For all pediatric surgeries, it was estimated that 656.7 cases are performed annually by 1 PS.
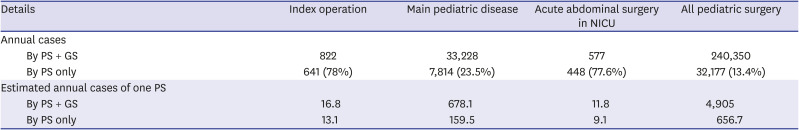
Table 8
Estimate of 1 Korean pediatric surgeon's 1-year workload based on the latest 5-year data
![]()
Assuming that all of the surgeries in each situation described in Table 8 that were performed by PS or GS should be performed only by PS with similar workload, the number of PS currently needed in Korea was estimated as follows: 1) index operations: 49 ÷ 0.78 = 62.82, 2) main pediatric diseases: 49 ÷ 0.235 = 208.51, 3) acute abdominal surgeries in the NICU: 49 ÷ 0.776 = 63.14, and 4) all pediatric surgeries: 49 ÷ 0.134 = 365.67. In other words, the minimum number of PS currently required to conduct at least index operation or neonatal acute abdominal operations in Korea is about 63.
In 2017, the number of PSs per million children under 15 years of age in Korea was 7.16 (Table 9). This was small compared to neighboring countries, such as China (7.9), Taiwan (19.8), and Japan (38.7). Of the 22 Organisation for Economic Co-Operation and Development member countries for which the number of PSs is known, only Colombia (4), Turkey (4.3), and Ireland (3.8) have fewer PS than Korea.11 Based on the gross domestic product per capita, this is very insufficient, even when compared to Spain (46.6) and Italy (51.8), which have similar gross domestic product per capita to Korea. Although having a high level of gross domestic product per capita alone does not mean that a country is medically advanced, it is true that many countries aim for a high gross domestic product per capita. In Table 9, among the countries with a higher gross domestic product per capita than Korea, Germany (24.1) and the United Kingdom (30.1) have median values of the number of PS per million children under 15 years of age. Based on this, it is believed that approximately 165 to 206 PS would be appropriate for Korea to implement more advanced pediatric surgery in the future.
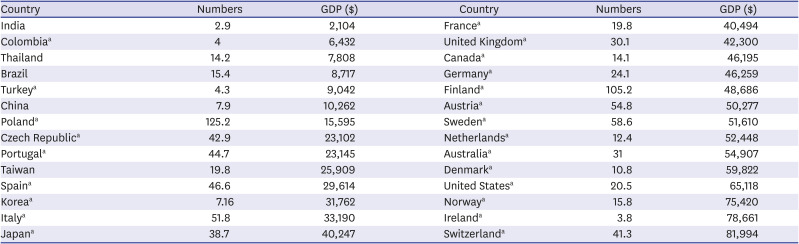
Table 9
Number of pediatric surgeons per million children (under 15 years) and gross domestic product per capita
GDP = gross domestic product per capita.
aOrganisation for Economic Co-operation and Development members except Belgium, Chile, Estonia, Greece, Hungary, Iceland, Israel, Latvia, Lithuania, Mexico, Luxembourg, New Zealand, Slovak Republic and Slovenia.
![]()
DISCUSSION
Raising all children as members of a healthy society is an important task for medical personnel. Therefore, the social role of experts who are responsible for the highly specialized field of surgical treatment for children has become important. Founded in 1985, the KAPS prides itself on being the world's best in terms of the skill of Korean PS. To date, it has employed strict requirements to manage the quality of PS (i.e., 1 year of fellowship training in hospitals accredited for domestic pediatric surgery training or 1 year of training in overseas hospitals accredited for pediatric surgery training, and cumulative pediatric surgeries of more than 500 cases, of which more than 50 are neonatal surgery). Although pediatric surgery is considered a division that requires a high level of skill, it is difficult to preserve the cost of surgery and patient management because of the low medical fee policy. Some hospitals do not want to have a pediatric surgery division because of the low profitability. As a result, there are not many hospitals in which PS can work, and surgical residents cannot easily choose pediatric surgery divisions. This vicious cycle is repeated, and the number of PS in Korea is currently lacking. Because of the insufficient number of PS, GS become involved in pediatric surgery, which includes surgery for congenital anomalies and surgery for NICU patients that require advanced experience.
The patient's outcomes depend on various factors, and surgeons are very interested in improving the quality of treatment by analyzing these factors. Surgical subspecialty training for surgeons is often cited as a predictor of improving surgical outcomes.13 In many studies, surgical subspecialty and sufficient experience in relevant cases have been reported to influence patient outcomes.141516 The surgery for main pediatric diseases and acute abdominal surgery in the NICU that were included in this study are not commonly encountered, even by young PS, and are very rare for most GS. Boo et al.9 reported that the adjusted odds ratios of postoperative complications for GS were 2.9 times higher than for PS when performing surgery on NICU patients, including for acute abdominal surgery, esophageal atresia, and Hirschsprung's disease (95% confidence interval, 1.03–7.79). In the above study, it was reported that an infant's younger gestational age, lower birth weight, and more associated anomalies were not risk factors for postoperative complications; however, undergoing surgery by GS was a risk factor. In this study, which assessed acute abdominal surgery in the NICU, although the comorbidity of the patients could not be compared, the survival of patients who underwent surgery by PS was significantly better than for those whose surgery was performed by GS. A study of the surgical treatment of intussusception in children found that, although there were more severe situations, such as perforation, bowel ischemia, and sepsis (17.6% of PS vs. 9.3% of GS), the bowel resection was lower when the surgery was performed by PS (33% vs. 59.3%), and the odds of bowel resection were significantly lower for PS than GS (odds ratio, 0.20; P < 0.001).7 Langer et al.3 reported that GS had a higher overall complication rate (4.18% vs. 2.58%) than PS when conducting pyloromyotomy for hypertrophic pyloric stenosis, and the incidence of duodenal perforation was reported to be 3.65 times more common in GS. In addition, studies of inguinal herniorrhaphy,8 appendectomy,6 biliary atresia,5 and congenital diaphragmatic hernia4 have also shown that PS have better outcomes than GS. Based on these studies, it is considered that surgery for main pediatric diseases should be performed by PS.
The new requirements for surgical resident training in pediatric surgery do not address training in the care of children, which is already part of the core residency education for all GS. In other words, pediatric surgery is already recognized as an independent division by surgeons, and this is widely known to the public. During the study period, the surgical ratio of PS for children up to the age of 7 years was more than 10%, and up to the age of 2 years, it was more than 20%. This is believed to be the point at which the importance of the pediatric surgical subspecialty emerges for the younger age group. From 2002 to 2017, the absolute number of pediatric surgeries increased by 124%, and considering the decrease in the pediatric population during the study period, the number of surgeries per 1,000 children increased by 168%. In all pediatric surgeries, percentage conducted by of PS increased from 8.32% in 2002 to 15.92% in 2017. Excluding hypertrophic pyloric stenosis (79.4%) and Hirschsprung's disease (87.1%), more than 90% of the index operations were performed by PS in 2017. In addition, the percentage of neonatal acute abdominal surgery performed by PS steadily increased, reaching 89.7% in 2017. For appendicitis, which is one of the most common pediatric surgeries, the proportion of the surgery performed by PS was still small, but it had increased by approximately 154% during the last 5 years. However, the role of PS in treating inguinal hernia did not change significantly in the last 5 years. As mentioned earlier, for inguinal hernia and appendicitis, surgery by PS had better outcomes than surgery by GS. Therefore, KAPS, PS and the government should come up with a way to increase the surgical ratio of PS for benign surgical cases, such as inguinal hernia or appendicitis
O'Neill et al.17 noted that hiring a new PS would require 400 surgeries per year. A study conducted in the United States reported that 1 PS performed 421 surgeries in 1997.13 In a Canadian study in 2010, the number of surgeries per PS per year was estimated to be 328.18 In this study, we estimated that the number of surgeries per year per PS in Korea in the last 5 years of the study period was 656.7. However, the pediatric surgeries for 37 hospitals selected based on the index operation were calculated as being performed by pure PS, but in reality it will not be. This is because surgeries that are traditionally considered the domain of PS now often overlap with other surgical departments. This is particularly noticeable in neck and urogenital surgery. Studies conducted in the United States from 2005 to 2014 reported that otolaryngologists conducted approximately 60% of thyroglossal duct cyst excisions and brachial cleft excisions and approximately 50% of cervical lymph node excisions. It has also been found that approximately 30% of unilateral inguinal herniorrhaphy and approximately 85% of orchiopexy surgeries are implemented by urologists.19 In addition to the above diseases, surgery for skin and soft tissue tumors (12.5%), central venous catheterization (20.8%), frenulotomy (4.4%), and hydrocele (3.3%), which accounted for a large proportion of pediatric surgeries in this study, overlapped with other departments. Therefore, the number of surgeries per year per PS in Korea will be less than 656.7.
We referred to several studies to evaluate the appropriate number of PS in the workforce in Korea. The American Pediatric Surgical Association estimated that the number of PS needed per 100,000 children aged 0 to 15 years in developed countries, such as the United States and some European countries, is 1.20 In some developing countries, where children comprise almost half of the population, the number of PS required per 200,000 children aged 0 to 15 years is estimated to be 1.21 In Korea, the number of children aged 0 to 15 years in 2017 was 6,844,221. If the aforementioned studies are taken into account when evaluating the number of PS needed in Korea, there should be 35–69 PS, but since Korea is closer to a developed country than a developing country, it leads to the conclusion that there should be at least 69.
We found that about 63 PS are required if they perform at least the index operation among the pediatric surgeries investigated in this study. When this study was conducted in 2019, 49 PS were working in 37 hospitals across the country, and only 1 PS was employed in 30 of these hospitals. In hospitals where there was only 1 PS, he/she was required to wait for an emergency; thus, the occupational burden of the PS is inevitably worse, and he/she may not be able to respond appropriately in an emergency. Ideally, 2 or more PS should be working in each hospital, and the number of PS should be more than the current minimum estimate.
A recently published study found that there must be at least 4 PS per million children under the age of 15 years to achieve a survival rate of more than 80% for surgically correctable pediatric diseases (e.g., gastroschisis, esophageal atresia, intestinal atresia, typhoid intestinal perforation, and neonatal bowel obstruction).11 The number of PS per million children under 15 years of age in Korea is 7.16, which is higher than 4, but lower than in many countries in Asia and significantly lower than in Japan (38.7). To achieve more advanced pediatric surgery in the future, it is evident that more PS are needed, and the number of PS in advanced countries should be aimed for. However, over the past 17 years, the number of PS in Korea has increased by just 0.235 per year (Table 10). The number of PS has sharply declined since the first generation of PS began to retire from 2004. In addition, a large number of second-generation PS who are currently active will retire in the 2020s. If the birth rate and pediatric patient revenue continue to drop, and hospitals stop hiring PS, a severe problem could occur within a decade.
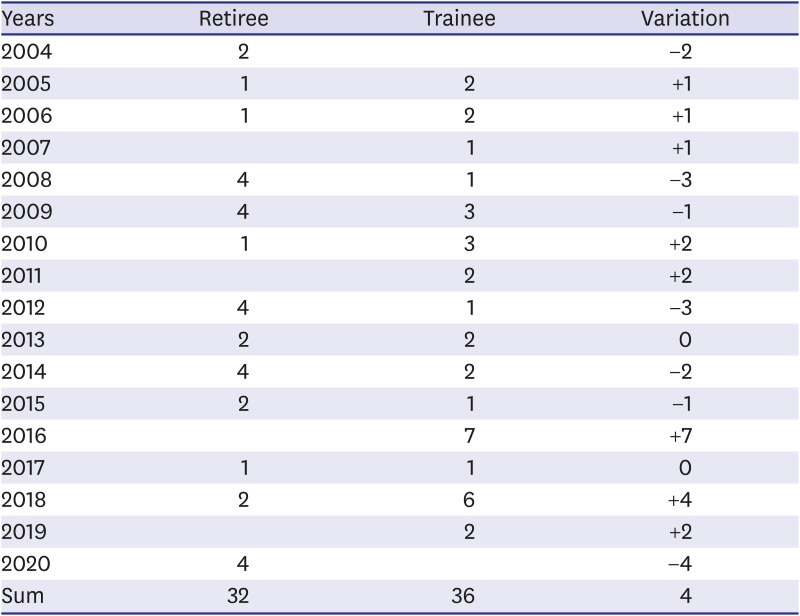
Table 10
Pediatric surgeon retirees and trainees in the last 17 years
![]()
The total fertility rate (TFR) of the Korea according to the Statistics Korea was 4.53 in 1970.12 The TFR decreased to 2.82 in 1980, decreased to less than 2 from 1984 (TFR = 1.74), and decreased to less than 1.5 from 1998 (TFR = 1.464). In the 2010s, the TFR maintained around 1.2, but decreased to 1.052 in 2017, then 0.977 in 2018 and 0.918 in 2019. Due to the persistent decrease in TFR, the absolute number of neonatal and pediatric patients decreased. As a result, the medical income of doctors who treat children has decreased, which leads to a poor working environment, so that the recruitment of doctors who treat children has not been properly made, and this includes PS. Although TFR decreased, high-risk pregnancy such as premature labor and premature rupture of the amniotic membrane increased as the childbearing age increased, and congenital anomalies and neonatal diseases increased accordingly. This is proved by the annual number of surgeries for main pediatric disease and acute abdominal surgery of the NICU patients in the last five years in this study. Therefore, this author does not believe that the number of PS should decrease due to the decrease in TFR in Korea. In order to create a medical system that meets the healthy lives of children and adolescents required in the era of low birthrate, 1) prenatal counseling and management for mothers (or families) suspected of fetal anomaly, 2) government support for pediatric surgery and rehabilitation treatment expenses, etc., 3) establish a treatment system for pediatric trauma patients is needed. PS also need continuous qualification management, so attending academic conferences or workshops should be supervised by the KAPS so that they can learn new knowledge and surgical methods. Also, for young PS with little experience, the KAPS should support surgical practice, such as using animal models. As mentioned earlier when discussing the results of the estimated workload and workforce of the PS, it is believed that 165 to 206 PS will be needed in Korea when aiming for more advanced pediatric surgery. To achieve this, a better educational environment for pediatric surgery and improvement of the working conditions are required, and these cannot be postponed any longer.
The reliability of the NHIS data at the beginning of this study in 2002 and at the end in 2017 is considered to differ. This was particularly noticeable regarding the NICU patients. When analyzing the amount of NICU surgeries, the average number in the 5 years from 2002 was 117, but it was approximately 577 in the last 5 years. This change was not due to a surge in actual NICU patients. It was probably due to the fact that the number of patients increased from 2013, and that the NICU admission fee code was actively registered. This probably occurred because the NICU admission fee code has been actively registered since 2013, when the medical fee for NICU patients increased. Additionally, there may have been missing data in the old data, which could have occurred more frequently before the medical charts for each hospital were computerized. In order to minimize these errors and analyze recent trends in pediatric surgery, we further analyzed the surgery in the last 5 years.
In conclusion, pediatric surgery is not the same as surgery for adults. Pediatric surgery in Korea is increasing in proportion of PS, but it is still widely performed by GS. PS have better operative outcomes for acute abdominal surgery in the NICU than GS. It is desirable for PS to perform pediatric surgery, but the number of PS in Korea is insufficient. We believe that at least the index operations or NICU operation should be performed by PS, and that a minimum of 63 PS are needed to do so. Additionally, approximately 200 PS will be required in Korea to manage of main pediatric diseases and to achieve more advanced pediatric surgery in the future. The government should create a better educational environment and improve working conditions to foster an appropriate number of PS.
 XML Download