Abstract
An MR-based attenuation correction (MRAC) map plays an important role in quantitative positron emission tomography (PET) image evaluation in PET/magnetic resonance imaging (MRI) systems. However, the MRAC map is affected by the magnetic field inhomogeneity of MRIs. This study aims to evaluate the characteristics of MRAC maps of physical phantoms on PET/MRI images. Phantom measurements were performed using the Siemens Biograph mMR. The modular type physical phantoms that provide assembly versatility for phantom construction were scanned in a four-channel Body Matrix coil. The MRAC map was generated using the two-point Dixon-based segmentation method for whole-body imaging. The modular phantoms were scanned in compact and non-compact assembly configurations. In addition, the phantoms were scanned repeatedly to generate MRAC maps. The acquired MRAC maps show differently assigned values for void areas. An incorrect assignment of a void area was shown on a locally compact space between phantoms. The assigned MRAC values were distorted using a wide field-of-view (FOV). The MRAC values also differed after repeated scans. However, the erroneous MRAC values appeared outside of phantom, except for a large FOV. The MRAC map of the phantom was affected by phantom configuration and the number of scans. A quantitative study using a phantom in a PET/MRI system should be performed after evaluation of the MRAC map characteristics.
Attenuation correction in positron emission tomography (PET) images is essential for qualitative evaluation and quantitative measurements. Attenuation on PETs is dependent on the electron density of the material at an energy of 511 keV, and the correction procedure can be achieved by transmission scans at that energy level [1]. The computed tomography (CT) image is widely used for attenuation correction in the PET/CT systems, which can be performed through the bilinear transformation of the CT number (Hounsfield unit) to 511 keV [2].
In contrast to CT, magnetic resonance imaging (MRI) has no direct relation to electron density. Therefore, attenuation correction for quantitative measurements of PET images is a challenging issue for PET/MRI systems compared with PET/CT systems [3,4]. Various MR-based attenuation correction (MRAC) strategies were introduced and implemented in commercial PET/MRI systems during the past several years [5
-7]. The most popular MRAC technique is the segmentation-based approach that uses the two-point Dixon method [8,9], which is based on a chemical shift of protons in water and fat molecules. The in-phase and opposed-phase images are acquired using a two-echo acquisition technique. The separated water and fat images are reconstructed and segmented by addition and subtraction of in- and opposed-phase images. The two-point Dixon method assumes a uniform magnetic field of an MRI system because it is a phase-sensitive technique [10]. However, magnetic field inhomogeneity generated by the magnetic system or being object is commonly observed in clinical MRI systems. This field inhomogeneity can easily cause an obstacle phase discrimination for water and fat molecules. Therefore, an MRAC map using the two-point Dixon method varies under the magnetic field inhomogeneity of an MRI [11,12].
An imaging phantom allows the objective assessment of imaging system characteristics [13]. The MRAC map derived from the PET/MRI system can be assessed by the imaging phantom. We developed a modular imaging phantom and each module can be combined to make any shape to fit well with various MRI coil configurations. This study aims to evaluate the characteristics of MRAC maps on PET/MRI systems by using a module type imaging phantom.
Phantom image acquisition was performed using a whole-body PET/MR hybrid system (Biograph mMR; Siemens AG Healthcare, Erlangen, Germany). The PET detector block consists of an 8×8 lutetium oxyorthosilicate crystal array attached to a 3×3 avalanche photodiode array for read-out. The PET detector unit consists of eight rings, which consist of 56 detector blocks. The MR system consists of a shielded 3.0 T magnet, gradient coil, and radiofrequency body coil. A half-Fourier acquisition single-shot turbo spin-echo sequence for T2-weighted images was used to acquire coronal images of the phantom (TR=557 ms, TE=8.8 ms, echo train length=5, matrix size=384×202, field-of-view (FOV)=253×450 mm2, slice thickness=3 mm).
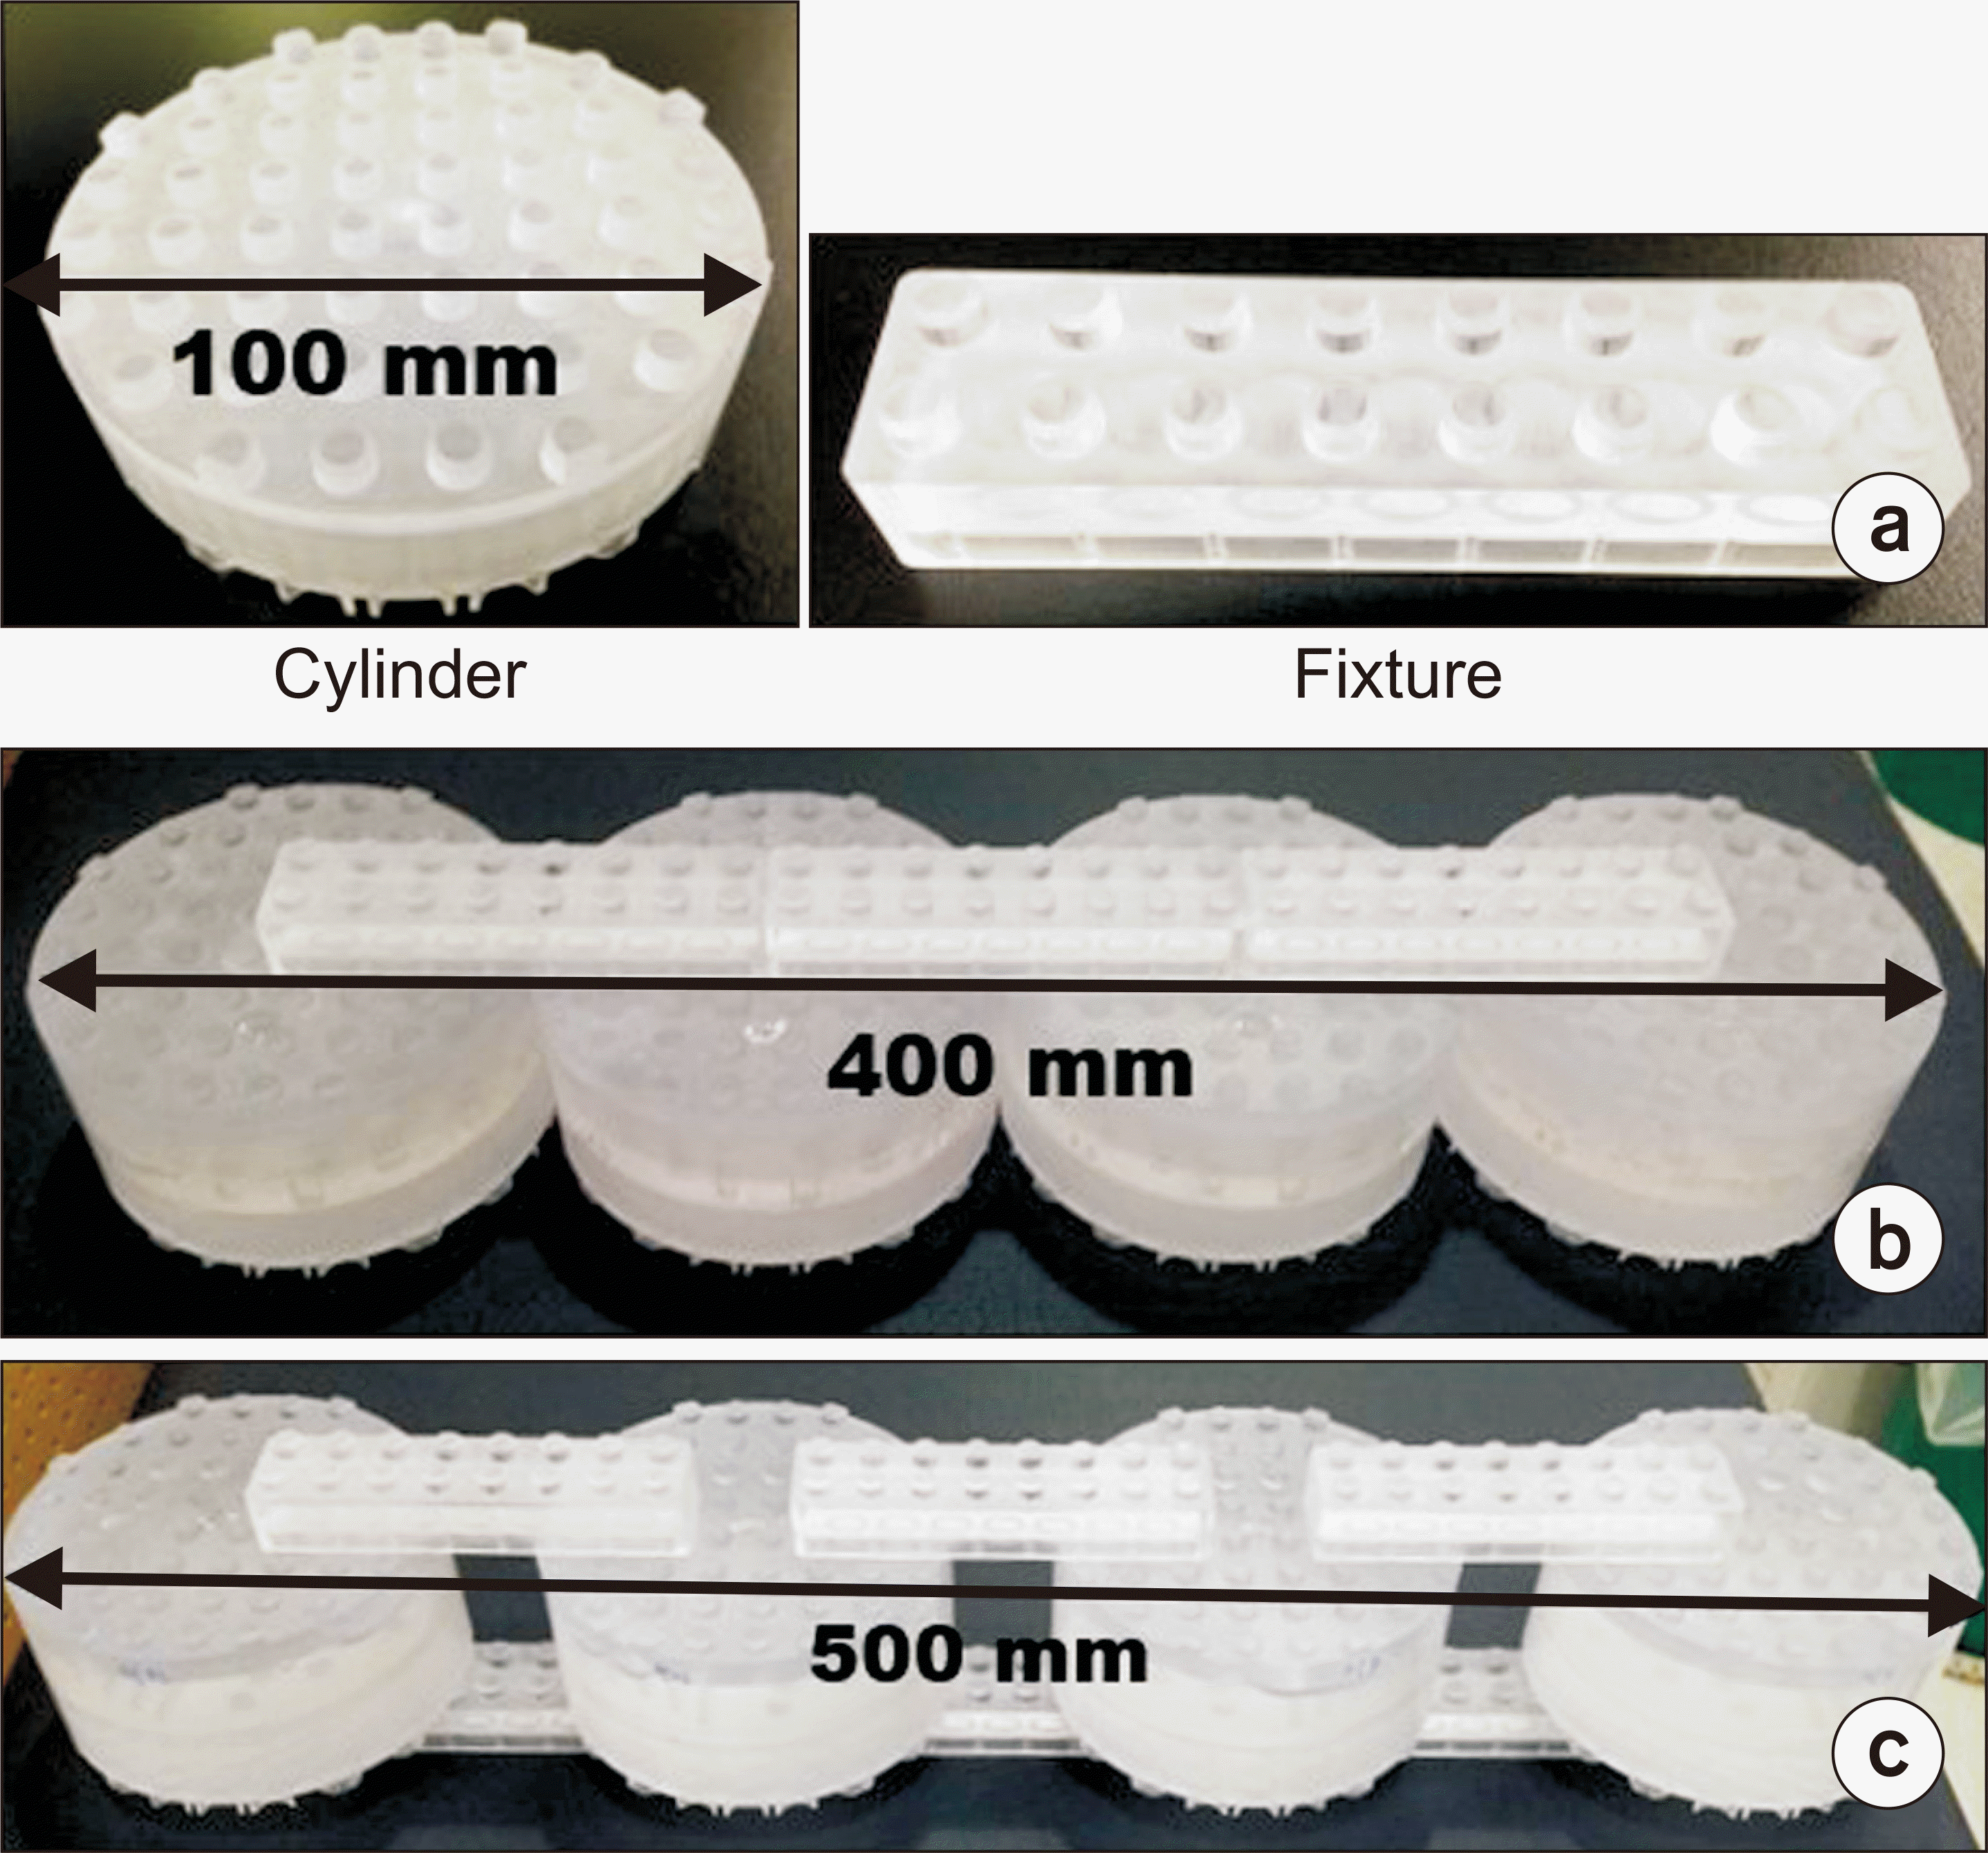
The modular phantom consists of a disk type module and fixture that supports the phantom during scanning, as shown in Fig. 1a. The outer and inner diameters of the disk module are 100 mm and 80 mm, and the height is 50 mm. The modular phantom has a LEGO type coupling system and a small hole for solution injection. Each module was filled with distilled water. The upper and lower fixtures assembled four disk module phantoms, as shown in Fig. 1b, c. Each module phantom was a compact and non-compact assembly with and without interspacing. The length of a compactly assembled phantom was 400 mm. The length of a non-compactly assembled phantom was 500 mm. Compact and non-compact phantom MRI image acquisition was performed in the one bed position on the left-right direction, covering the assembled phantom as shown in Fig. 2a. Compactly assembled phantoms were scanned in vertical and horizontal directions by using the Body Matrix coil. Phantom data acquisition was performed in the two bed position in the superior-inferior direction (2 minutes per bed position), as shown in Fig. 3.
The MRAC map was generated using the two-point Dixon-based segmentation method for whole-body imaging. The MRAC algorithm segmented tissue into four classes (air, lungs, fat, and soft tissue) based on a two-point Dixon sequence [14,15]. Soft tissue is generally considered to be water; therefore, a segmented mu-map for this phantom study was assigned air and soft tissue. The phantom was scanned three times using the Dixon sequence, and consequently three MRAC maps were generated. Assigned values of the MRAC maps were compared.
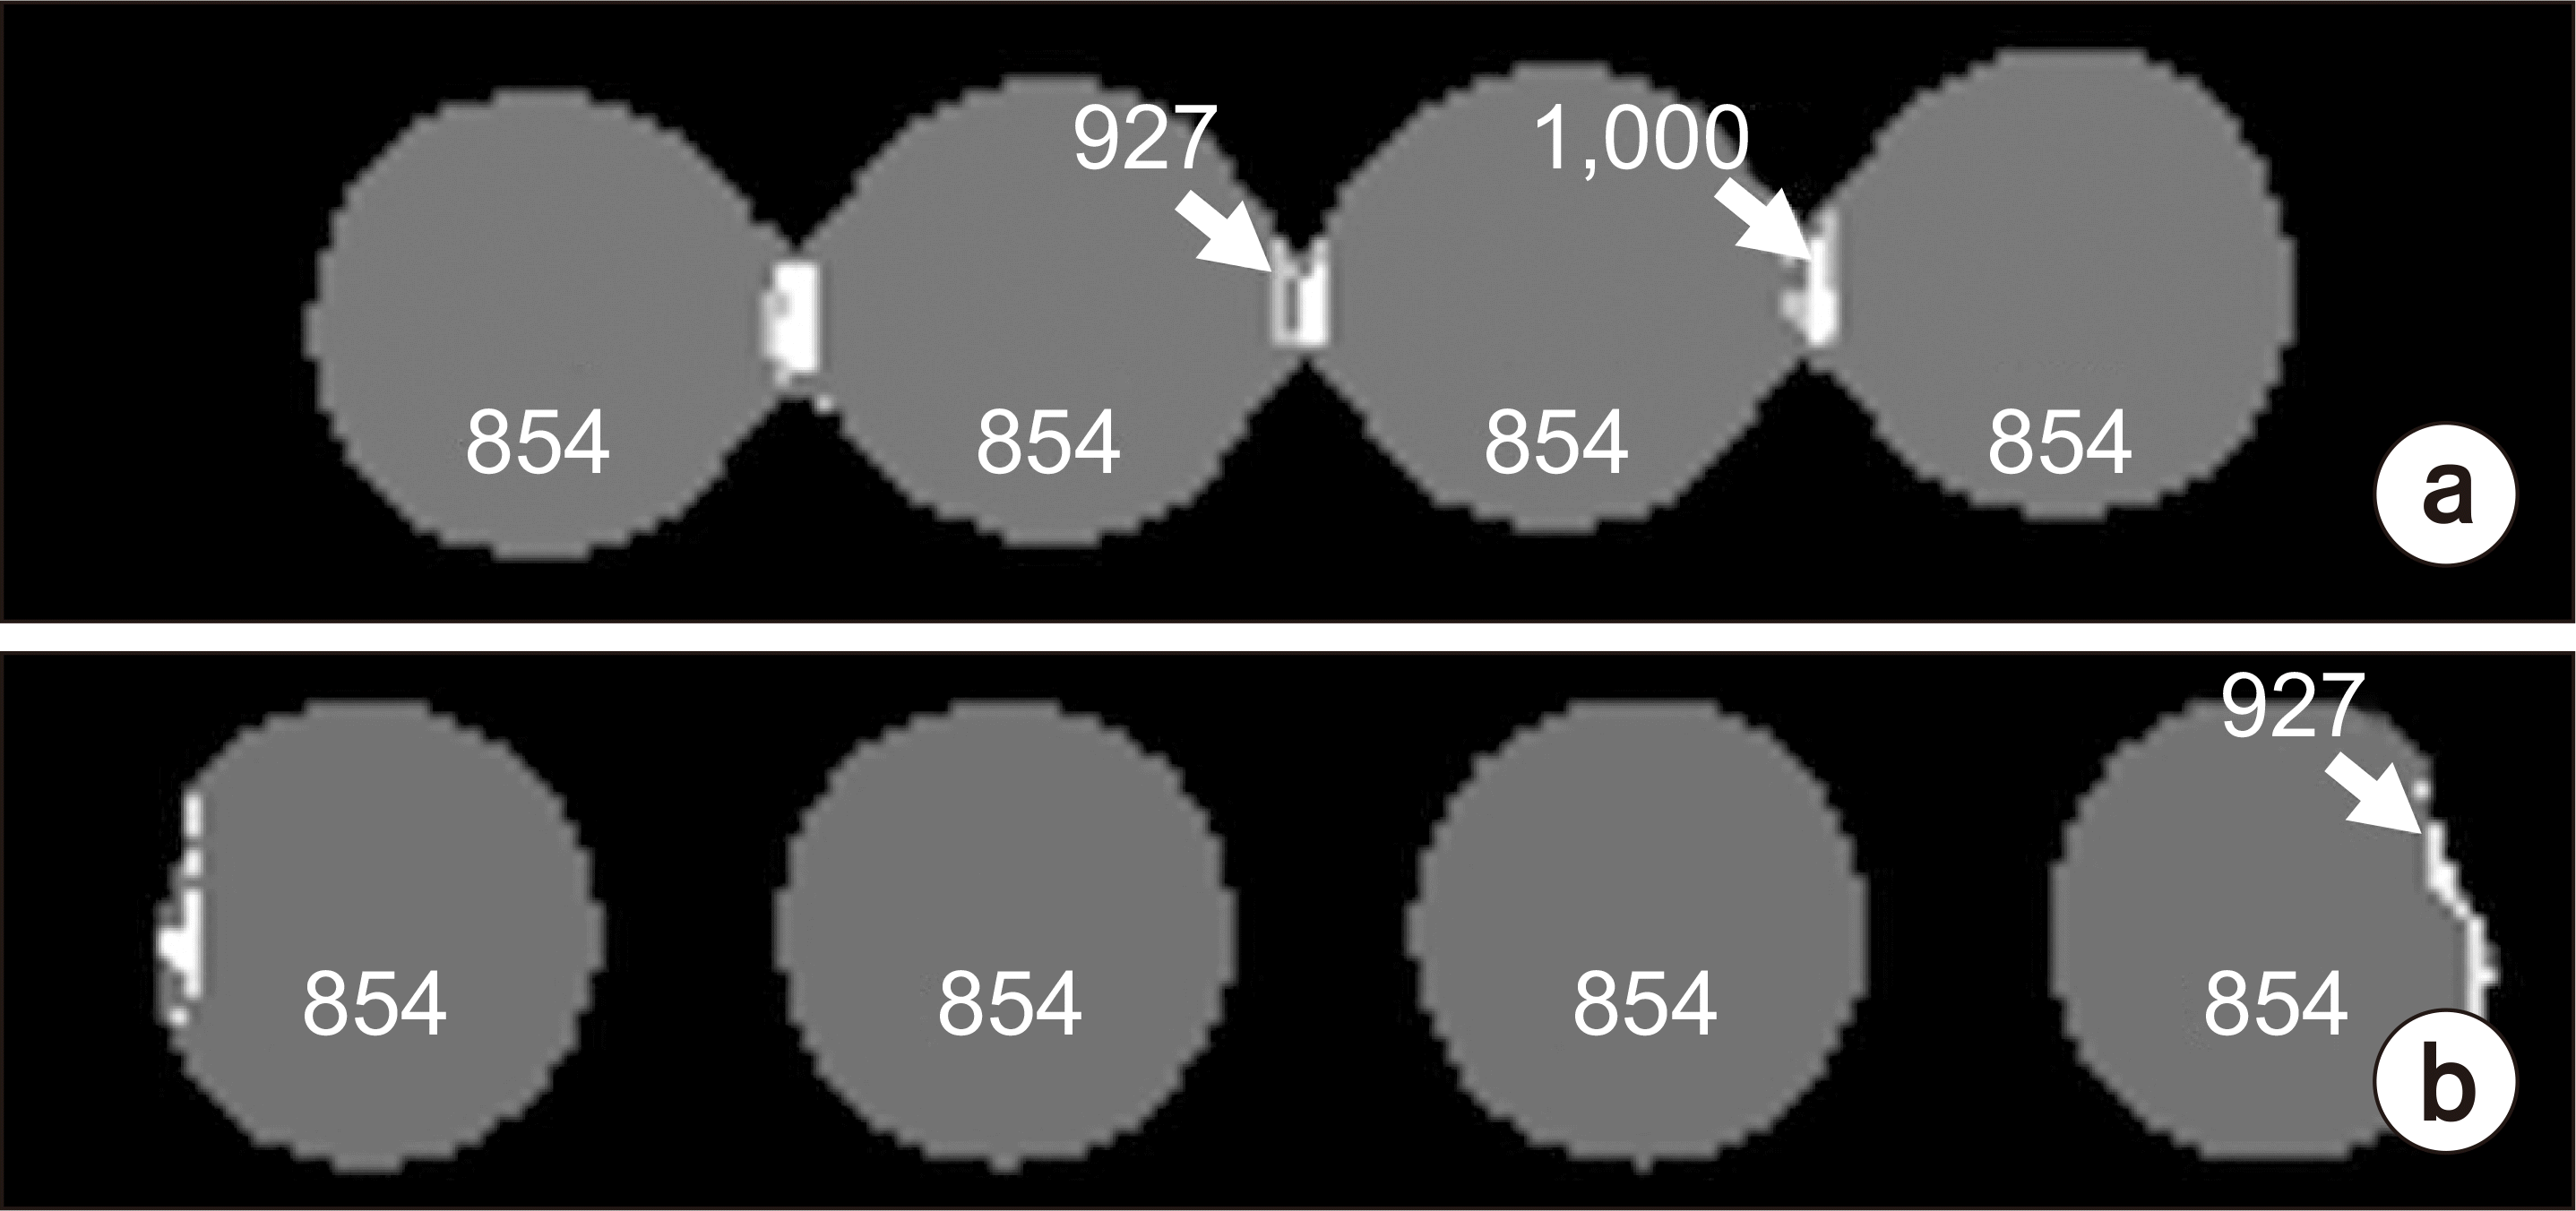
The inner areas of water-filled phantoms were all assigned a value of 854 using one matrix coil. A wrong assignment of a void area was shown on a locally compact space between phantoms, as shown in Fig. 2a. The void areas of phantoms outside were calculated as soft tissue, with a value of 1,000. An erroneously assigned value of locally compact space was reduced by increasing interspacing distance between phantoms. However, as the scan FOV was increased, the peripheral region was geometrically distorted. As a result, the most outer region was misassigned in the MRAC map.
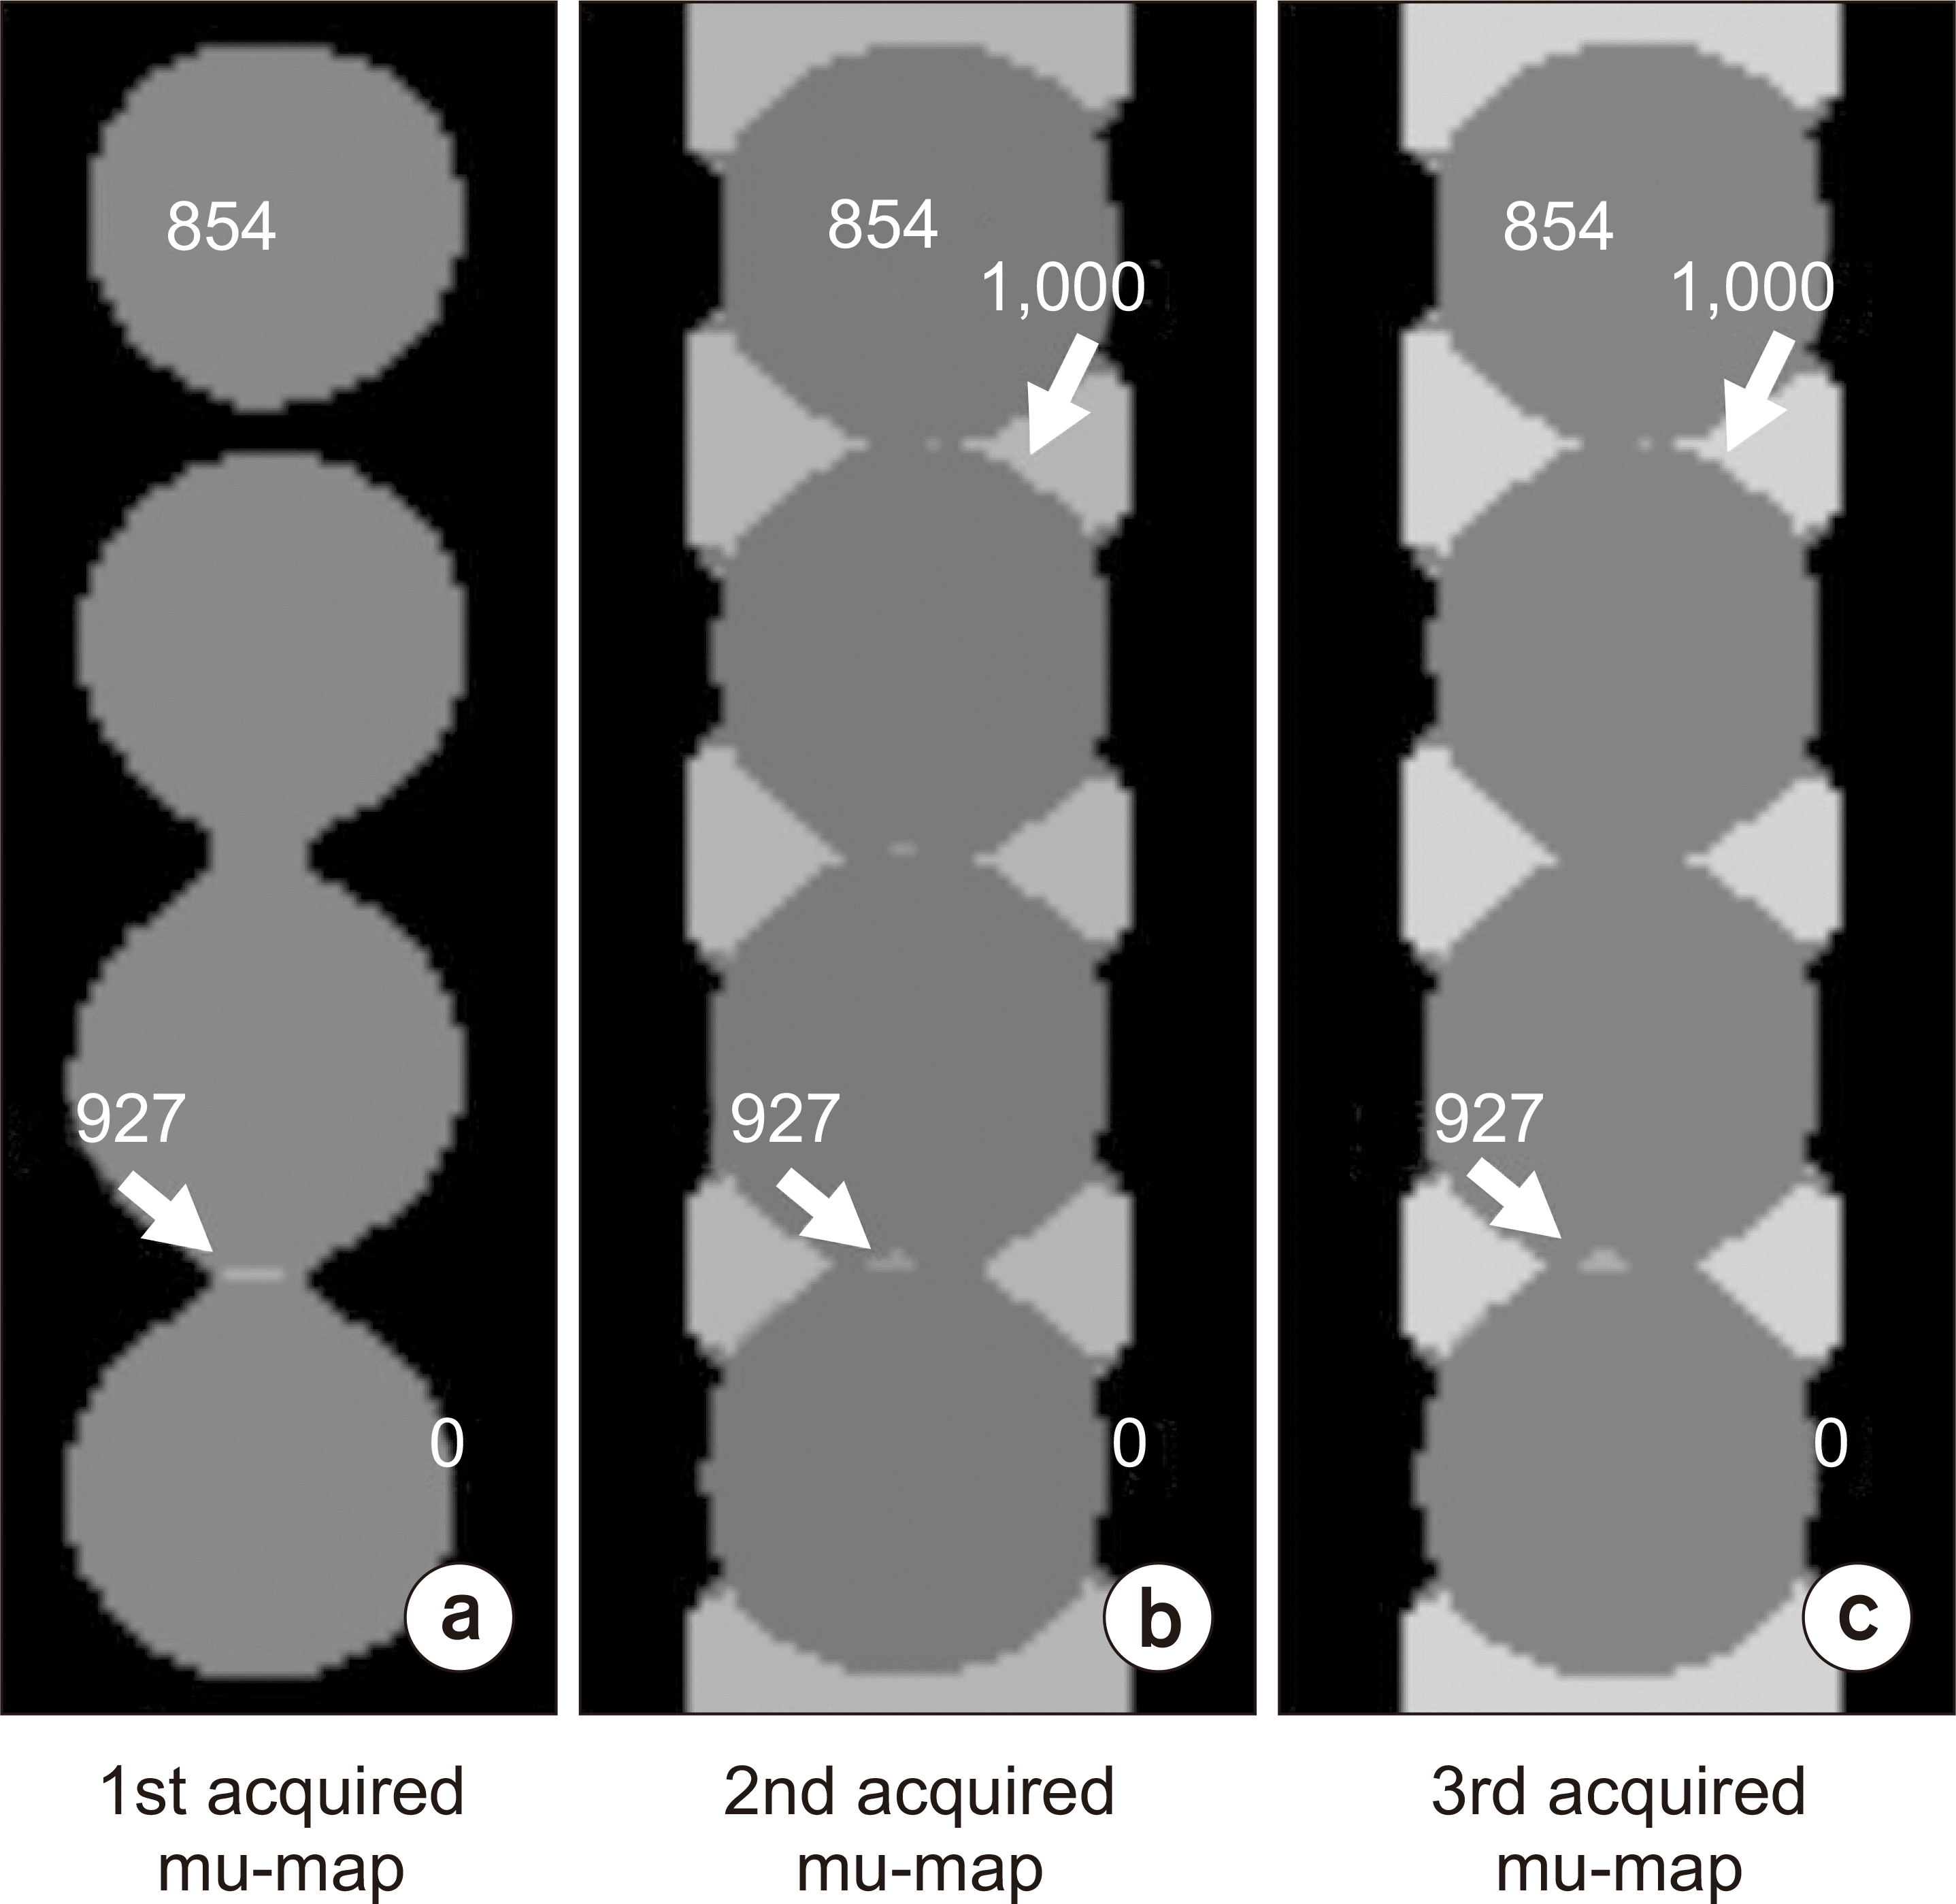
The water in the disk phantom was calculated as a value of 854 in the repetitively acquired three MRAC maps by using two matrix coils in the superior-inferior direction, as shown in Fig. 3. The three MRAC maps presented different values for the void areas, which were near the phantom margin. These areas were calculated as soft tissue, a value of 1,000, in the 2nd and 3rd acquired MRAC maps. Interspace between disk phantoms was assigned a value of 1,000, but the shape was displayed differently.
We evaluated the characteristics of the MRAC map on the PET/MRI image by using an imaging phantom with module type. This study clearly demonstrates a lack of consistency in the MRAC map derived by the Dixon sequence. The MRAC map was severely affected by the phantom configurations and the number of scans.
The variation of MRAC maps can be generated by the field inhomogeneity of MRI systems. Erroneous values were affected by being near the phantom margin for compact assembly compared with non-compact assembly. The magnetic field perturbations were severe on the boundary of the object. The distorted value was generated on the contact surface between the phantoms. For non-compact assembly, erroneous values were exhibited only on the peripheral region for a large FOV. Imaging gradient nonlinearity of an MRI system is a major factor in magnetic field nonuniformity. Such nonlinearity is easily generated on the peripheral region with a large FOV of the MRI. No distortion existed between the phantoms, but the wrong value was assigned outside of the phantom. The MRAC map was also influenced by repetitive scanning. Continuous scanning can lead to local magnetic field non-uniformities. Because of this non-uniformity, incorrect values were assigned to the MRAC map.
A two-point Dixon MRAC map is based on the chemical shift of protons in water and fat molecules, which requires two types of tissues. Only phantoms containing water were used in this experiment and may have generated the distortion. However, switched water and fat were reported as common artifacts in the patient study [16]. The two-point Dixon method is severely affected by magnetic field inhomogeneity. Therefore, a MRAC map that uses the two-point Dixon method should be acquired through repeated scanning. The appropriate MRAC map should be selected through the evaluation of the generated MRAC maps because the physical properties of the phantom are well known. In addition, erroneous MRAC maps can be evaluated using co-registration with spin-echo T1 images with less distortion. In hybrid PET/MRI imaging systems, each imaging modality characteristic affects fused image quality and quantitative evaluation. For this, the characteristics of each modality should be properly evaluated.
References
1. Bushberg JT, Boone JM. 2011. The essential physics of medical imaging. Lippincott Williams & Wilkins;Philadelphia:
2. Kinahan PE, Townsend DW, Beyer T, Sashin D. 1998; Attenuation correction for a combined 3D PET/CT scanner. Med Phys. 25:2046–2053. DOI: 10.1118/1.598392. PMID: 9800714.
3. Hofmann M, Steinke F, Scheel V, Charpiat G, Farquhar J, Aschoff P, et al. 2008; MRI-based attenuation correction for PET/MRI: a novel approach combining pattern recognition and atlas registration. J Nucl Med. 49:1875–1883. DOI: 10.2967/jnumed.107.049353. PMID: 18927326.
4. Judenhofer MS, Wehrl HF, Newport DF, Catana C, Siegel SB, Becker M, et al. 2008; Simultaneous PET-MRI: a new approach for functional and morphological imaging. Nat Med. 14:459–465. DOI: 10.1038/nm1700. PMID: 18376410.
5. Hofmann M, Pichler B, Schölkopf B, Beyer T. 2009; Towards quantitative PET/MRI: a review of MR-based attenuation correction techniques. Eur J Nucl Med Mol Imaging. 36 Suppl 1:S93–S104. DOI: 10.1007/s00259-008-1007-7. PMID: 19104810.
6. Berker Y, Franke J, Salomon A, Palmowski M, Donker HC, Temur Y, et al. 2012; MRI-based attenuation correction for hybrid PET/MRI systems: a 4-class tissue segmentation technique using a combined ultrashort-echo-time/Dixon MRI sequence. J Nucl Med. 53:796–804. DOI: 10.2967/jnumed.111.092577. PMID: 22505568.
7. Wagenknecht G, Kaiser HJ, Mottaghy FM, Herzog H. 2013; MRI for attenuation correction in PET: methods and challenges. MAGMA. 26:99–113. DOI: 10.1007/s10334-012-0353-4. PMID: 23179594. PMCID: PMC3572388.
8. Eiber M, Martinez-Möller A, Souvatzoglou M, Holzapfel K, Pickhard A, Löffelbein D, et al. 2011; Value of a Dixon-based MR/PET attenuation correction sequence for the localization and evaluation of PET-positive lesions. Eur J Nucl Med Mol Imaging. 38:1691–1701. DOI: 10.1007/s00259-011-1842-9. PMID: 21688050.
9. Samarin A, Burger C, Wollenweber SD, Crook DW, Burger IA, Schmid DT, et al. 2012; PET/MR imaging of bone lesions--implications for PET quantification from imperfect attenuation correction. Eur J Nucl Med Mol Imaging. 39:1154–1160. DOI: 10.1007/s00259-012-2113-0. PMID: 22526955.
10. Coombs BD, Szumowski J, Coshow W. 1997; Two-point Dixon technique for water-fat signal decomposition with B0 inhomogeneity correction. Magn Reson Med. 38:884–889. DOI: 10.1002/mrm.1910380606. PMID: 9402188.
11. Keller SH, Holm S, Hansen AE, Sattler B, Andersen F, Klausen TL, et al. 2013; Image artifacts from MR-based attenuation correction in clinical, whole-body PET/MRI. MAGMA. 26:173–181. DOI: 10.1007/s10334-012-0345-4. PMID: 22996323.
12. Hofmann M, Bezrukov I, Mantlik F, Aschoff P, Steinke F, Beyer T, et al. 2011; MRI-based attenuation correction for whole-body PET/MRI: quantitative evaluation of segmentation- and atlas-based methods. J Nucl Med. 52:1392–1399. DOI: 10.2967/jnumed.110.078949. PMID: 21828115.
13. Keller SH, Jakoby B, Svalling S, Kjaer A, Højgaard L, Klausen TL. 2016; Cross-calibration of the Siemens mMR: easily acquired accurate PET phantom measurements, long-term stability and reproducibility. EJNMMI Phys. 3:11. DOI: 10.1186/s40658-016-0146-3. PMID: 27387738. PMCID: PMC4936986.
14. Bezrukov I, Mantlik F, Schmidt H, Schölkopf B, Pichler BJ. 2013; MR-Based PET attenuation correction for PET/MR imaging. Semin Nucl Med. 43:45–59. DOI: 10.1053/j.semnuclmed.2012.08.002. PMID: 23178088.
15. Mehranian A, Arabi H, Zaidi H. 2016; Vision 20/20: magnetic resonance imaging-guided attenuation correction in PET/MRI: challenges, solutions, and opportunities. Med Phys. 43:1130–1155. DOI: 10.1118/1.4941014. PMID: 26936700.
16. Delso G, ter Voert E, de Galiza Barbosa F, Veit-Haibach P. 2015; Pitfalls and limitations in simultaneous PET/MRI. Semin Nucl Med. 45:552–559. DOI: 10.1053/j.semnuclmed.2015.04.002. PMID: 26522396.