Abstract
Purpose
We aim to evaluate the accuracy and effectiveness of an automatically converted radiation therapy plan between Radixact machines by comparing the original plan with the transferred plan.
Methods
The study involved a total of 20 patients for each randomly selected treatment site who received radiation treatment with Radixact. We set up the cheese phantom (Gammex RMI, Middleton, WI, USA) with an Exradin A1SL ion chamber (Standard Imaging, Madison, WI, USA) and GAFCHROMIC EBT3 film (International Specialty Products, Wayne, NJ, USA) inserted. We used three methods to evaluate an automatically converted radiation therapy plan using the features of the Plan transfer. First, we evaluated and compared Planning target volume (PTV) coverage (homogeneity index, HI; conformity index, CI) and organs at risk (OAR) dose statistics. Second, we compared the absolute dose using an ion chamber. Lastly, we analyzed gamma passing rates using film.
Results
Our results showed that the difference in PTV coverage was 1.72% in HI and 0.17% in CI, and majority of the difference in OAR was within 1% across all sites. The difference (%) in absolute dose values was averaging 0.74%. In addition, the gamma passing rate was 99.64% for 3%/3 mm and 97.08% for 2%/2 mm.
The continuity of treatment in radiation therapy is very important. However, unintended treatment interruptions may occur, and each hospital should establish and prepare protocols for these situations. In this situation, the only way to continue treatment is to repair the machine if there is only one treatment machine in the hospital, but if there are more than two treatment machines with the same function in the hospital, continuous treatment can be considered if the treatment plan can be converted to a machine that works properly. Tomotherapy (Accuray, Sunnyvale, CA, USA) was developed at the University of Wisconsin [1,2], and in 2018, the first Radixact system (Accuray) in Korea was released for clinical use. Radixact operates using a data management system called the Integrated Data Management System (IDMS). In addition, one of the sub-features of IDMS is a Plan transfer function. This feature allows clinicians to transfer a plan from a previously planned machine to another machine registered in IDMS in unavoidable or emergency situations. Samsung Medical Center (Seoul, Korea) evaluated this Plan transfer function between TOMO HDA (Accuray) and Radixact by comparing the dose required by the normal organ and the target organ [3]. Furthermore, there were also attempts to continue treatment by using third-party treatment planning systems (TPS). RayStation’s fallback (FB) planning was shifted from a helical tomotherapy (HT) plan to a Linac plan, where FB changes in each reference plan were converted to plans that can be delivered on a different machine [4,5]. What both the FB and the Plan transfer function have in common is the ability to convert treatment plans. However, the plan transfer can be converted only to tomotherapy connected by IDMS, but FB can be converted regardless of whether the linear accelerators are L-shape or O-shape. In this study, we will cover the Plan transfer function that can be used without a TPS. St. Vincent’s Hospital (Suwon, Korea) installed two Radixact machines in July 2018, which we will refer to as machines A and B. We have been able to continue the treatment of patients using an automatically converted radiation therapy plan in the event of machine breakdown or other unexpected contingencies. When transferring a treatment plan from one machine to another, we verified IMRT quality assurance (QA) using an electronic portal imaging device and a Dose Volume Histogram (DVH). However, these QAs were not sufficient to assess the accuracy of the transferred plan. For a more definite verification, we made a QA plan using a phantom that utilized an ion chamber and film to measure the dose and confirm the two-dimensional dose distribution [6.7]. The purpose of this study is to evaluate the dosimetric consistency of the plan transfer features by installing the same measuring equipment on the original plan machine and the transferred plan machine.
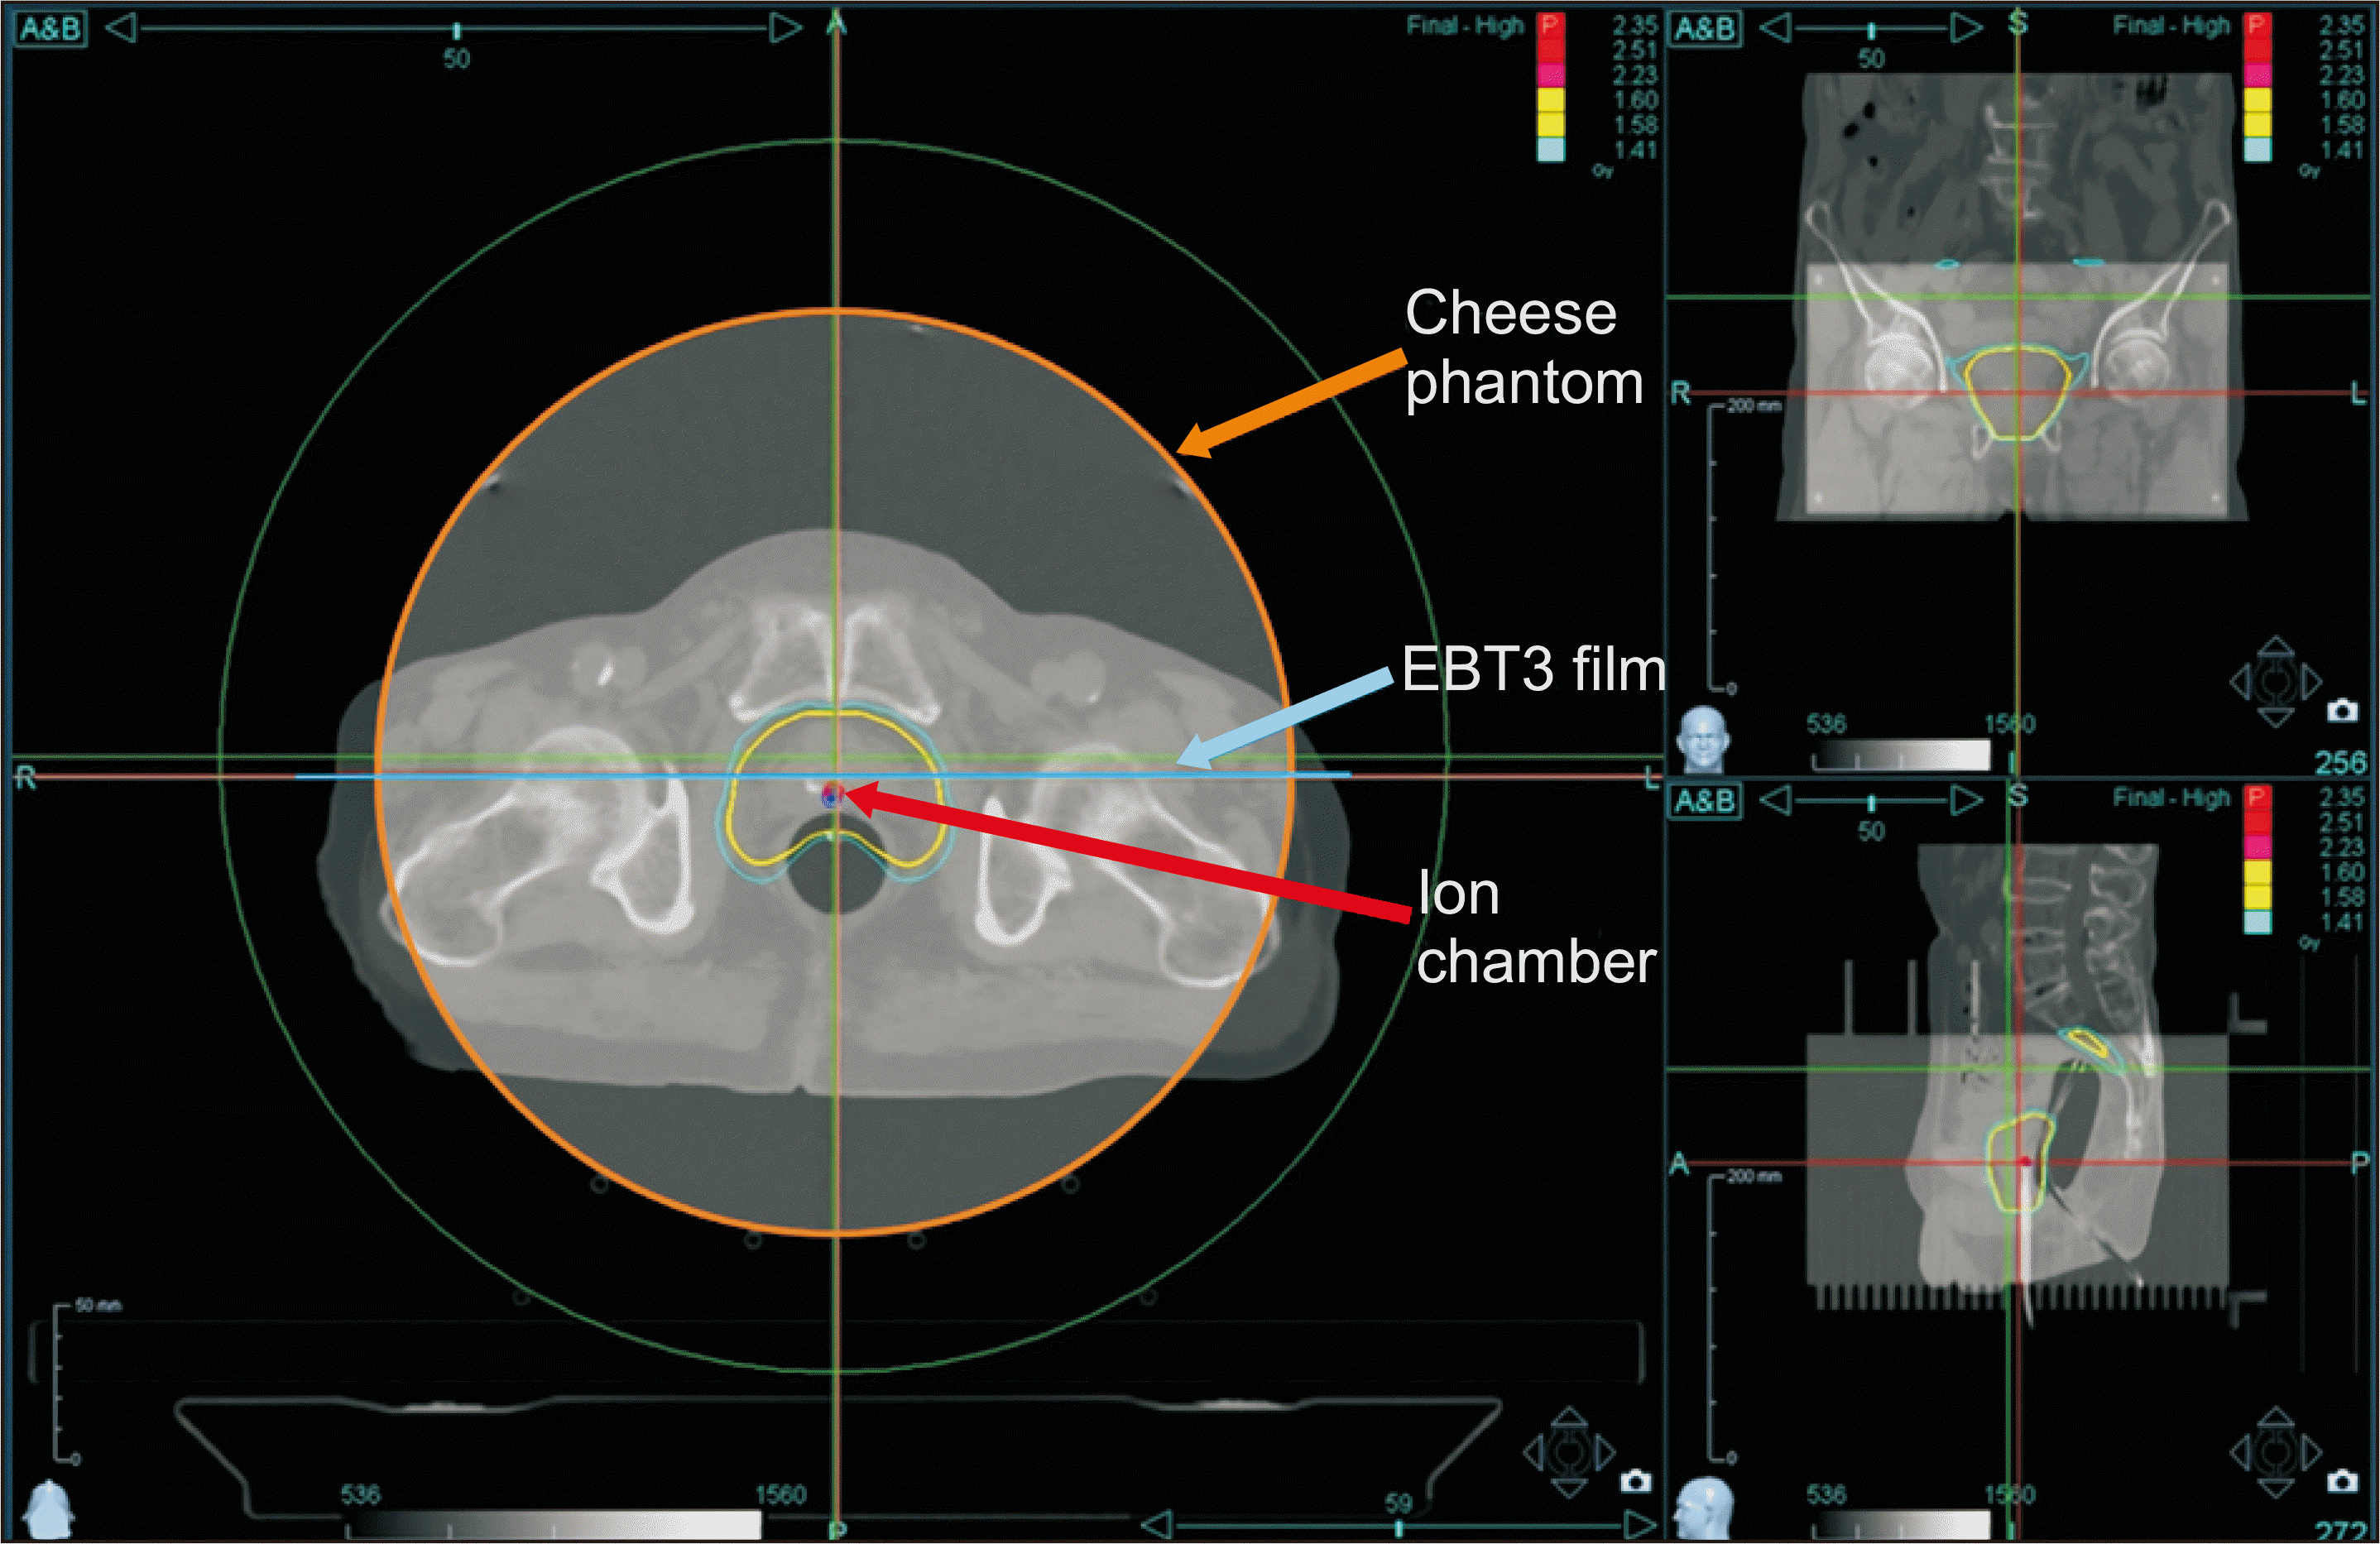
In this study, 20 patients treated with Radixact at St. Vincent’s Hospital were selected randomly and received Institutional Review Board (IRB) of the Catholic Medical Center, the Catholic University of Korea approval (protocol no. VC19RASI0237). The study examined four patient cases for each of the following treatment sites: brain, head and neck (H&N), chest, abdomen, and pelvis. As much as possible, we tried to select patients with various diseases at each treatment site. Treatment plan conversion was accomplished using Accuray Precision (Accuray, Sunnyvale, CA, USA) version 1.1.1.1. The plan transfer feature was used to convert each patient’s plan from the original machine to another machine. To check the characteristics of the machine sequence, 10 cases were converted from machine A to B, and the remaining 10 cases were converted from machine B to A. Then, we made a QA plan wherein a phantom with an ion chamber and film inserted was used, as shown in Fig. 1. By doing so, we were able to obtain absolute dose and coronal plane dose distributions.
We measured the daily output of the machine reflecting the temperature and pressure of each treatment room to eliminate condition deviations on the measurements. We set up the cheese phantom (Gammex RMI, Middleton, WI, USA) with a certified Exradin A1SL ion chamber (Standard Imaging, Madison, WI, USA) and GAFCHROMIC EBT3 film (International Specialty Products, Wayne, NJ, USA) inserted. In addition, we measured QA on the original plan machine and on the transferred plan machine simultaneously. To verify the effectiveness of the Plan transfer function, the following methods were used: (1) comparison of PTV coverage and OAR dose statistics, (2) comparison of absolute dose using the ion chamber, and (3) gamma passing rates analysis using the film [8-11].
The DVH was verified in both the original transferred plans. Target coverage was compared with the conformity index (CI) and the homogeneity index (HI). CI was defined by the following equation [12],
where TV is the target volume and PIV is the target volume covered by the prescription isodose volume. HI was the uniformity of dose distribution in the target volume and was defined as below [13],
where D2% and D98% are doses of 2% and 98% of the target volume, respectively. For OAR comparison, the maximum dose and mean dose of normal organs near the target were compared.
To compare absolute doses, we installed the same certified ion chambers in both the original and the transferred treatment plan machines. We measured the absolute dosimetry with static output and found that the average difference between the static output and the rotational output is 0.2%. The measured values reflected the daily output at the time of measurement.
Fig. 2 shows measured film images of the original plan and the transferred plan. The IMRT QA difference between the original plans and the transferred plans was analyzed by applying gamma indexes of 3%/3 mm and 2%/2 mm relative tolerance with automatic registration using RIT 113 (Radiological Imaging Technology, Colorado Springs, CO, USA), as shown in Fig. 3 [14]. Comparison of dosimetric data between the original plans and the transferred plans was performed using the Wilcoxon matched pair signed-rank test to clarify the differences in results. A value of P≤0.05 was considered a significant value [15].
The PTV coverage showed similar results at almost all treatment sites between the original plans and the transferred plans, as shown in Table 1, 2. The CI showed a maximum difference of 1.00% in the pelvis and a difference within 0.32% in other sites. The overall average of the CI difference (%) was 0.18%, and the P-value between the two groups was 0.23, indicating an insignificant CI difference (%). The HI showed a difference of up to 8.72% and 7.77% in the H&N site and the chest site, respectively, but it was within 2.82% in the remaining three cases. In addition, the P-value between the groups was 0.35; hence, there was no significant difference in conversion between the two groups. In the other three treatment sites, namely the brain, abdomen, and pelvis, the difference was within 3.0%. Although the HI was slightly larger than the CI, the average of all treatment sites was 1.7%.
The difference in OARs between the original plans and the transferred plans was mostly within 1% across all treatment sites, as shown in Table 3. The difference in the lens of the brain site was 4.34%, the largest among all treatment sites. However, other OARs showed a difference of less than 1%. In the H&N and chest sites, the difference was more than 1% in the submandibular gland and in the esophagus, but for all other OARs, the difference was within 1%. Both the abdomen and pelvis sites showed a small difference of less than 1%.
The difference (%) in absolute dose between the treatment plans converted from machine A to machine B was 0.85% (Table 4). In the opposite case, the average value was 0.62% (Table 5). The average difference (%) was 0.74%. The P-value was 0.46, indicating that the difference in conversion of the absolute dose value between the two machines was not significant.
As shown in Table 6, the gamma passing rates using film measurement averaged at 99.64% at 3%/3 mm, with a passing rate of 99% or more for almost all sites. In addition, 2%/2 mm also showed a high average gamma passing rate of 97.08%.
In this study, we compared original plans and transferred plans between two machines to verify the effectiveness of Accuray Precision’s Plan transfer function. Our results showed that the transferred plan was clinically valid in terms of DVH, absolute dose, and gamma passing rates analysis. In a previous study of the Samsung Medical Center that attempted to confirm the effectiveness of the Plan transfer function, they compared the dosimetric difference on DVH of the treatment plan of H&N and prostate cases using a phantom between TOMO HDA and Radixact. According to the results, when the treatment plan was transferred, there was no significant difference in the target. However, when the treatment plan was transferred from TOMO HDA to Radixact, the dose increased in many normal organs [3]. Furthermore, several previous studies have investigated third-party TPS. Yuan et al. [4] confirmed the treatment plan of HT by its conversion to L-Linac using RayStation’s FB planning function. They concluded that overall dosimetric differences between FB plans and HT original plans were considered negligible and not clinically significant, and FB plans were within ±10% for OAR avoidance. Furthermore, patient specific QA received >95% passing rate using the 3%/3 mm gamma analysis criteria [3]. In addition, Zhang et al. [5] investigated a RayStation’s FB planning function by generating three-dimensional (3D) and IMRT FB backup plans. They selected the HT as the initial treatment machine and L-Linac as a backup machine. They concluded that all the FB-IMRT plans were admissible for use. Although there were some statistical differences, these differences were unlikely to be clinically significant. However, they found that the FB-3D plans could fail to implement the original HT plan and might require more time and effort to create acceptable plans [4].
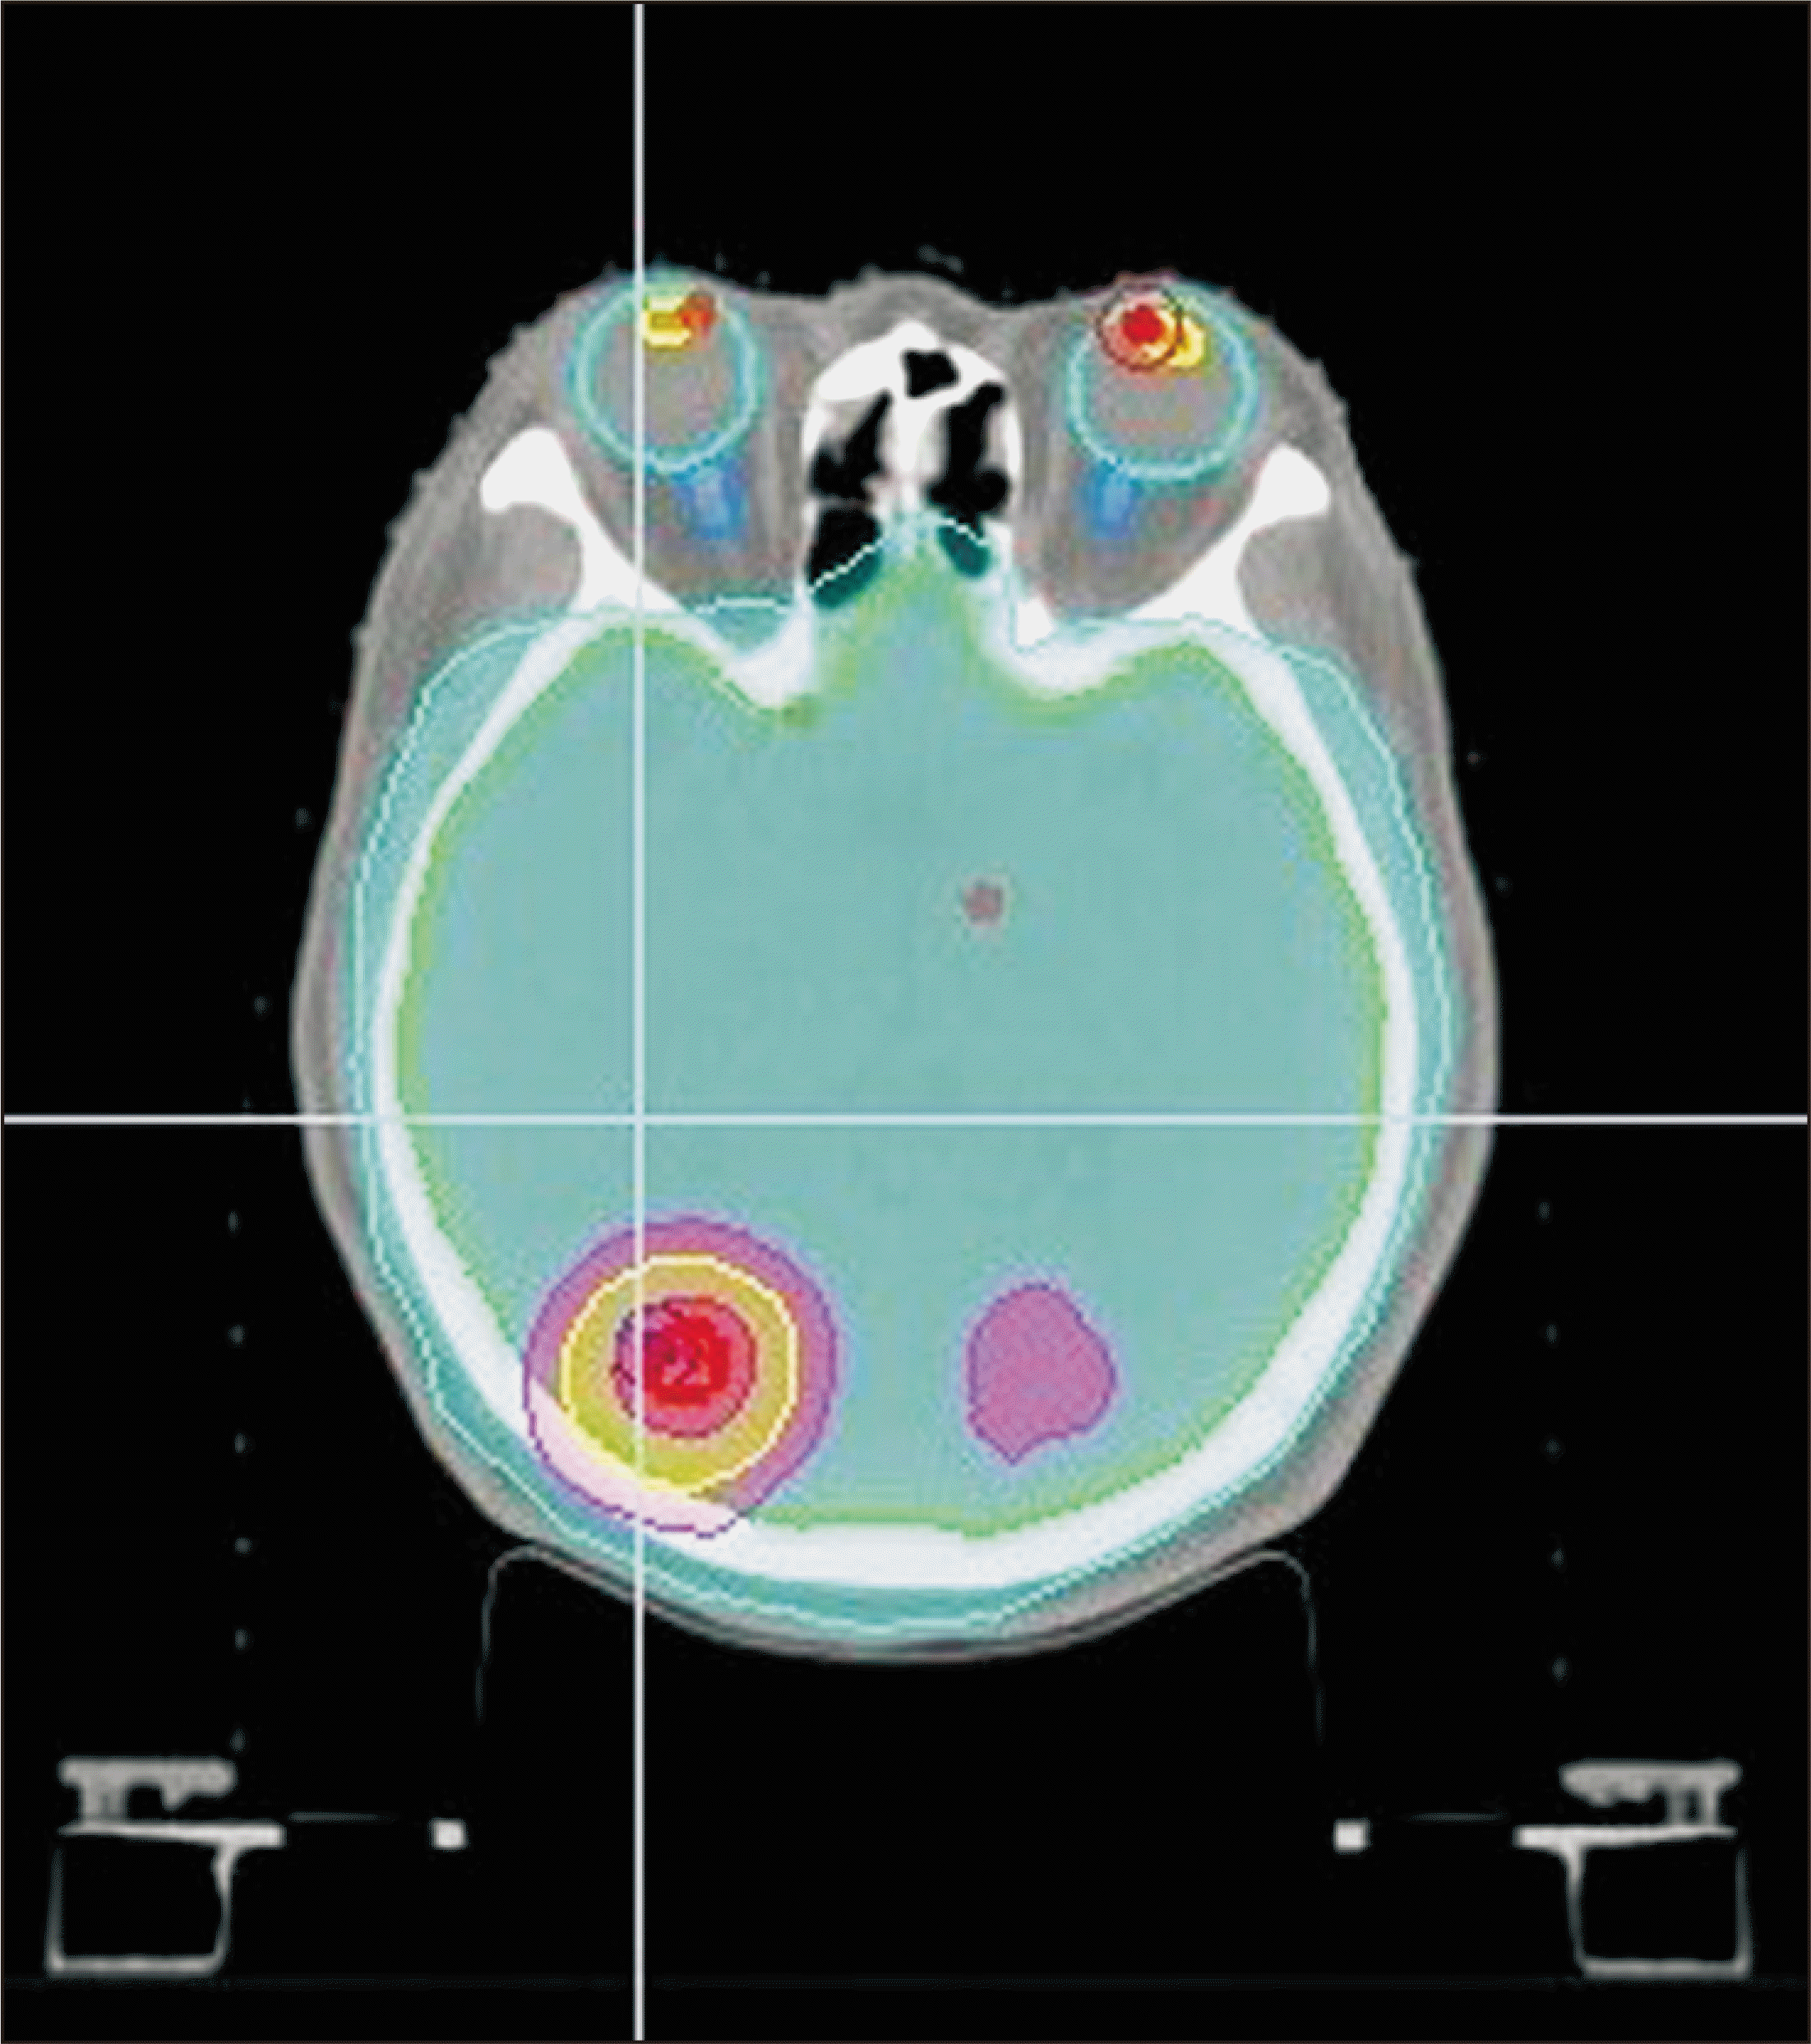
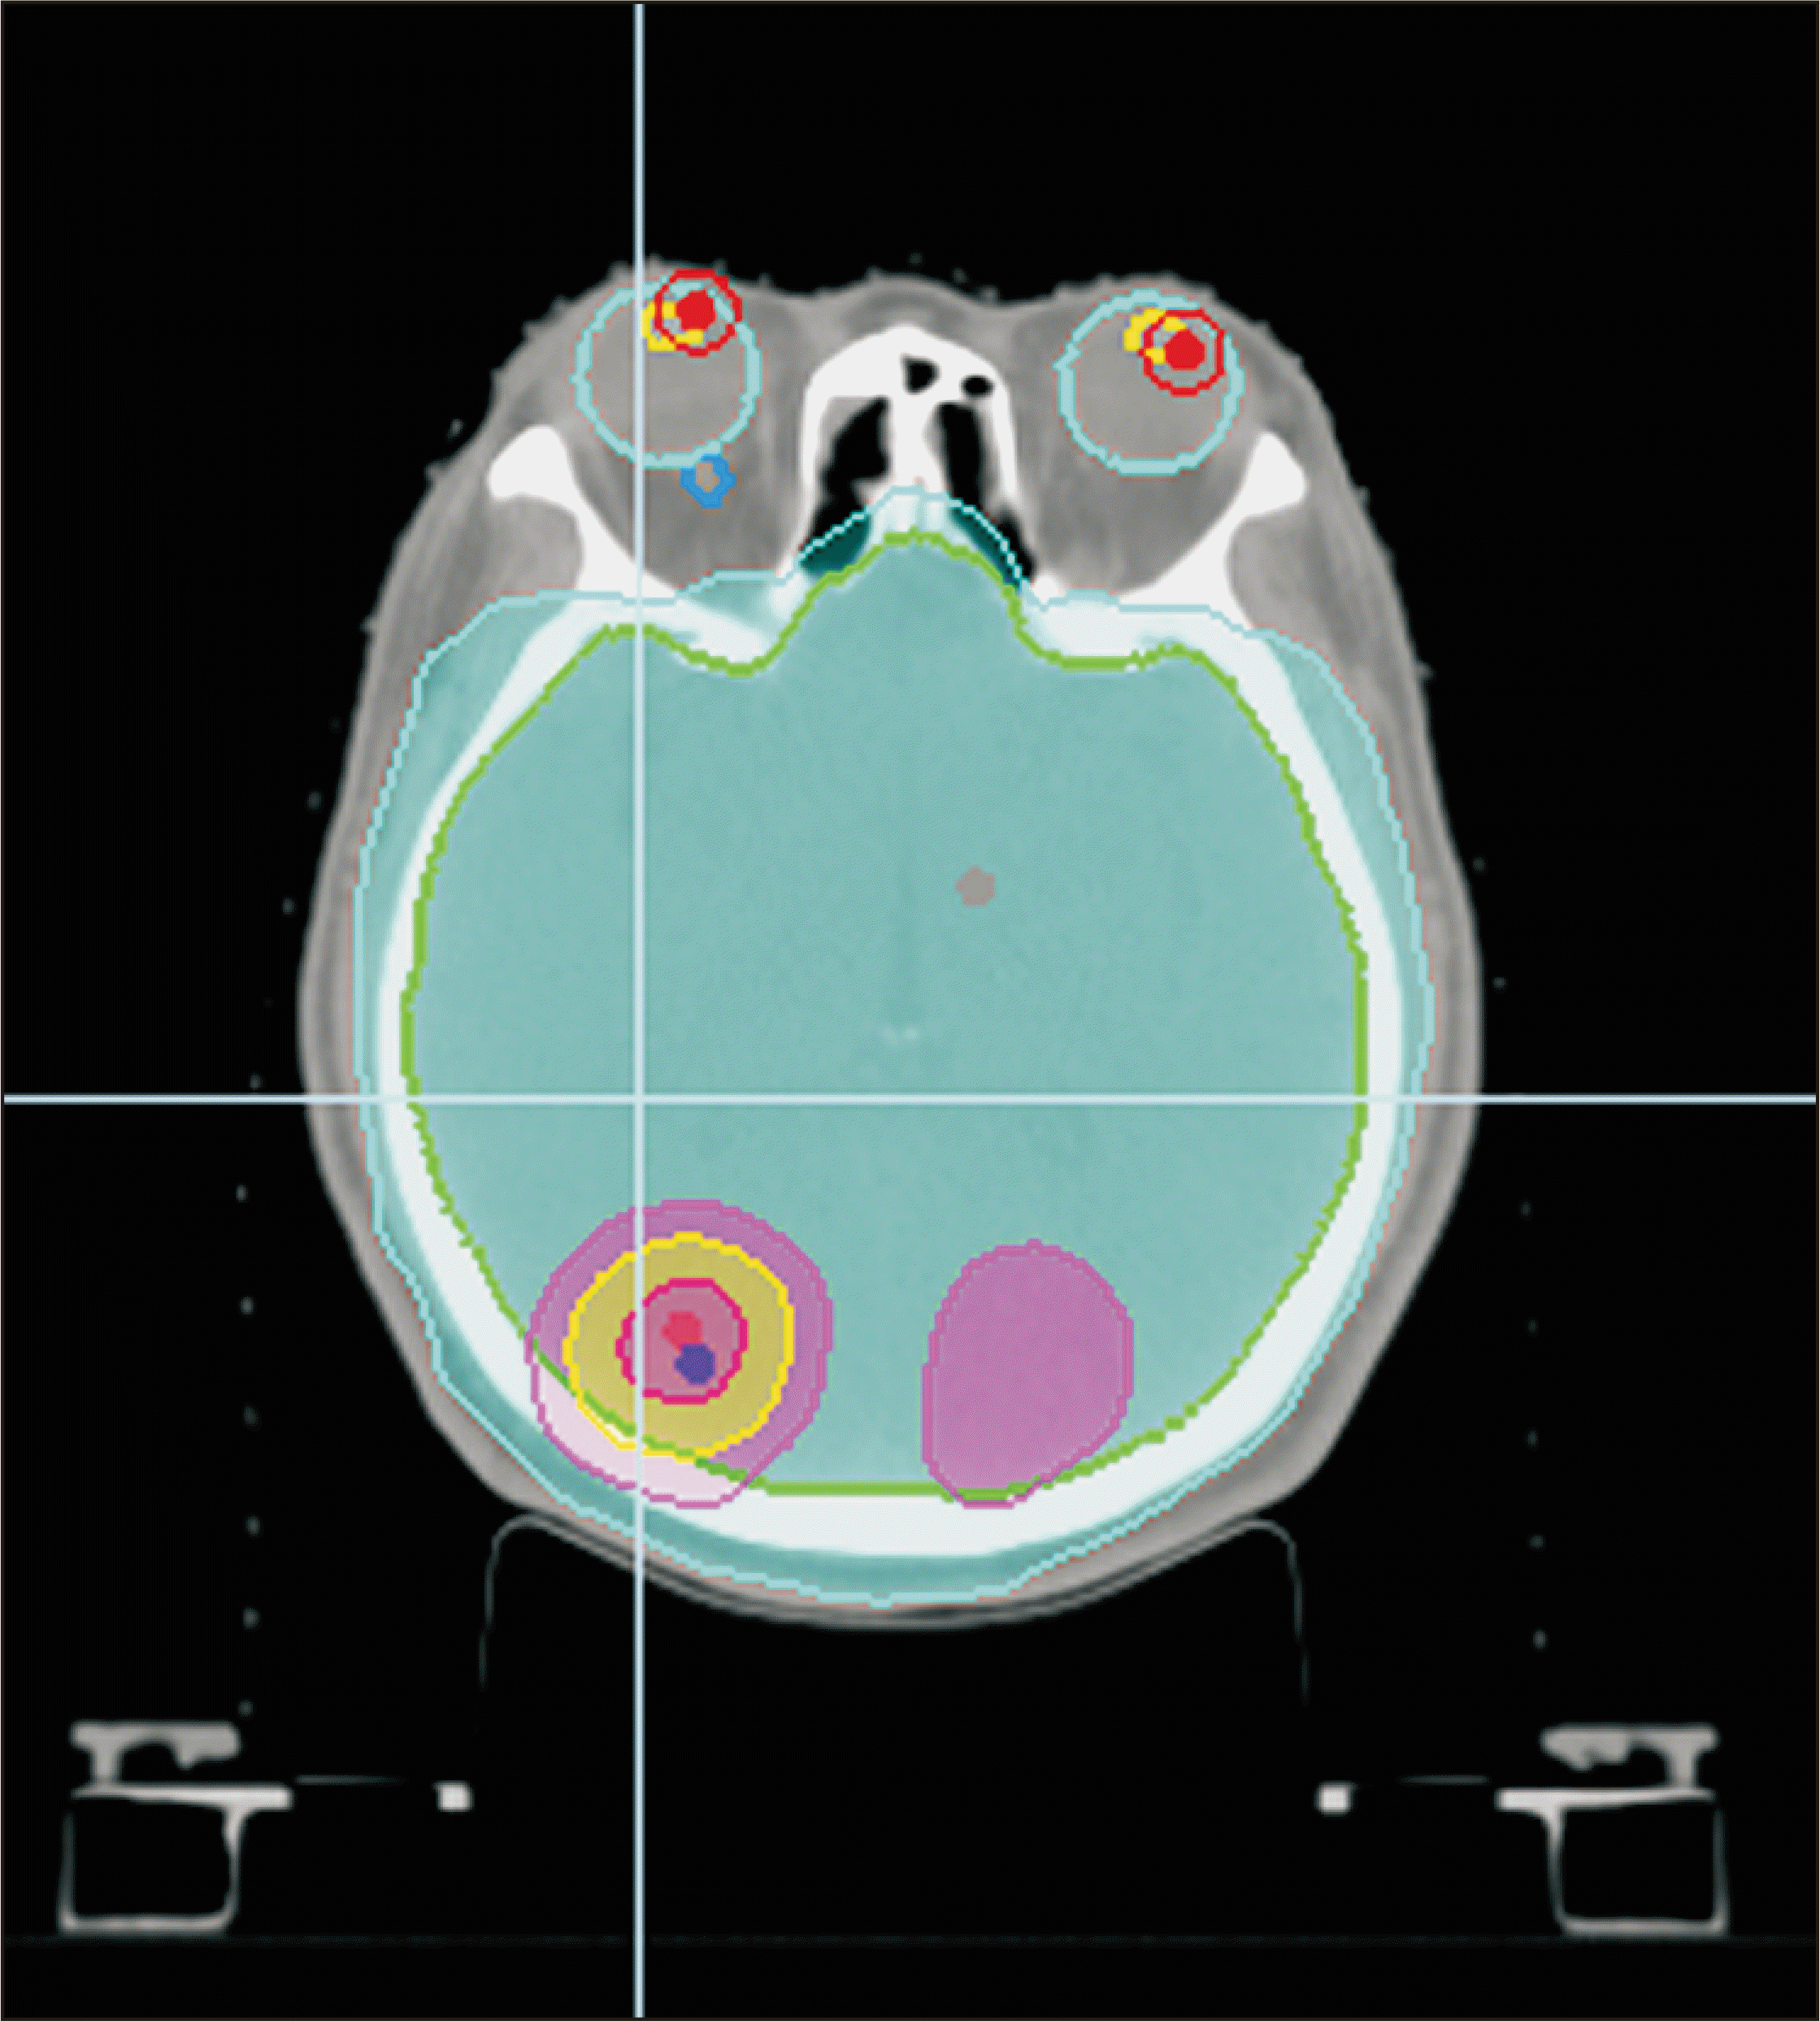
Unlike in previous studies, the goal of this study was to verify Accuray Precision’s new feature of Plan transfer function between Radixact machines using its own conversion protocols and without using a third party TPS. In addition, twenty treatment plans were selected from various sites to evenly verify the entire body. With respect to PTV dose coverages, the average value for CI was 0.17% (with the exception of one case in the pelvis site), with most CI values showing a difference of less than 0.3%. This represents a good result and is similar to that of Zhang et al. [5]. In addition, the HI was slightly higher than the CI with an average difference of 1.72%. For the H&N and pelvic sites, which showed results significantly different from those obtained by Zhang et al. [5], our study found small differences of 2.8% and 0.9%, respectively. Our study also found little difference in OARs as compared with the results of Yuan et al. [4]. We found that differences in OAR doses were uniformly within ±1% at all sites. However, in the lens, the average value was within 1%, although there was a maximum difference of 4.34. The two figures below are dose distributions of the case 4, who had the greatest dose difference in the right lens (Fig. 4, 5). Fig. 4 represents the image of the original treatment plan in machine B of case 4. Fig. 5 shows the treatment plan image of case 4 converted from machine B to machine A. This case is a whole brain radiation therapy with simultaneous integrated boost. Therefore, other institutions need more care if the target is near the lens and the dose of the lens is meant to be close to the threshold dose. Four cases were used for the brain in this study; hence, more cases will need to be studied in the future to determine whether there is a large difference in dose values when converting treatment plans to structures with smaller contours. A difference of greater than 1% was found in several OARs in the H&N and chest sites.
In Radixact using the golden beam data, but there was a case where the difference between PTV dose coverage and OAR dose is large. According to Accuray, the transfer process modifies the treatment delivery instructions to account for differences in field width, output, and MLC properties between two machines. As a cause of this difference, it can be assumed that the multileaf collimator (MLC) latency (delay time for MLC to fully open) influences the outcome of the treatment plan conversion. As a result of checking the machine of our institution, the offset of the leaves of machine A was −1.298 ms and the offset of machine B was −0.636 ms (Table 7). The offset of −1.298 ms from machine A means leaves are opening 1.298 ms less than programmed. The dose calculator will then use this offset value to adjust the commanded leaf open time (LOT). For example, if the requested open time is 100 ms, due to the correction, the requested time could be adjusted to 101.298 ms to compensate for MLC latency uncertainty. Therefore, when we perform a Plan transfer to machine B with an offset of –0.636 ms, the End-of-Planning/latency correction calculation would use this to reduce the open time from the original plan since the destination machine has less delay in actual LOT. Tomotherapy is a device that uses binary MLC, and it is one of the important components because it controls the dose delivered to the patient. However, after reducing the difference between the two machines by putting the updated offset value of the MLC latency, we could not recheck whether the difference was reduced or not. Therefore, other institutions should check this factor and reconfirm whether it affects the converted treatment plan result. In addition, according to Accuray, the latency offset will be set to zero and that the latency offset is always updated every day by the system in the Radixact updated version. This will be a great improvement on how the system models the latency data and applies new values depending on the day’s MLC performance.
The difference in absolute dose measurements using ion chambers was 0.74% (absolute value) on average. The difference (%) in absolute dose values between treatment plans converted from machine A to machine B was 0.85% on average and had a maximum of –2.33%. When converting from machine B to machine A, the difference (%) was 0.62% on average and had a maximum difference of 1.32%. The difference in absolute dose values between the two machines was insignificant, and the P-value of the difference in conversion between the two machines was 0.46, indicating that the absolute dose value was not significant when converting between the two machines.
As for the gamma passing rates analysis, the average was 99.64% in the 3%/3 mm standard of general IMRT criteria, while the even more stringent 2%/2 mm criteria also had a value of 97.08% [16,17]. These results were superior to those obtained by previous studies, which found 98%±1% and >95% based on 3%/3 mm criteria [8,9]. We validated the effectiveness of the plan transfer features between two Radixacts sharing patient data in IDMS. This feature should also have the same effectiveness among other (non-Radixact) types of HT machines connected through IDMS. By the result of this study, another user will need to extract some representative cases from each body site to verify the accuracy of the converted treatment plan. Perhaps it does not take too long to recover after machine breakdown; thus, most transferred plans are not used much. Therefore, it will have little impact in conventional scheduled treatment cases. However, careful attention should be paid during short fractional treatments, such as stereotactic radiosurgery or stereotactic body radiotherapy.
Under normal circumstances, we usually proceed with the planned treatment plan. However, it is important to find a way to continue patient treatment in the event of contingencies, such as machine breakdown. In this study, we worked to evaluate whether plans managed in IDMS are accurately converted by using Accuray Precision’s Plan transfer function. Our results confirmed that this feature is stable and reliable. However, there was a case where the difference between PTV dose coverage and OAR dose. This should be checked by each institution on how it affects the planning results by comparing the MLC latency table between the two machines. Using this function, a given treatment plan can be converted within five minutes and made available to continue treatment on another treatment machine. This will reduce stress among both clinicians and patients and improve treatment results.
Notes
References
1. Mackie TR, Holmes T, Swerdloff S, Reckwerdt P, Deasy JO, Yang J, et al. 1993; Tomotherapy: a new concept for the delivery of dynamic conformal radiotherapy. Med Phys. 20:1709–1719. DOI: 10.1118/1.596958. PMID: 8309444.

2. Mackie TR, Balog J, Ruchala K, Shepard D, Aldridge S, Fitchard E, et al. 1999; Tomotherapy. Semin Radiat Oncol. 9:108–117. DOI: 10.1016/s1053-4296(99)80058-7. PMID: 10196402.

3. An YC, Kim JS, Kwon DY, Kim JM, Choi BK. 2018; Usability assessment of plan transfer between TOMO HAD and Radixact: planning study. J Korean Soc Radiat Ther. 30:117–128.
4. Yuan Z, Nair CK, Benedict SH, Valicenti RK, Rao S, Fragoso RC, et al. 2018; Converting treatment plans from helical tomotherapy to L-shape Linac: clinical workflow and dosimetric evaluation. Technol Cancer Res Treat. 17:1533033818785279. DOI: 10.1177/1533033818785279. PMID: 29986638. PMCID: PMC6048611.

5. Zhang X, Penagaricano J, Narayanasamy G, Corry P, Liu T, Sanjay M, et al. 2017; Helical tomotherapy to LINAC plan conversion utilizing RayStation Fallback planning. J Appl Clin Med Phys. 18:178–185. DOI: 10.1002/acm2.12032. PMID: 28291935. PMCID: PMC5689873.
6. Lewis D, Micke A, Yu X, Chan MF. 2012; An efficient protocol for radiochromic film dosimetry combining calibration and measurement in a single scan. Med Phys. 39:6339–6350. DOI: 10.1118/1.4754797. PMID: 23039670.

7. Cusumano D, Fumagalli ML, Marchetti M, Fariselli L, De Martin E. 2015; Dosimetric verification of stereotactic radiosurgery/stereotactic radiotherapy dose distributions using Gafchromic EBT3. Med Dosim. 40:226–231. DOI: 10.1016/j.meddos.2015.01.001. PMID: 25680475.

8. Low DA, Dempsey JF. 2003; Evaluation of the gamma dose distribution comparison method. Med Phys. 30:2455–2464. DOI: 10.1118/1.1598711. PMID: 14528967.

9. Casanova Borca V, Pasquino M, Russo G, Grosso P, Cante D, Sciacero P, et al. 2013; Dosimetric characterization and use of GAFCHROMIC EBT3 film for IMRT dose verification. J Appl Clin Med Phys. 14:4111. DOI: 10.1120/jacmp.v14i2.4111. PMID: 23470940. PMCID: PMC5714357.
10. Arjomandy B, Tailor R, Anand A, Sahoo N, Gillin M, Prado K, et al. 2010; Energy dependence and dose response of Gafchromic EBT2 film over a wide range of photon, electron, and proton beam energies. Med Phys. 37:1942–1947. DOI: 10.1118/1.3373523. PMID: 20527528.

11. Niroomand-Rad A, Blackwell CR, Coursey BM, Gall KP, Galvin JM, McLaughlin WL, et al. 1998; Radiochromic film dosimetry: recommendations of AAPM Radiation Therapy Committee Task Group 55. American Association of Physicists in Medicine. Med Phys. 25:2093–2115. DOI: 10.1118/1.598407. PMID: 9829234.
12. Shaw E, Kline R, Gillin M, Souhami L, Hirschfeld A, Dinapoli R, et al. 1993; Radiation Therapy Oncology Group: radiosurgery quality assurance guidelines. Int J Radiat Oncol Biol Phys. 27:1231–1239. DOI: 10.1016/0360-3016(93)90548-a. PMID: 8262852.

13. Stanley J, Breitman K, Dunscombe P, Spencer DP, Lau H. 2011; Evaluation of stereotactic radiosurgery conformity indices for 170 target volumes in patients with brain metastases. J Appl Clin Med Phys. 12:3449. DOI: 10.1120/jacmp.v12i2.3449. PMID: 21587193. PMCID: PMC5718686.

14. Depuydt T, Van Esch A, Huyskens DP. 2002; A quantitative evaluation of IMRT dose distributions: refinement and clinical assessment of the gamma evaluation. Radiother Oncol. 62:309–319. DOI: 10.1016/s0167-8140(01)00497-2. PMID: 12175562.

16. Martisíková M, Ackermann B, Jäkel O. 2008; Analysis of uncertainties in Gafchromic EBT film dosimetry of photon beams. Phys Med Biol. 53:7013–7027. DOI: 10.1088/0031-9155/53/24/001. PMID: 19015581.
17. Ramachandran P, Tajaldeen A, Taylor D, Wanigaratne D, Roozen K, Geso M. 2017; Evaluation and performance of ArcCheck and film using gamma criteria in pre-treatment quality assurance of stereotactic ablative radiotherapy. J Med Phys. 42:251–257. DOI: 10.4103/jmp.JMP_132_16. PMID: 29296040. PMCID: PMC5744454.

Fig. 3
Analysis image of gamma criteria (a) 3%/3 mm and (b) 2%/2 mm for prostate patients in RIT 113 (Radiological Imaging Technology, Colorado Springs, CO, USA) between the original plan and the transferred plan.
Table 1
Planning target volume coverage comparisons of the original plan A and transferred plan B
Table 2
Planning target volume coverage comparisons of the original plan B and transferred plan A
Table 3
Organs at risk dose differences (%) between the original plans and the transferred plans
Table 4
Absolute dose differences between the treatment plan converted from the original machine A to the transferred machine B
Table 5
Absolute dose differences between the treatment plan converted from the original machine B to the transferred machine A
Table 6
Distribution of gamma passing rates


 PDF
PDF Citation
 Print
Print



 XML Download