

 PDF
PDF Citation
 Print
Print


INTRODUCTION
Osteoarthritis (OA) is the most popular joint disorder characterized by gradual degeneration of joint cartilage, joint pain, and immobility [1]. OA is the main cause of aged people's suffering and injury. The frequency of OA continues to rise worldwide [2], thus the health burden of OA continues to increase with increasing lifespan. A clearer understanding of the causal risk factors associated with OA is therefore required. Although the etiology of OA is not well known, environmental conditions are likely to play an important role in the production of OA in genetically prone individuals.
While several factors lead to the development of OA, the intestinal microbiota has recently emerged as a pathogenic element in the initiation and progression of OA [3]. Dysbiosis of the intestinal microbiota tends to play a significant part in the etiopathogenesis of OA [4]. Intestinal microbiota DNA may be contained in cartilage and OA synovium [5]. The connection between intestinal microbiota and joint inflammation has been identified in animal arthritis models [6]. Studies have shown major alterations in the intestinal microbiota in OA patients and associations between serum concentrations of bacterial metabolites and joint degeneration, suggesting a connection between intestinal microbiome dysbiosis and OA [7]. All these evidences indicate that dysbiosis may lead to the development of OA. While these findings indicated the potential function of intestinal microbiota in OA manifestations, the mechanism for this involvement is unknown. Furthermore, the actual causal relation remains uncertain as observational studies are vulnerable to the bias, such as reversal causation and residual uncertainty, thereby preventing a clear understanding of the role of intestinal microbiota on OA [8].
Mendelian randomization (MR) is a methodology that uses genetic variants as instrumental variables (IVs) to determine whether the observational interaction between the risk factor and the disease is compatible with the causal impact [9,10]. The purpose of this research was to investigate whether intestinal microbiota is causally correlated with the occurrence of OA by means of a two-sample MR examination.
Go to : 
MATERIALS AND METHODS
Sources of data and choice of genetic variants
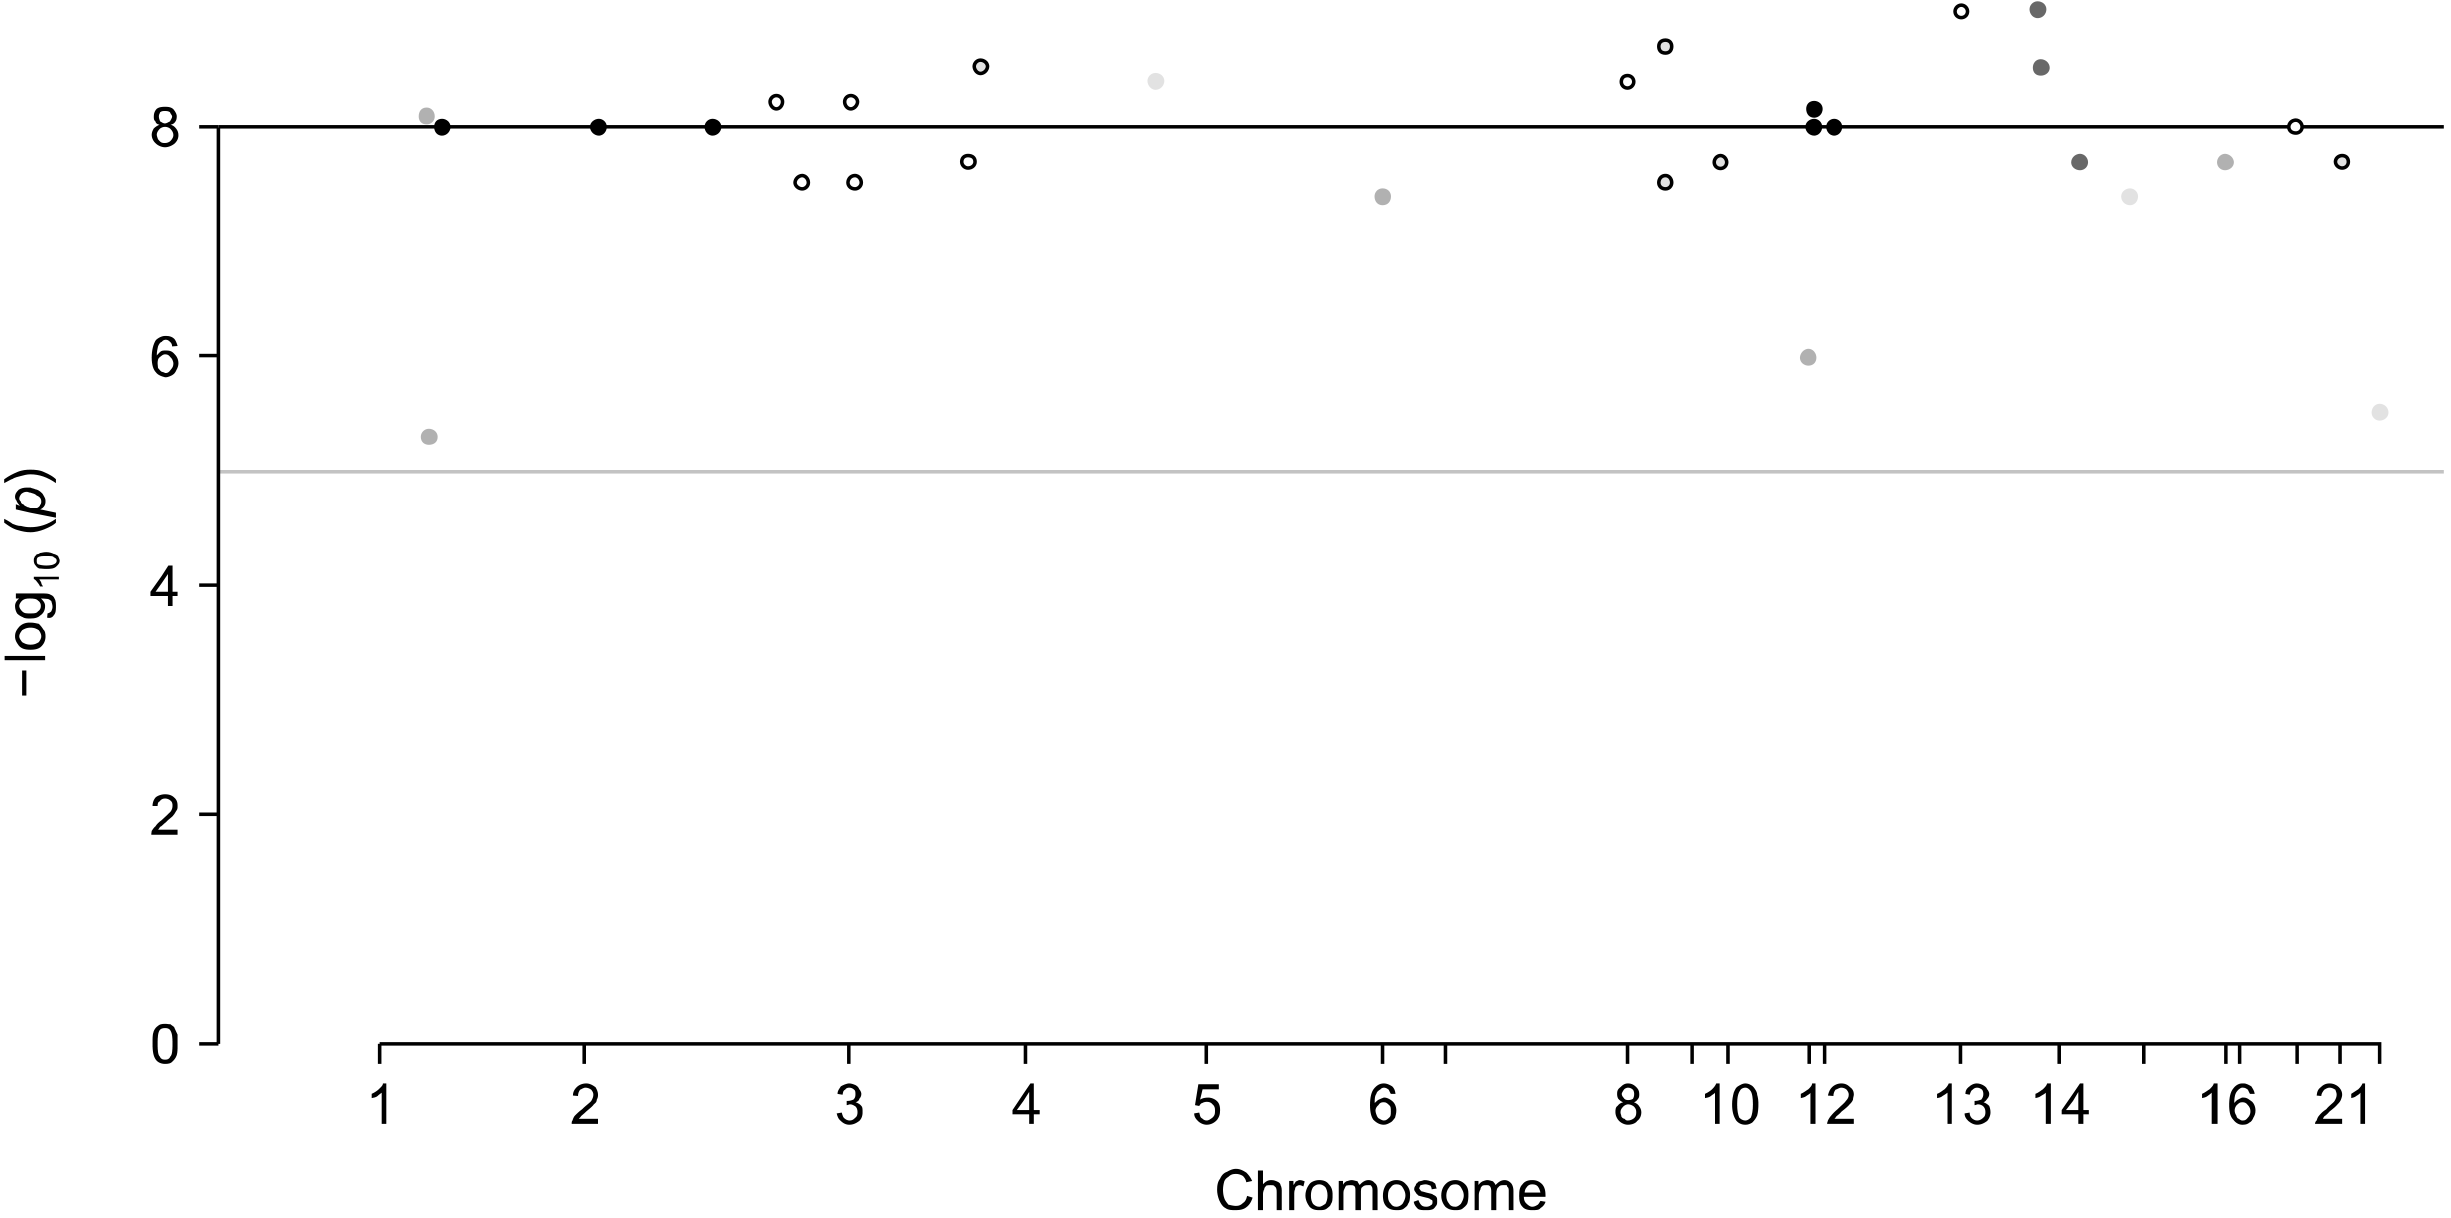
We checked the NHGRI-EBI GWASs catalogue (https:/www.ebi.ac.uk/gwas/), which is a systematic catalogue of documented associations of reported genome-wide association studies (GWAS) [11]. We used intestinal microbiota as an exposure and OA as an outcome. Publicly accessible summary statistics datasets of intestinal microbiota GWAS (total 3,326 individuals) of European ancestors were used as an exposure [12,13]. As an outcome, summary data were used from 3,498 patients with OA of the knee and hip and 11,009 controls of European descent from the United Kingdom from the arcOGEN analysis [14]. The OA patients were unrelated and of European origin, and all had primary OA of the hip or knee of radiographic Kellgren–Lawrence grade ≥2, or clinical evidence of disease to a level requiring total joint replacement. Women were 60.8% of the patients and joint replacement was performed in 78.6% [14]. We conducted a two-sample MR analysis utilizing genetic variants correlated with intestinal microbiota as IVs to enhance inference. The ‘top hits’ from a GWAS can be used to define genetic instruments for exposures in MR analyses. The selection criteria for IVs were as follows; 1) Association p-values of single-nucleotide polymorphisms (SNPs) with exposure should be less than a threshold of p<1×10⁻⁵ in GWAS dataset of exposure. 2) The SNPs from exposure dataset also should be present in GWAS dataset of outcome. Summary statistics (beta coefficients and standard errors [SEs]) were collected for 29 different SNPs correlated with intestinal microbiota as IVs (Figure 1). And we used the OA GWAS summary results for the 29 SNPs as an outcome [14].
Statistical test for Mendel randomization
Study of MR demands that genetic variants is linked to, but not to, possible confounders of, exposure [15]. Therefore, first, we evaluated the independent association of SNPs with gut microbiota. Second, we looked at the relation between each SNP and the occurrence of OA. Third, we merged these results to evaluate the causal relationship between intestinal microbiota and OA occurrence using an MR analysis. Two-sample MR, a tool used to measure the causal effects of exposure (gut microbiota) on outcomes (OA) utilizing summary statistics from various GWASs [16], was used to determine the causal association between intestinal microbiome and occurrence of OA utilizing summary results from GWASs linked to intestinal microbiome and OA with 29 SNPs as IVs (Table 1). The inverse variance weighting (IVW) method utilizes a meta-analysis technique to incorporate the Wald ratio calculation of the causal impact derived from various SNPs and to provide an estimate of the causal impact of the exposure on the outcome, whenever any of the genetic variants satisfies the assumptions of the IVs [16]. While the inclusion of several variants in the MR study results in improved statistical accuracy, it has the ability to incorporate pleiotropic genetic variants that are not appropriate for IVs [17]. For the discovery and adjustment of pleiotropy, i.e., the correlation of genetic variations with more than one component, the weighted median and MR-Egger regression methods have been used. MR-Egger regression is resilient to invalid instruments, checks and accounts for the existence of imbalanced pleiotropy by introducing a parameter for this bias by integrating summary data estimates of causal effects from multiple individual variants [18,19]. MR-Egger regression was used to assess the potential for violations of MR assumptions and to improve the reliability of causal inference. The weighted median estimator offers an accurate estimate of the causal effect, even though up to 50% of the data that contributes to the study is derived from genetic variants that are invalid IVs [20]. The benefit of the weighted median estimator is that it maintains better consistency in the results relative to the MR-Egger analysis [20]. Analyzes were found statistically relevant at p< 0.05. Both MR analyzes were conducted on the MR Base Platform (App version: 1.2.2 3a435d [31 January 2019], R version: 3.5.1) [21].
Table 1
Instrumental SNPs associated with gut microbiome and OA GWASs
![]()
Tests of heterogeneity and sensitivity
Heterogeneity between SNPs was tested using Cochran Q-statistics and funnel plots [22]. We have carried out a “leave one out” study to explore the likelihood of a causal relationship being powered by a single SNP. We conducted a subgroup study on the anatomical location (hip/knee) for the sensitivity examination.
Go to :
RESULTS
Instrumental variables for Mendelian randomization
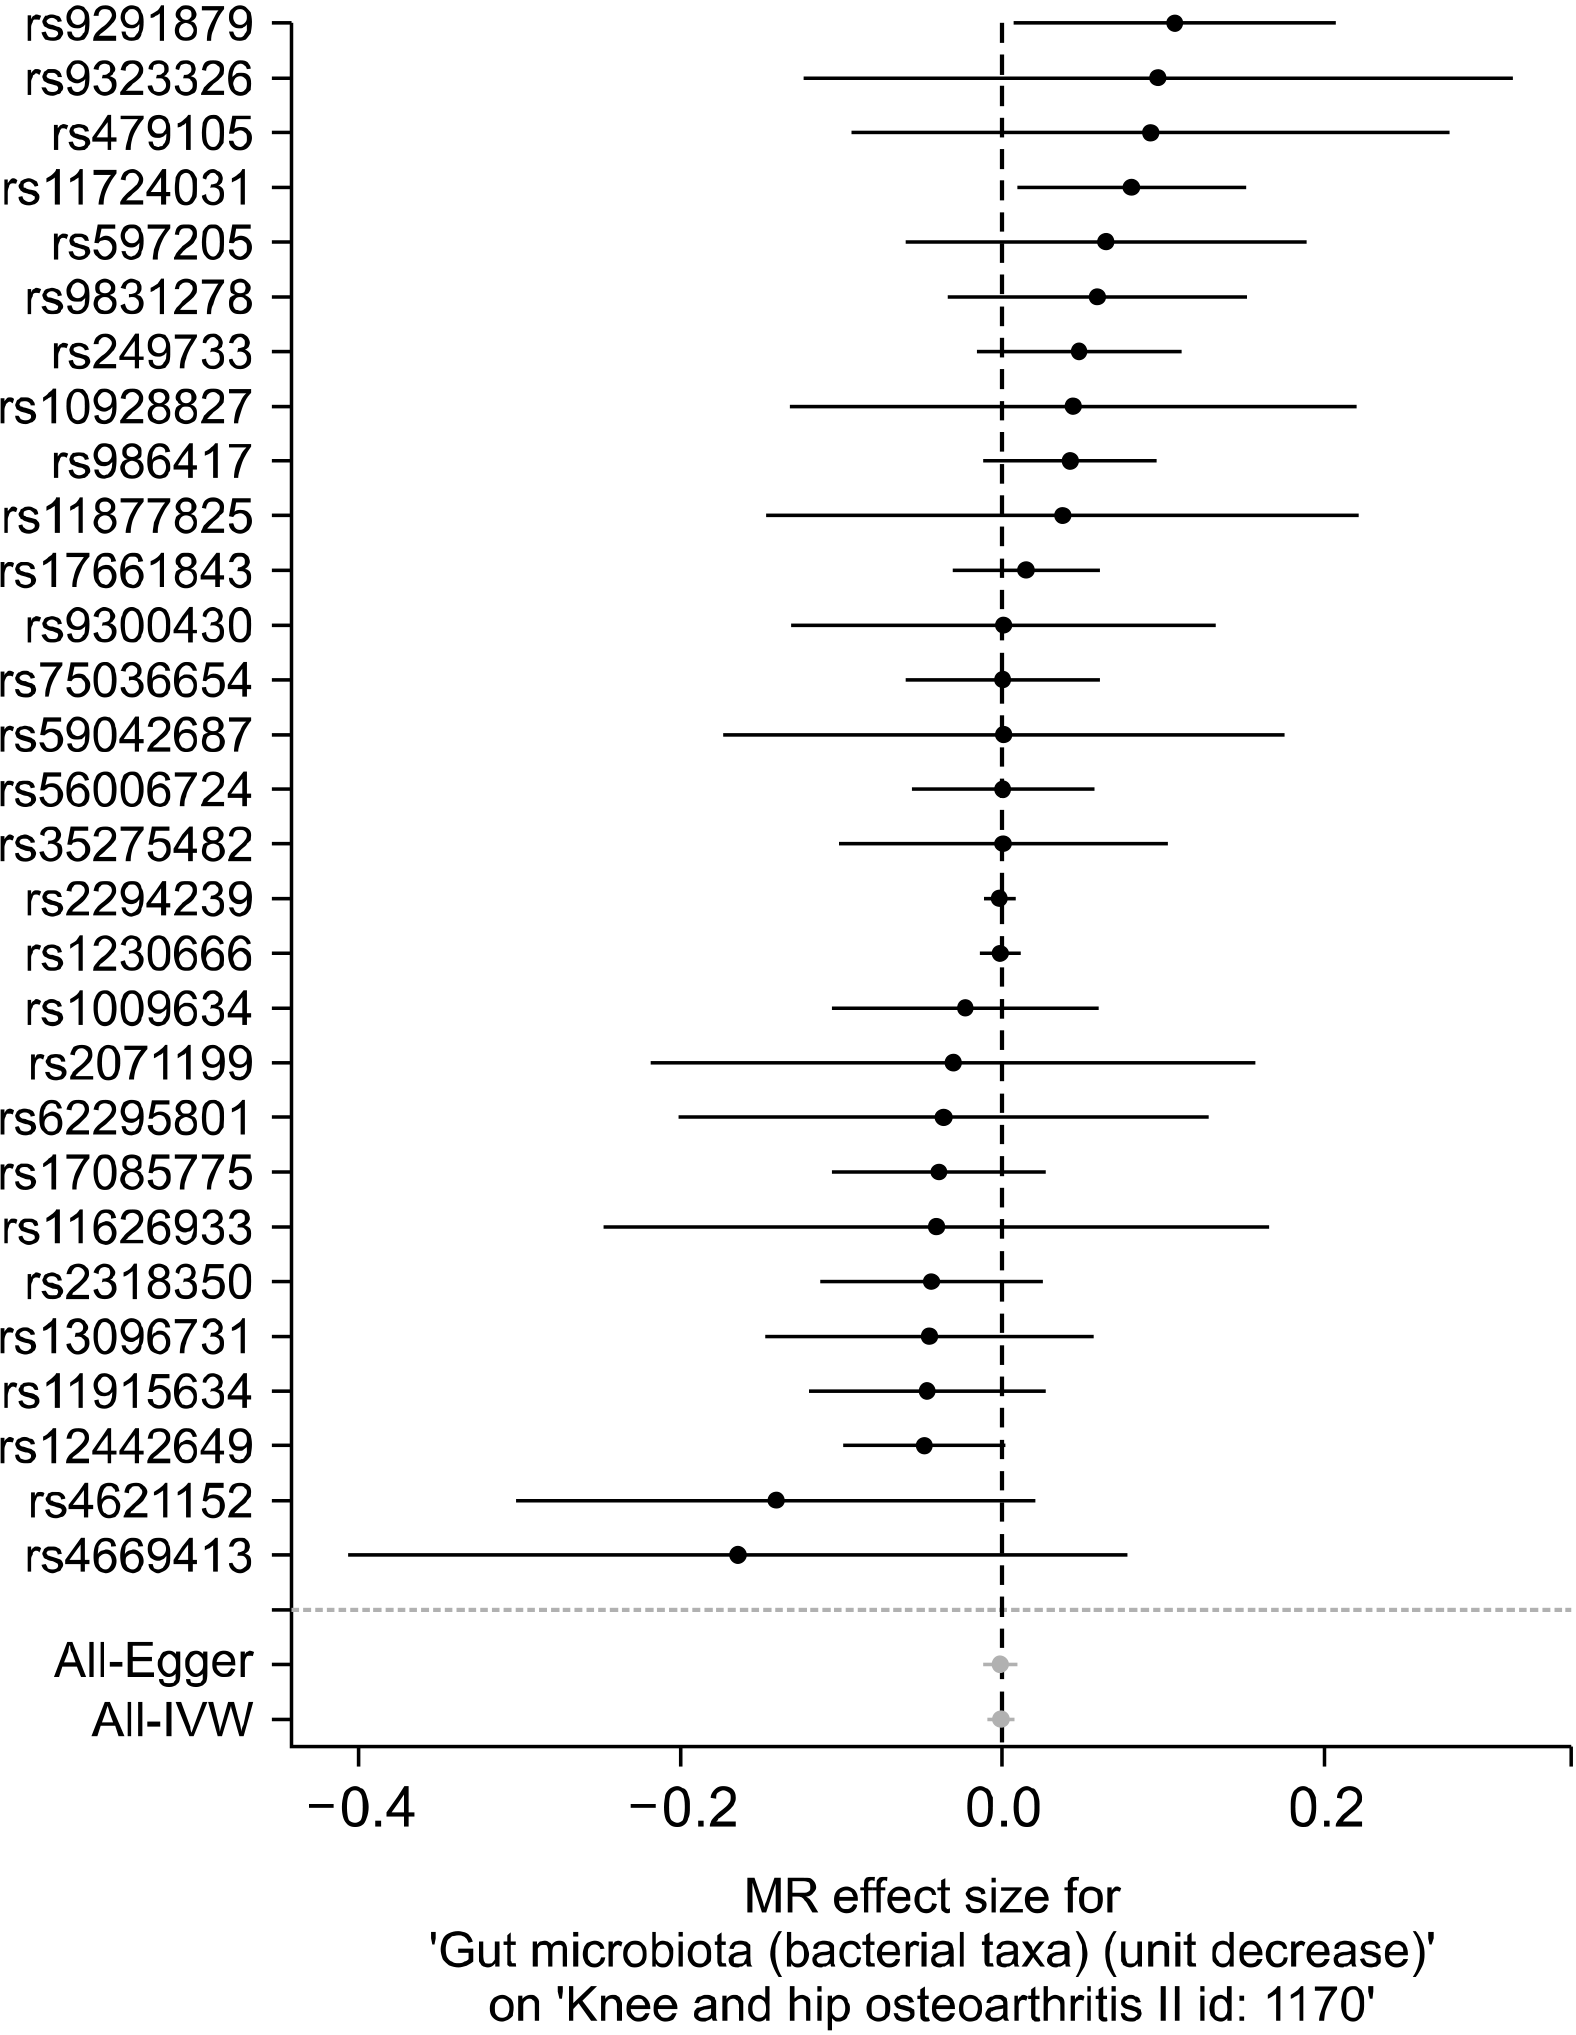
A total of 29 SNPs from GWAS on intestinal microbiota were chosen as IVs (Table 1). All of them were correlated with intestinal microbiota of genome-wide significance, except for rs1230666 and rs2294239 (Table 1). Rs11724031 was strongly correlated with OA, while some were not substantially linked to OA (Figure 2).
Results of Mendelian randomization
The IVW approach finds no evidence to prove a causal relationship between intestinal microbiota and OA (beta=−0.001, SE=0.004, p=0.748) (Table 2, Figures 2 and 3). The regression of MR-Egger showed that directional pleiotropy was unlikely to result in a bias (intercept=0.002, SE=0.007, p=0.697). The MR-Egger study showed no causal relation between intestinal microbiota and OA (beta=−0.002, SE=0.005, p=0.630) (Table 2, Figure 3). The weighted median analysis also did not have evidence of a causal relationship between intestinal microbiota and OA (beta=−0.002, SE=0.005, p=0.630) (Table 2, Figure 3). The MR estimates calculated using IVW, the median weighted and the MR-Egger regression approaches were consistent. Therefore, the findings of the MR analysis did not support a causal association between intestinal microbiome and OA risk.
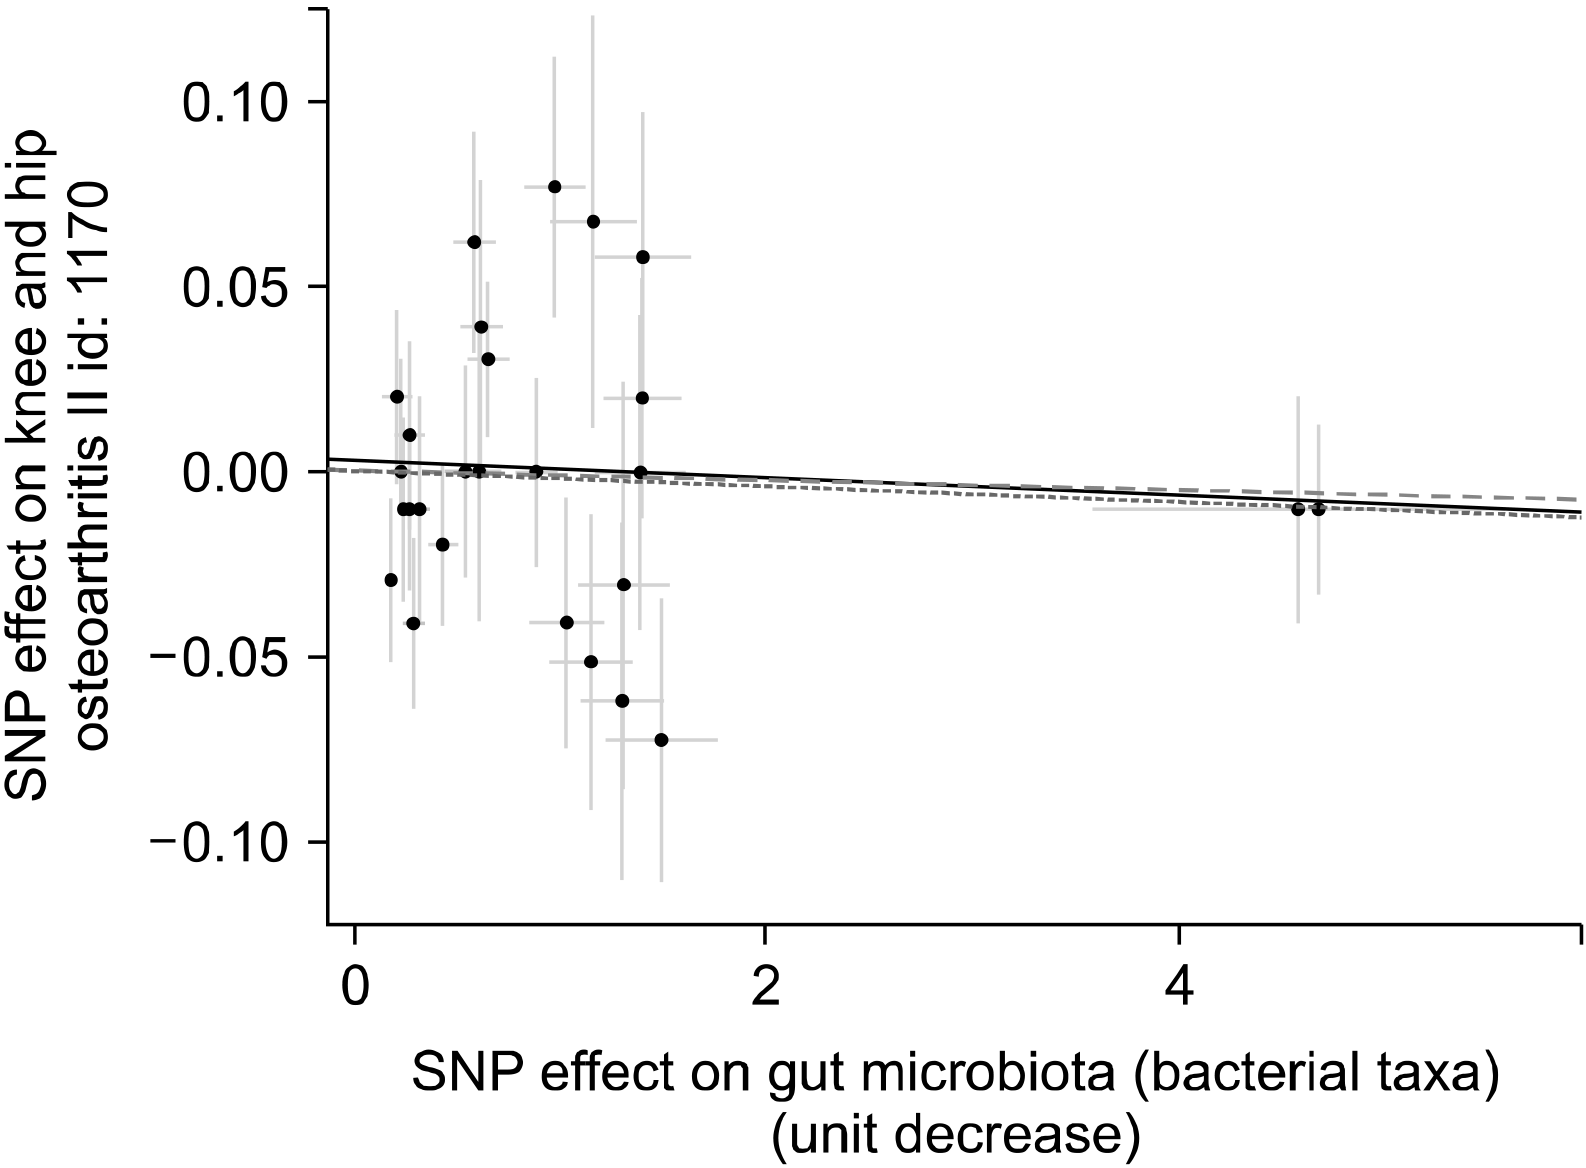 | Figure 3Scatter plots of genetic associations with gut microbiome against the genetic associations with osteoarthritis. The slopes of each line represent the causal association for each method. The dash line represents the inverse-variance weighting estimate; the dot line, the weighted median estimate; and the linear line, the Mendelian randomization‐Egger estimate. SNP: single nucleotide polymorphism.
|
Table 2
The MR estimates from each method of assessing the causal effect of gut microbiome on the incidence of OA
![]()
Tests of heterogeneity and sensitivity
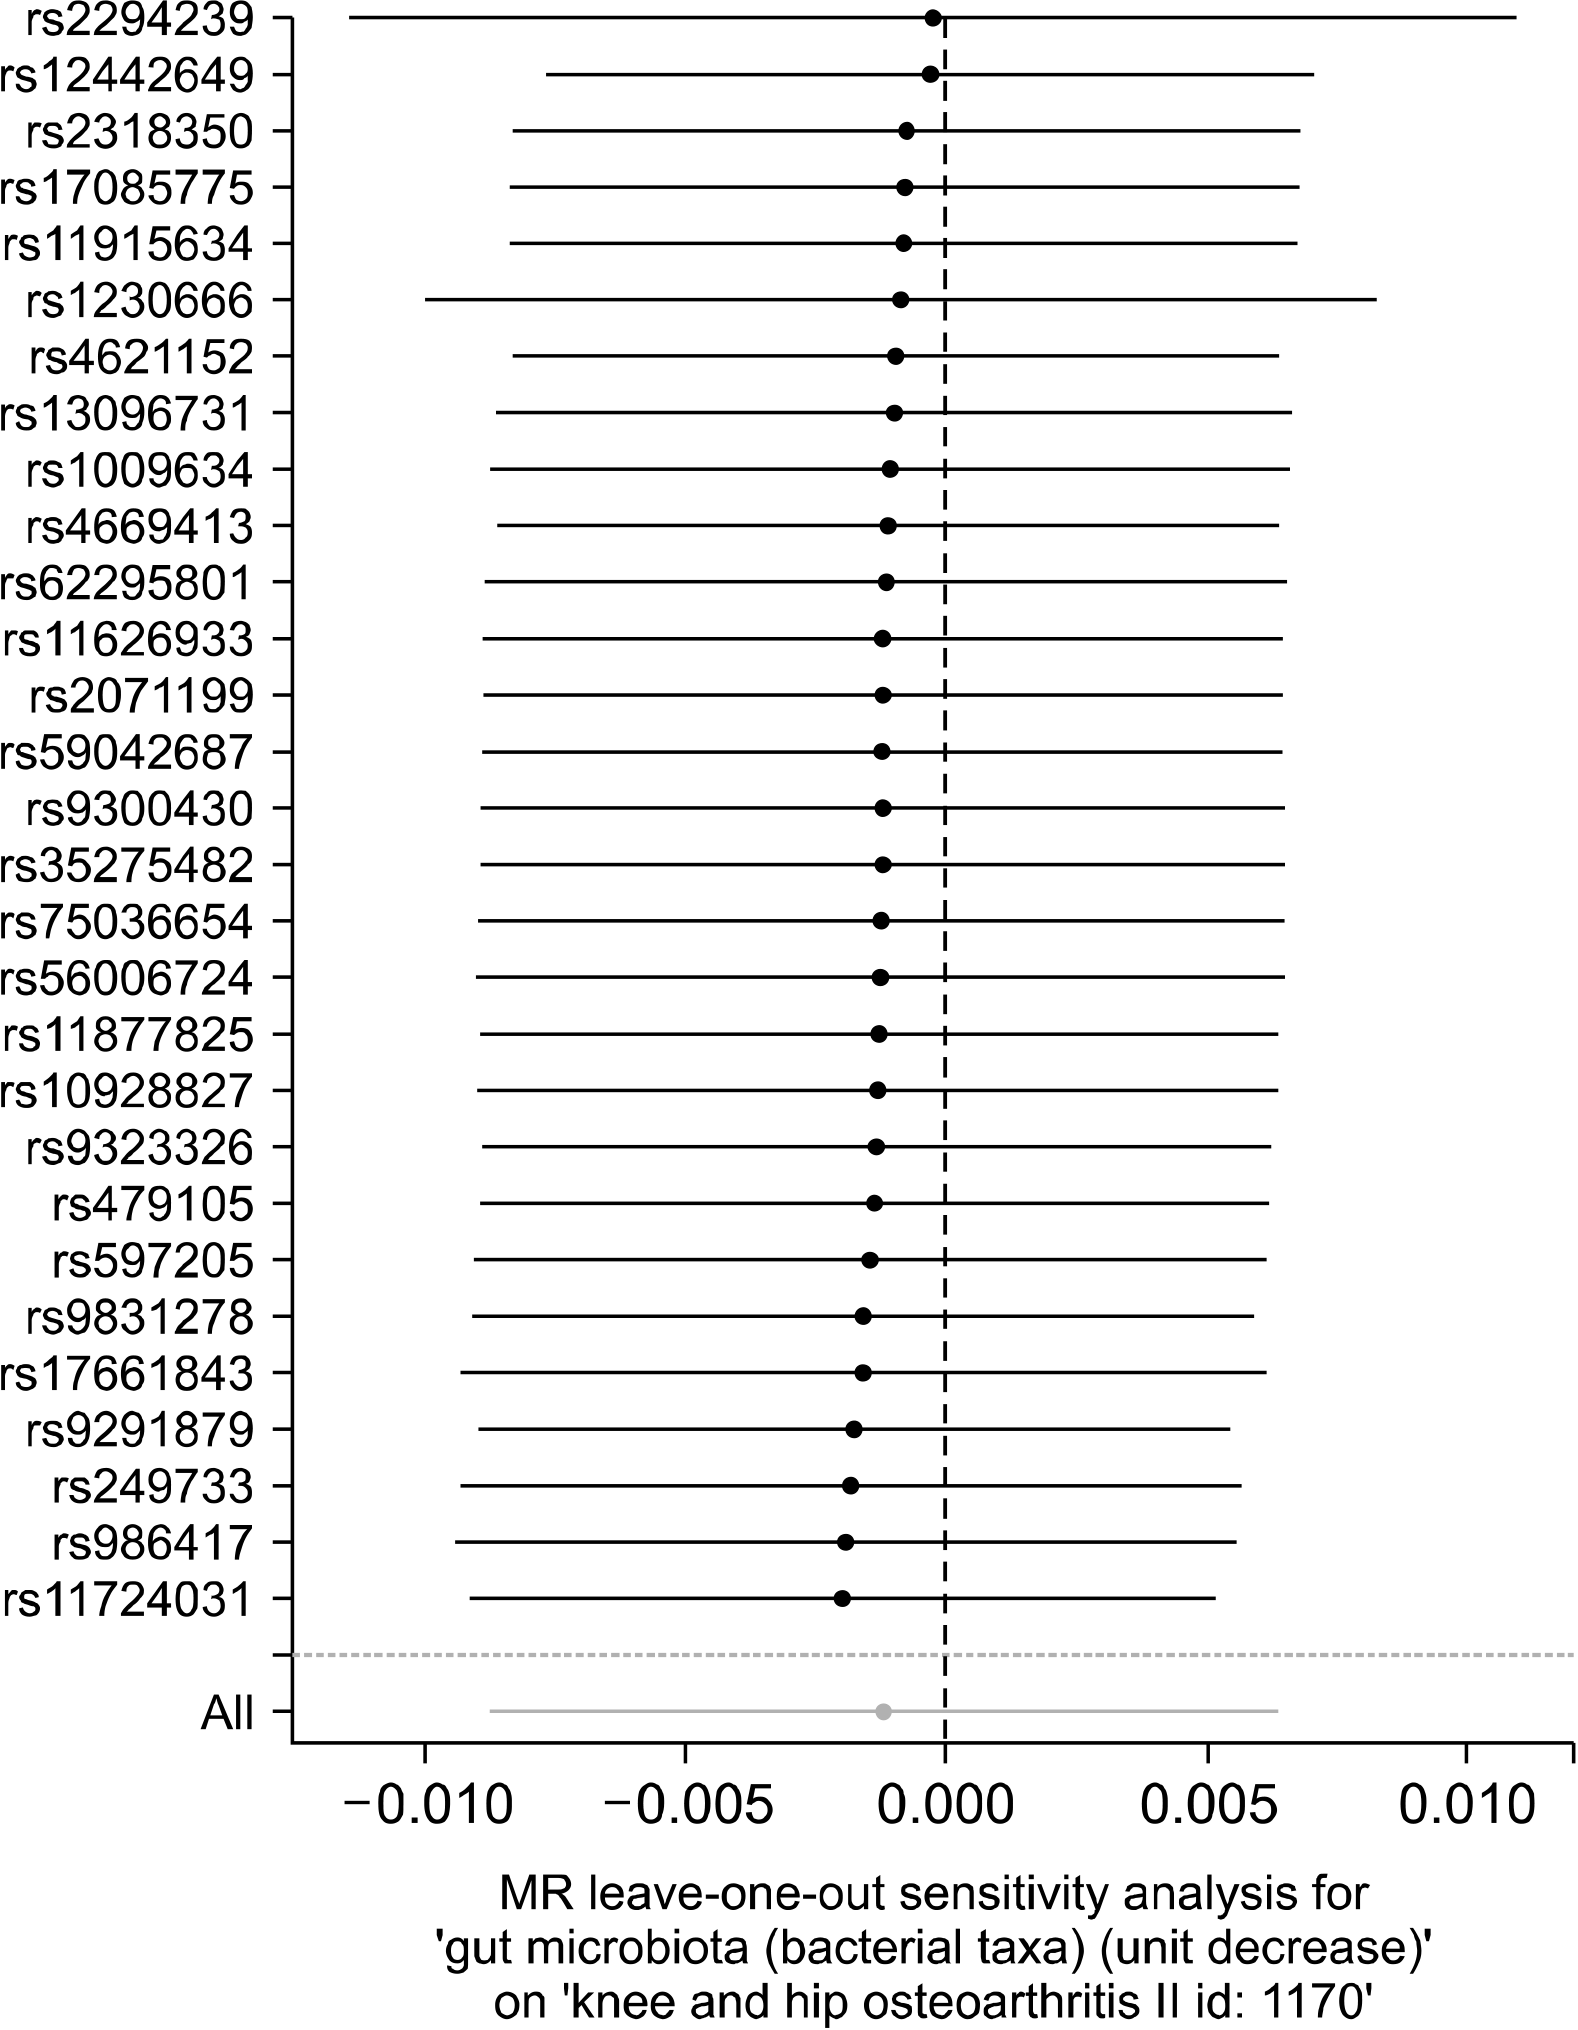
The Cochran Q test and the funnel test displayed no signs of heterogeneity between the IV estimates dependent on the individual variants, and the MR-Egger regression indicated no signs of directional pleiotropy (Table 2, Figure 3). Results from the “leave one out” study revealed that the IVW point estimate was not guided by a single SNP, and the MR results stayed non-significant after excluding rs1230666 and rs2294239 (Figure 4). When the MR study was stratified by anatomical location (hip/knee), the findings were not relevant in both the knee and hip OA.
Go to :
DISCUSSION
Several studies have reported that intestinal microbiota could be linked with an OA risk [3,4]. These findings suggest the possibility that the microbiome can mediate the effects and outcomes of OA. However, the exact function of intestinal microbiota involvement in OA pathophysiology remains under investigation. Hypotheses have been proposed to clarify the following findings [3]: (1) dysbiosis is correlated with metabolic syndrome, which may facilitate OA [23]; (2) in mice, obesity is correlated with depletion of beneficial Bifidobacteria in the intestine, contributing to macrophage migration to synovium and increased knee OA [24]; (3) OA is associated with lower-grade inflammation, which is mediated mainly by the innate immune system. Metabolic endotoxemia induced by damaged intestinal mucosa, and low-grade chronic inflammation can lead to the onset and progression of OA in obese patients [25].
The causal link between intestinal microbiota and OA remains uncertain, as previously recorded correlations might have been distorted by biases or conflicting factors inherent in observational studies, such as reverse causation interpretation, few small-scale trials, and selection bias. Thus, in order to understand this causality relationship, we tested the causality using three separate estimation approaches (IVW method, weighted median method, and MR-Egger regression) for MR research. Our analysis did not suggest a causative link between intestinal microbiome and OA risk. The MR estimates using IVW, MR Egger, and the weighted median analysis were consistent, and did not endorse a causal relationship between intestinal microbiota and OA.
MR minimizes the probability of bias present in observational trials owing to residual confounding or reverse causality. However, the MR experiments are vulnerable to pleiotropic distortion (a mixture of genetic variations of more than one variable) [26]. While the inclusion of multiple variants in the MR study contributes to improved statistical strength, it also results in the possible inclusion of pleiotropic genetic variants that are not true for IVs [27]. In order to adjust pleiotropy, we used a weighted median estimator, which offers accurate estimates even though 50 % of the SNPs are not accurate instruments [20], and we used MR-Egger regression to include an unbalanced pleiotropy test and evaluate a causal estimation of the impact of the treatment on the result in its presence [18]. The MR-Egger analysis and weighted median estimator results were comparable to the IVW estimator, giving increased confidence in these correlations. Our data indicate that the relationship between intestinal microbiome and OA previously documented could be the result of bias or conflicting factors inherent in observational studies.
MR rests on three assumptions of the instrument strength independent of direct effect (InSIDE). The first assumption was easily satisfied in MR by restricting the instruments to genetic variants that are discovered using genome-wide levels of statistical significance. To improve reliability of causal inference, MR results should be presented alongside sensitivity analyses that make allowance for various potential patterns of horizontal pleiotropy. Different extensions of the MR design such as MR-Egger or a weighted median test can be used to detect the presence of pleiotropy and/or estimate the causal effect of exposure, even in the presence of assumption 2 and/or 3 violations [6]. We proved the second and third assumptions by MR-egger regression and weighted median tests, which indicated that directional pleiotropy was unlikely to bias the result. Our MR analysis may hold the InSIDE assumptions and the causal estimate may be reliable.
There are some drawbacks to this study. First, to draw conclusions about negative association between gut microbiota and OA may have limitation, because of OA’s complex mechanism with a limited number of SNPs. Genetic differences have only a minimal impact on a given exposure, as they may explain just a small proportion of the total variation of a given exposure [28]. Our research could have had insufficient power to detect a link. Second, our study involved a limited number of SNPs as IVs, which might not have been statistically significant enough to identify association; statistical precision may be improved and a more reliable causal approximation can be achieved by adding many genetic variants together. Third, research on intestinal microbiome in OA was focused on participants with European ancestry. Since causality may rely on race, MR studies including other population are required. This MR also has its strength. While intestinal microbiome has been examined as a possible risk factor for OA, to the best of our knowledge, this is the first MR research to evaluate the causal association between intestinal microbiome and OA.
Go to :
CONCLUSION
In conclusion, the findings of this MR analysis did not support a causal association between intestinal microbiome and OA risk. Epidemiological evidence of an association between intestinal microbiota and OA may not seem to be causal. Well-designed epidemiological and MR experiments utilizing a lot of genetic variants that describe a higher proportion of intestinal microbiome are required to determine the causality.
Go to :
 XML Download