

 PDF
PDF Citation
 Print
Print


INTRODUCTION
MATERIALS AND METHODS
Subjects
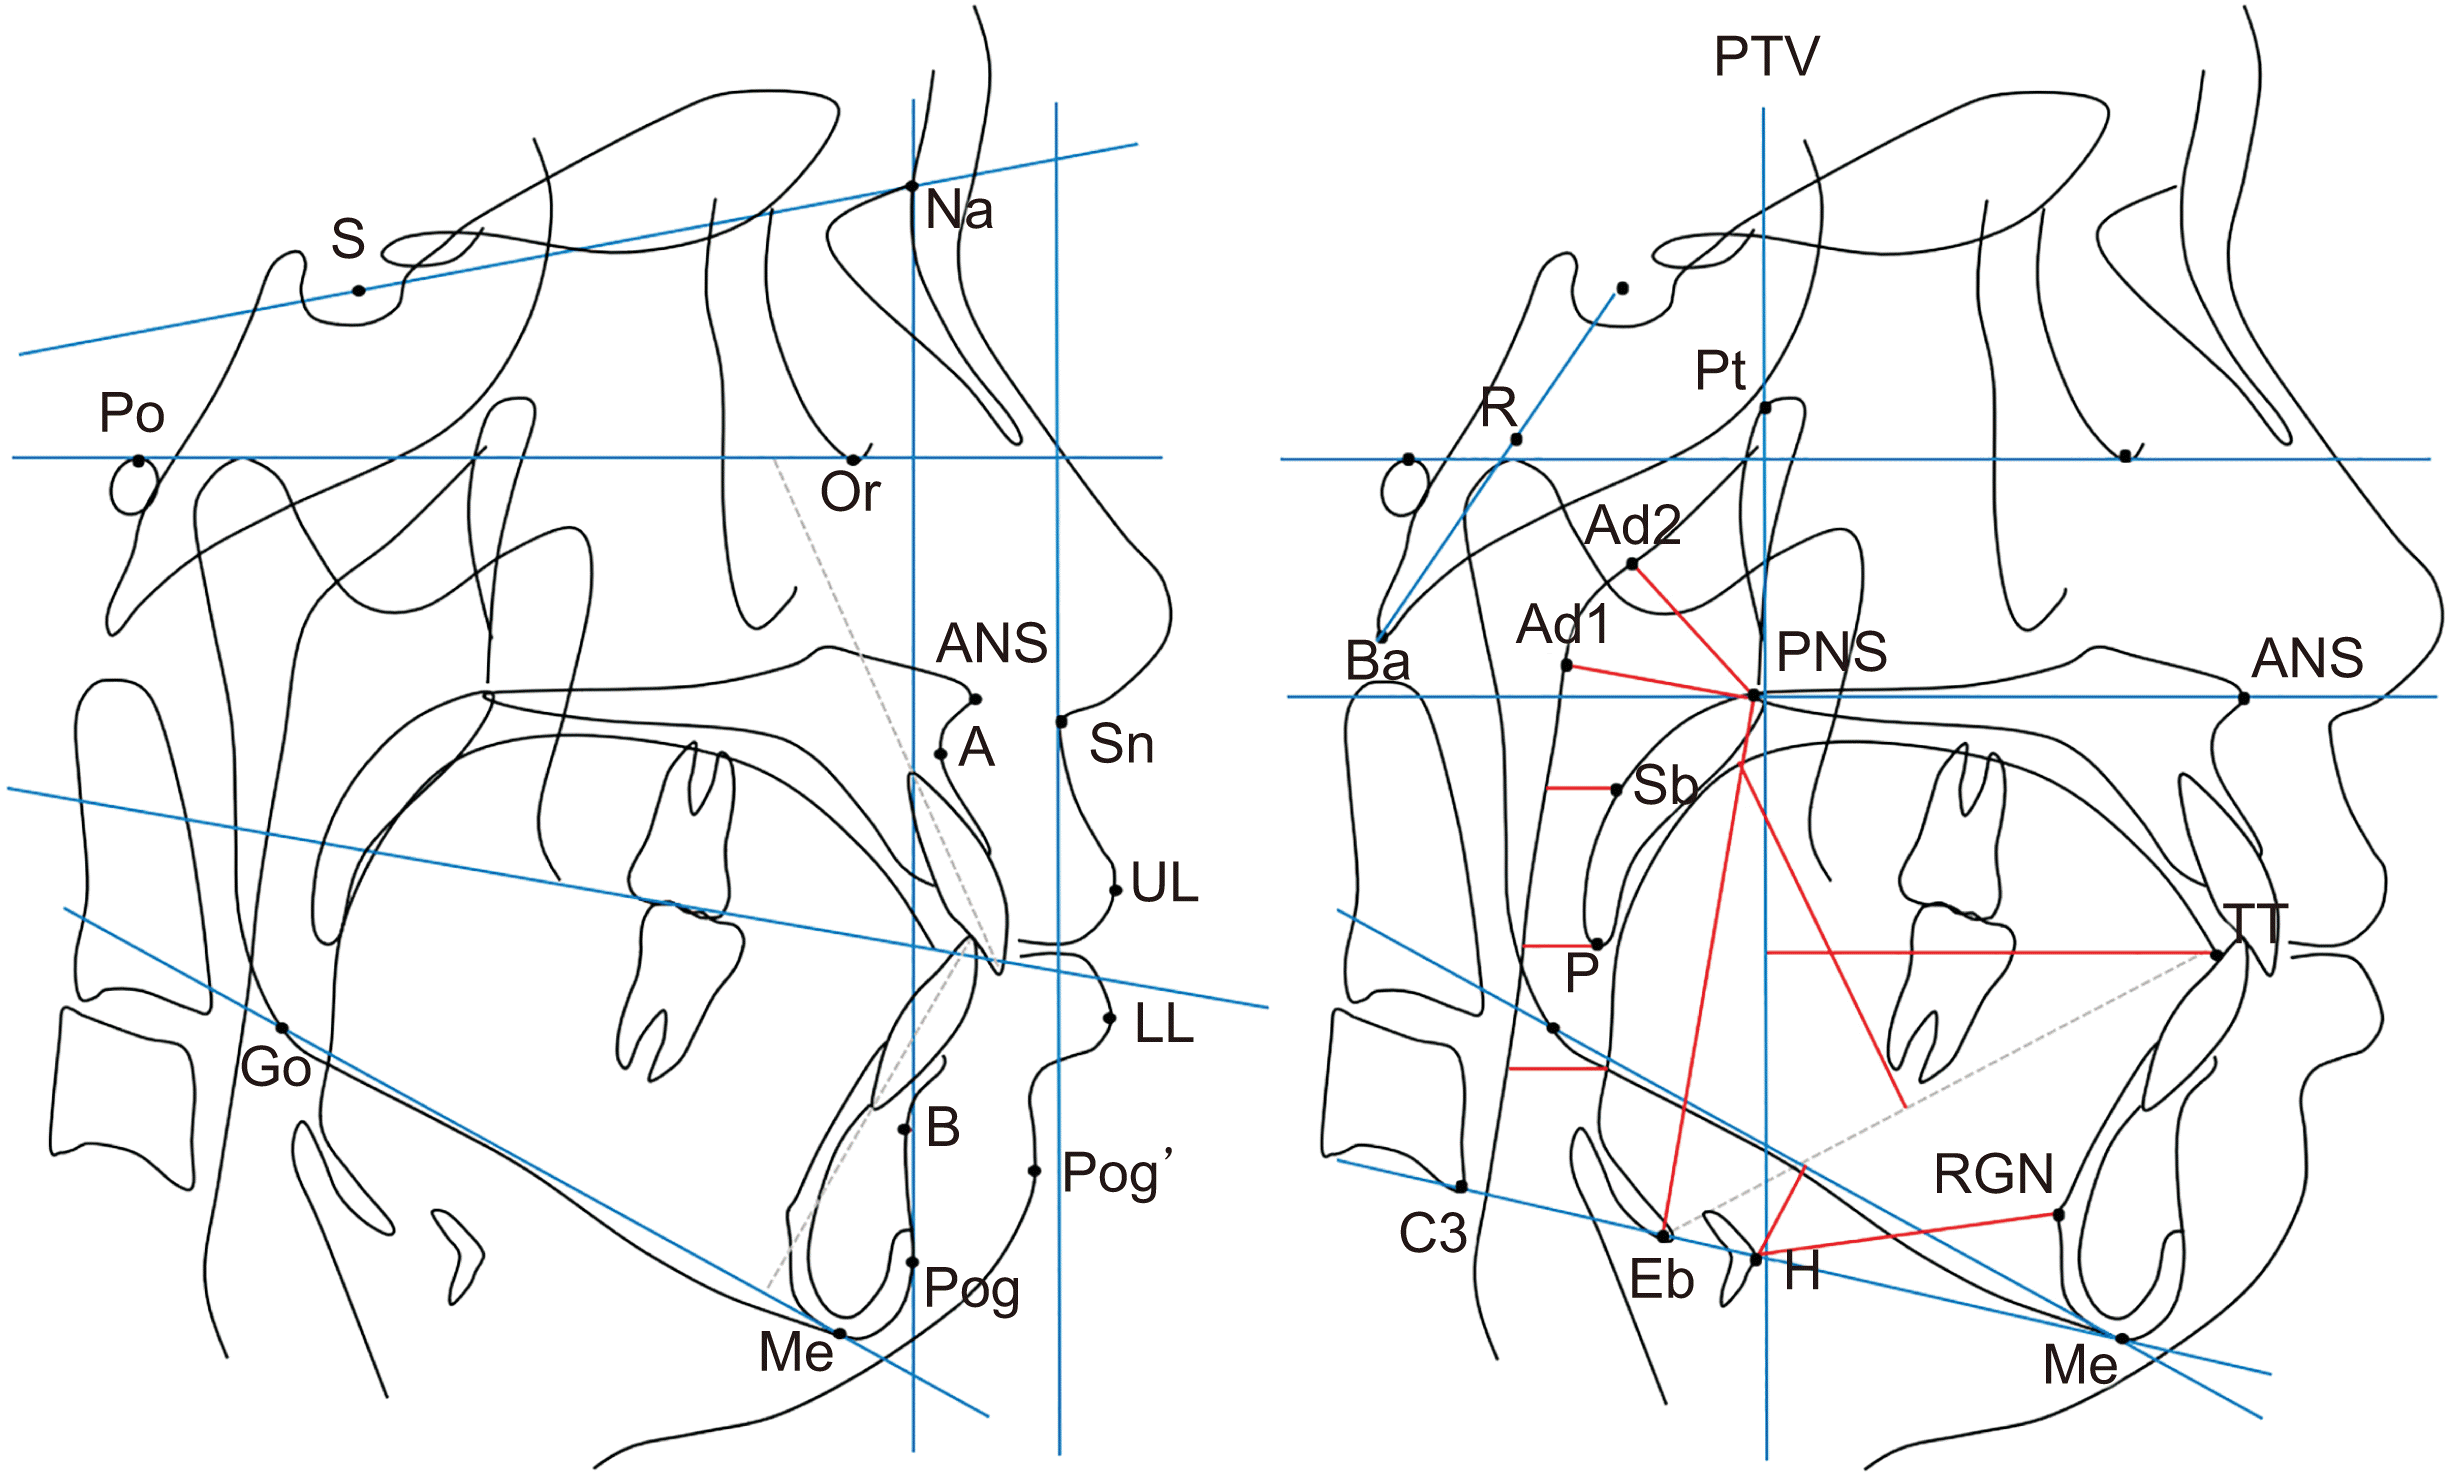 | Figure 1Dentoskeletal (A) and pharyngeal (B) cephalometric landmarks and measurements.
S, sella; Na, nasion; Po, porion; Or, orbitale; ANS, anterior nasal spine; PNS, posterior nasal spine; A, point A; B, point B; Pog, pogonion; Me, menton; Go, gonion; Sn, subnasale; UL, upper lip; LL, lower lip; Pog’; soft-tissue pogonion; Pt, pterygomaxillary point; Ad1, adenoid point 1; Ad2, adenoid point 2; Ba, basion; TT, tongue tip; H, hyoid bone; RGN, retrognathion; C3, third vertebra; P, tip of soft palate; R, midpoint of S-Ba line; Sb, belly of soft palate; Eb, base of epiglottis.
See footnote of Table 1 for the definition of measurements.
Table 1Overall treatment changes in dentoskeletal and upper airway variables in BSP patients
BSP, bimaxillary skeletal protrusion, SNA, sella-nasion-A point; SNB, sella-nasion-B point; ANB, A point-nasion-B point; Nper, nasion perpendicular plane; FH, Frankfort horizontal plane, MP, mandibular plane; OP, occlusal plane; LFH, lower facial height; U1, upper incisor; L1, lower incisor; IIA, interincisal angle; OJ, overjet; OB, overbite; SnV, subnasale vertical line; H-RGN, distance between H (the most superior and anterior point of hyoid bone) and RGN (the most protrusive point of retrognathion); MPH, the shortest distance from the mandibular plane (Me-Go) to H; H-PTV, distance between H and the perpendicular line from Pt to FH plane; H-C3Me, distance between H and C3 (anteroinferior limit of the third vertebra)-Me line; TGH, the shortest distance from the tongue dorsum to hard palate; TT-PTV, distance between the tongue tip and the perpendicular line from Pt to FH plane; SPL, soft palatal length, PNS-P (tip of soft palate); SPI, soft palate inclination, angle between the ANS-PNS and PNS-P lines; PNS-Ad1, lower nasopharyngeal airway space, width of the airway along the PNS-Ba line; PNS-Ad2, upper nasopharyngeal airway space, width of the airway along the PNS-R (midpoint of S-Ba line) line; SPAS, superior posterior airway space corresponding to the velopharynx, width of the airway along the parallel line to the palatal plane through Sb (belly of the soft palate); MAS, middle airway space corresponding to the upper glossopharynx, width of the airway along the parallel line to the palatal plane through P; IAS, inferior airway space, corresponding to the lower glossopharynx, width of the airway along the parallel line to the palatal plane through the intersection of the mandible and airway; VAL, vertical airway length, distance from PNS to Eb (base of epiglottis). †Independent t-test was performed for intergroup comparisons with the control group at T0 and T1, respectively. See Figure 1 for the definition of other landmarks.
| ||||||||||||||||||||||||||||||||||||||||||||||||||||||||||||||||||||||||||||||||||||||||||||||||||||||||||||||||||||||||||||||||||||||||||||||||||||||||||||||||||||||||||||||||||||||||||||||||||||||||||||||||||||||||||||||||||||||||||||||||||||||||||||||||||||||||||||||||||||||||||||||||||||||||||||||||||||||||||||||||||||||||||||||||||||||||||||||||||||||||||||||||||||||||||||||||||||||||||||||||||||||||||||||||||||||||||||||||||||||||||||||||||||||||||||||||||||||||||||||||||||||||||||||||||||||||||||||||||||||||||||||||||||||||||||||||||||||||||||||||||||||||||||||||||||||||||||
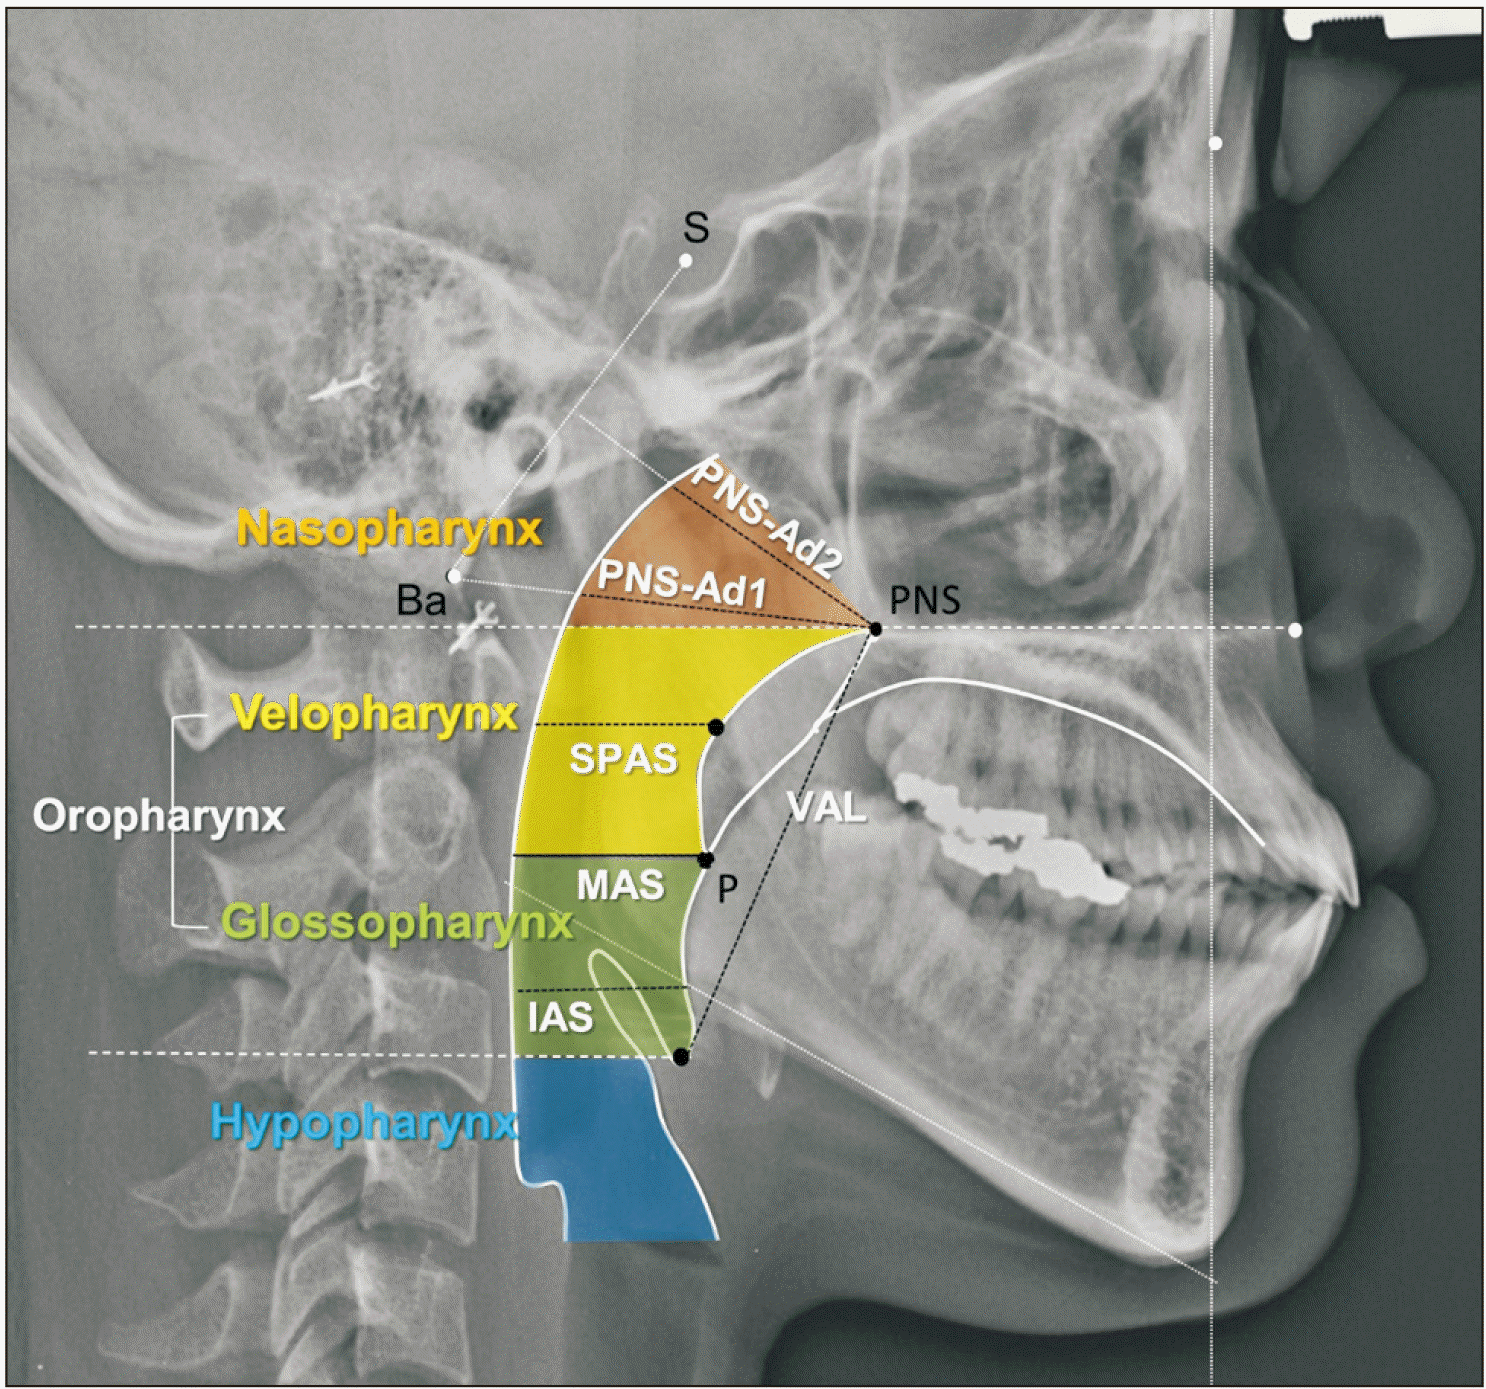 | Figure 2Cephalometric pharyngeal measurements to describe each pharyngeal airway section: PNS-Ad2 and PNS-Ad1 for the nasopharynx; superior posterior airway space (SPAS) for the velopharynx behind the soft palate; middle airway space (MAS) and inferior airway space (IAS) for the glossopharynx behind the tongue base; and vertical airway length (VAL) for the pharyngeal airway length.11
|
Statistical analysis
RESULTS
Overall treatment changes in the BSP patients in comparison with control samples (Table 1)
Comparisons between hyperdivergent and nonhyperdivergent groups (Tables 2 and 3)
Table 2
|
Upper airway variable (T0) |
Normal samples (n = 20) |
Hyperdivergent group (n = 27) |
Nonhyperdivergent group (n = 28) |
Intergroup comparison | |||||||||
|---|---|---|---|---|---|---|---|---|---|---|---|---|---|
|
|
|
|
|
||||||||||
| Mean | Standard deviation | Mean | Standard deviation | p-value† | Mean | Standard deviation | p-value† | p-value‡ | |||||
| Hyoid | H-RGN (mm) | 33.35 | 2.64 | 35.47 | 4.04 | 0.131 | 36.71 | 5.37 | 0.056 | 0.397 | |||
| MPH (mm) | 8.88 | 3.13 | 9.00 | 4.43 | 0.937 | 6.75 | 5.50 | 0.236 | 0.144 | ||||
| H-PTV (mm) | −0.35 | 2.81 | −3.47 | 5.28 | 0.171 | −0.33 | 4.33 | 0.989 | 0.082 | ||||
| H-C3Me (mm) | 1.34 | 4.69 | −2.82 | 4.54 | 0.024* | −0.02 | 4.88 | 0.434 | 0.053 | ||||
| Tongue | TGH (mm) | 1.91 | 0.72 | 4.63 | 2.36 | 0.025* | 2.16 | 2.47 | 0.315 | 0.020* | |||
| TT-PTV (mm) | 50.25 | 2.53 | 50.34 | 4.22 | 0.007 | 52.46 | 4.00 | 0.100 | 0.108 | ||||
| Soft palate | SPL (mm) | 31.46 | 2.03 | 32.55 | 3.19 | 0.067 | 32.45 | 3.29 | 0.108 | 0.913 | |||
| SPI (°) | 127.10 | 2.83 | 129.71 | 6.74 | 0.151 | 128.25 | 3.98 | 0.389 | 0.403 | ||||
| Pharyngeal airway | PNS-Ad1 (mm) | 25.10 | 2.54 | 27.63 | 4.48 | 0.097 | 28.18 | 3.53 | 0.012* | 0.642 | |||
| PNS-Ad2 (mm) | 26.89 | 1.50 | 26.26 | 4.93 | 0.610 | 27.20 | 4.36 | 0.939 | 0.744 | ||||
| SPAS (mm) | 13.30 | 1.57 | 12.92 | 2.52 | 0.659 | 15.54 | 2.48 | 0.009** | 0.001** | ||||
| MAS (mm) | 12.64 | 1.05 | 12.47 | 2.98 | 0.826 | 13.45 | 2.65 | 0.182 | 0.246 | ||||
| IAS (mm) | 11.16 | 1.30 | 11.68 | 3.35 | 0.548 | 13.11 | 3.24 | 0.011* | 0.023* | ||||
| VAL (mm) | 63.65 | 8.50 | 64.87 | 3.39 | 0.670 | 63.14 | 3.18 | 0.855 | 0.303 | ||||
![]()
Table 3
|
Treatment changes in variable (ΔT) |
Hyperdivergent group (n = 27) | Nonhyperdivergent group (n = 28) | Intergroup comparison | |||||||
|---|---|---|---|---|---|---|---|---|---|---|
|
|
|
|
||||||||
| Mean | Standard deviation | p-value† | Mean | Standard deviation | p-value† | p-value‡ | ||||
| Skeletal | SNA (°) | −1.63 | 1.32 | 0.000 *** | −1.39 | 0.98 | 0.000*** | 0.726 | ||
| SNB (°) | −1.24 | 1.55 | 0.003 ** | −0.89 | 0.99 | 0.000*** | 0.358 | |||
| ANB (°) | −0.39 | 1.85 | 0.511 | −0.50 | 0.96 | 0.011* | 0.436 | |||
| Nper-A (mm) | −1.68 | 1.23 | 0.000 *** | −1.80 | 0.98 | 0.000*** | 0.272 | |||
| Nper-B (mm) | −1.45 | 2.07 | 0.007 ** | −1.59 | 1.78 | 0.000*** | 0.803 | |||
| Nper-Pog (mm) | 0.26 | 1.39 | 0.419 | −0.82 | 1.81 | 0.024*. | 0.033* | |||
| FH-MP (°) | −0.39 | 1.28 | 0.259 | 0.45 | 1.31 | 0.084 | 0.793 | |||
| FH-OP (°) | 0.03 | 2.71 | 0.967 | 1.18 | 2.26 | 0.010* | 0.121 | |||
| LFH (mm) | −0.11 | 1.59 | 0.777 | 0.39 | 1.34 | 0.105 | 0.346 | |||
| Dental | U1-FH (°) | −11.00 | 4.95 | 0.000 *** | −12.68 | 3.69 | 0.000*** | 0.190 | ||
| Nper-U1 (mm) | −9.52 | 3.28 | 0.000 *** | −10.32 | 3.11 | 0.000 *** | 0.165 | |||
| L1-MP (°) | −9.42 | 2.38 | 0.000 *** | −9.16 | 2.23 | 0.000*** | 0.704 | |||
| Nper-L1 (mm) | −7.88 | 2.22 | 0.000 *** | −7.35 | 2.05 | 0.000 *** | 0.256 | |||
| IIA (°) | 23.95 | 10.83 | 0.000 *** | 22.98 | 8.20 | 0.000*** | 0.730 | |||
| OJ (mm) | −1.58 | 1.20 | 0.057 | −1.18 | 1.61 | 0.001** | 0.178 | |||
| OB (mm) | 1.08 | 1.55 | 0.007 ** | 0.71 | 1.50 | 0.018* | 0.424 | |||
| Soft tissue | SnV-UL (mm) | −2.66 | 1.61 | 0.000 *** | −2.38 | 1.43 | 0.000*** | 0.530 | ||
| SnV-LL (mm) | −4.18 | 1.96 | 0.000 *** | −4.38 | 2.70 | 0.000*** | 0.853 | |||
| SnV-Pog’ (mm) | 0.83 | 1.74 | 0.051 | −0.20 | 2.17 | 0.636 | 0.092 | |||
| Hyoid | H-RGN (mm) | −0.87 | 4.64 | 0.425 | −0.80 | 4.03 | 0.301 | 0.960 | ||
| MPH (mm) | 1.39 | 2.39 | 0.020 * | 0.50 | 2.49 | 0.209 | 0.282 | |||
| H-PTV (mm) | 0.79 | 4.02 | 0.403 | −0.05 | 3.09 | 0.932 | 0.423 | |||
| H-C3Me (mm) | 0.87 | 2.49 | 0.146 | 0.13 | 2.16 | 0.762 | 0.283 | |||
| Tongue | TGH (mm) | 1.50 | 2.55 | 0.019 * | 0.71 | 2.14 | 0.066 | 0.285 | ||
| TT-PTV (mm) | −5.00 | 3.26 | 0.000 *** | −5.02 | 3.71 | 0.000*** | 0.987 | |||
| Soft palate | SPL (mm) | 1.18 | 2.86 | 0.088 | 1.30 | 2.83 | 0.022* | 0.888 | ||
| SPI (°) | 1.89 | 2.83 | 0.009 ** | 2.48 | 1.97 | 0.000*** | 0.295 | |||
| Pharyngeal airway | PNS-Ad1 (mm) | −1.21 | 2.52 | 0.051 | 0.21 | 2.53 | 0.657 | 0.064 | ||
| PNS-Ad2 (mm) | −0.42 | 1.49 | 0.292 | 0.11 | 1.52 | 0.712 | 0.135 | |||
| SPAS (mm) | −1.95 | 1.43 | 0.000 *** | −1.96 | 0.82 | 0.000*** | 0.383 | |||
| MAS (mm) | −2.50 | 1.07 | 0.000 *** | −1.57 | 1.13 | 0.000*** | 0.007** | |||
| IAS (mm) | −2.16 | 1.65 | 0.000 *** | −1.46 | 1.29 | 0.000*** | 0.113 | |||
| VAL (mm) | 1.58 | 2.33 | 0.508 | 0.75 | 2.89 | 0.180 | 0.123 | |||
See footnote of Table 1 for the definition of measurements.
![]()
Relationship between posttreatment changes in dentoskeletal and upper airway variables (Tables 4 and 5)
Table 4
| Variable |
ΔH-RGN (mm) |
ΔMPH (mm) |
ΔH-PTV (mm) |
ΔH-C3Me (mm) |
ΔTGH (mm) |
ΔTT-PTV (mm) |
ΔSPL (mm) |
ΔSPI (°) |
ΔPNS-Ad1 (mm) | ΔPNS-Ad2 (mm) |
ΔSPAS (mm) |
ΔMAS (mm) |
ΔIAS (mm) |
ΔVAL (mm) |
|
|---|---|---|---|---|---|---|---|---|---|---|---|---|---|---|---|
| ΔSNA (°) | β | 0.03 | −0.35 | −0.36 | −0.05 | 0.26 | 0.81 | 0.20 | 0.46 | 0.32 | 0.47 | −0.20 | −0.16 | −0.23 | −0.10 |
| p | 0.960 | 0.282 | 0.434 | 0.879 | 0.395 | 0.078 | 0.594 | 0.138 | 0.358 | 0.055 | 0.170 | 0.297 | 0.237 | 0.790 | |
| ΔSNB (°) | β | 0.35 | −0.60 | 0.27 | −0.24 | 0.24 | 0.58 | −0.18 | −0.30 | 0.08 | 0.26 | 0.25 | 0.17 | 0.25 | −0.35 |
| p | 0.486 | 0.059 | 0.524 | 0.392 | 0.382 | 0.167 | 0.593 | 0.291 | 0.789 | 0.148 | 0.052 | 0.231 | 0.157 | 0.276 | |
| ΔANB (°) | β | −0.27 | 0.26 | −0.46 | 0.16 | −0.02 | 0.07 | 0.28 | 0.55 | 0.14 | 0.10 | −0.34 | −0.25 | −0.36 | 0.22 |
| p | 0.556 | 0.338 | 0.221 | 0.516 | 0.925 | 0.856 | 0.356 | 0.027* | 0.612 | 0.531 | 0.003** | 0.049* | 0.022* | 0.445 | |
| ΔNper-A (mm) | β | −0.24 | −0.33 | −0.02 | −0.07 | −0.11 | 1.25 | −0.18 | 0.22 | 0.27 | 0.52 | −0.21 | −0.14 | −0.10 | −0.31 |
| p | 0.680 | 0.321 | 0.964 | 0.835 | 0.738 | 0.007** | 0.643 | 0.503 | 0.448 | 0.109 | 0.162 | 0.375 | 0.633 | 0.405 | |
| ΔNper-B (mm) | β | 0.02 | −0.27 | 0.32 | 0.11 | 0.12 | 0.19 | −0.11 | −0.49 | 0.02 | 0.17 | 0.09 | 0.07 | 0.11 | −0.15 |
| p | 0.956 | 0.167 | 0.238 | 0.532 | 0.531 | 0.490 | 0.614 | 0.006** | 0.906 | 0.148 | 0.310 | 0.490 | 0.353 | 0.491 | |
| ΔNper-Pog (mm) | β | 0.22 | −0.14 | 0.06 | 0.12 | −0.04 | 0.16 | 0.04 | −0.58 | −0.03 | −0.12 | 0.13 | 0.14 | 0.17 | −0.26 |
| p | 0.553 | 0.505 | 0.837 | 0.548 | 0.851 | 0.599 | 0.873 | 0.003** | 0.897 | 0.367 | 0.167 | 0.168 | 0.168 | 0.255 | |
| ΔFH-MP (°) | β | −0.69 | 0.19 | −0.01 | −0.20 | −0.01 | 0.18 | 0.02 | 0.48 | −0.15 | 0.20 | −0.24 | −0.45 | −0.59 | 0.45 |
| p | 0.156 | 0.505 | 0.986 | 0.454 | 0.975 | 0.658 | 0.963 | 0.077 | 0.609 | 0.256 | 0.053 | 0.001** | 0.000*** | 0.141 | |
| ΔFH-OP (°) | β | 0.03 | 0.24 | −0.22 | 0.14 | 0.11 | 0.06 | 0.09 | 0.27 | −0.01 | 0.10 | −0.07 | 0.02 | −0.07 | 0.13 |
| p | 0.920 | 0.101 | 0.298 | 0.310 | 0.432 | 0.760 | 0.605 | 0.053 | 0.948 | 0.269 | 0.285 | 0.760 | 0.443 | 0.427 | |
| ΔLFH (mm) | β | −0.02 | −0.14 | −0.60 | −0.45 | 0.12 | 0.09 | −0.03 | 0.45 | 0.28 | 0.18 | −0.05 | −0.20 | −0.24 | 0.16 |
| p | 0.963 | 0.575 | 0.095 | 0.055 | 0.630 | 0.809 | 0.927 | 0.061 | 0.297 | 0.244 | 0.641 | 0.093 | 0.113 | 0.556 | |
| ΔNper-U1 (mm) | β | −0.02 | 0.05 | 0.10 | −0.04 | −0.01 | 0.10 | −0.07 | −0.06 | 0.11 | −0.04 | 0.02 | 0.00 | 0.00 | 0.09 |
| p | 0.898 | 0.551 | 0.424 | 0.588 | 0.918 | 0.420 | 0.489 | 0.491 | 0.231 | 0.462 | 0.647 | 0.926 | 0.949 | 0.351 | |
| ΔNper-L1 (mm) | β | 0.14 | 0.01 | 0.00 | −0.17 | −0.01 | 0.46 | −0.25 | 0.01 | 0.20 | −0.04 | −0.06 | 0.07 | 0.06 | 0.06 |
| p | 0.612 | 0.943 | 0.989 | 0.251 | 0.927 | 0.043* | 0.170 | 0.955 | 0.239 | 0.710 | 0.380 | 0.339 | 0.566 | 0.720 | |
| ΔIIA (°) | β | −0.11 | −0.07 | 0.06 | 0.01 | −0.03 | −0.05 | 0.07 | −0.03 | −0.05 | 0.04 | −0.02 | −0.03 | −0.04 | −0.04 |
| p | 0.090 | 0.079 | 0.271 | 0.764 | 0.490 | 0.360 | 0.098 | 0.468 | 0.233 | 0.103 | 0.268 | 0.100 | 0.084 | 0.342 | |
Univariable linear regression analysis was performed. Δ indicates the amount of treatment-induced change.
See footnote of Table 1 for the definition of measurements.
![]()
Table 5
| Dependent variables | Independent variable | |||
|---|---|---|---|---|
|
|
||||
| ΔFH-MP (°) | ||||
|
|
||||
| β-estimate | CI | p-value | ||
| ΔH-RGN (mm) | −0.70 | −1.80 | 0.39 | 0.202 |
| ΔMPH (mm) | 0.09 | −0.56 | 0.73 | 0.791 |
| ΔH-PTV (mm) | 0.27 | −0.63 | 1.17 | 0.553 |
| ΔH-C3Me (mm) | −0.35 | −0.95 | 0.25 | 0.246 |
| ΔTGH (mm) | 0.00 | −0.61 | 0.62 | 0.990 |
| ΔTT-PTV (mm) | 0.18 | −0.74 | 1.11 | 0.689 |
| ΔSPL (mm) | −0.15 | −0.88 | 0.58 | 0.683 |
| ΔSPI (°) | 0.27 | −0.32 | 0.85 | 0.363 |
| ΔPNS-Ad1 (mm) | −0.28 | −0.96 | 0.40 | 0.411 |
| ΔPNS-Ad2 (mm) | 0.19 | −0.21 | 0.58 | 0.344 |
| ΔSPAS (mm) | −0.10 | −0.36 | 0.16 | 0.443 |
| ΔMAS (mm) | −0.42 | −0.69 | −0.14 | 0.004** |
| ΔIAS (mm) | −0.52 | −0.85 | −0.19 | 0.003** |
| ΔVAL (mm) | 0.44 | −0.26 | 1.13 | 0.211 |
Multivariable linear regression analysis was performed using the mandibular plane angle (FH-MP) change as an independent variable adjusted for the ANB angle. Δ indicates the amount of treatment change.
See footnote of Table 1 for the definition of measurements.
![]()
DISCUSSION
CONCLUSION
The BSP patients showed significant reductions in the velopharyngeal and glossopharyngeal airway spaces after extraction treatment; however the reduced posttreatment dimensions corresponded to the normal dimensions in the control samples.
The glossopharyngeal space might be susceptible after treatment in the hyperdivergent BSP group, especially when the mandibular plane angle is increased during treatment.
Control of the vertical dimensions during maximum anterior retraction would be important to achieve both esthetic and respiratory functional improvements in BSP patients.
 XML Download