

 PDF
PDF Citation
 Print
Print


INTRODUCTION
Far-infrared rays (FIR) are electromagnetic waves ranging between 3 and 100 μm that hold the ability to penetrate up to 2.5 cm into the skin, affecting muscles, as well as blood and lymph vessels, owing to their radiation and vibration frequency. FIR have a vibrational frequency of 3–100 THz that transfers to atoms and molecular structures [1] and, importantly, can induce a muscle wound healing effect [2,3]. A previous work confirmed that FIR can enhance mitochondrial copy number, oxygen consumption, as well as genes related to apoptosis and mitophagy in rat muscle tissues [4]. These results suggest that FIR activates the PINK1-mediated mitochondrial quality control pathway and mitochondrial biogenesis, which consequently increases the efficiency of oxidative respiration in skeletal muscle. However, the effects of FIR on mitochondrial morphology and membrane potential remain to be validated, and the precise mechanism of FIR-mediated upregulation of mitochondrial function is unclear.
Mitochondria are cellular organelles present in high numbers in the brain, liver, heart, and muscles. They use glucose and fatty acids to synthesize ATP as an energy source for cellular function [5]. Mitochondrial dysfunction is implicated in cardiovascular disease, aging, metabolic disease, cancer, and degenerative diseases [6,7]. Indeed, diabetes is closely related to increased reactive oxygen species production, which is directly responsible for mitochondrial dysfunction, and is one of the key factors underlying the pathological mechanism of diabetic synovial stenosis [8]. Type 2 diabetes mellitus is a condition characterized by metabolic imbalance associated with impaired mitochondrial ATP levels [9]. Due to the close relationship with energy-consuming diseases, research on the development of targeted therapeutics that can directly control mitochondrial function is being actively conducted [10,11].
Glucose transport across the plasma membrane is fundamental to mammalian energy metabolism and is mediated by tissue-specific glucose transporter proteins in the cell membrane [12]. Several studies have highlighted the expression of multiple glucose transporters in the same tissue for regulation of glucose and energy homeostasis [13]. Two main types of glucose carriers exist, namely sodium-glucose linked transporters and glucose transporters (GLUTs). Based on sequence similarity, GLUT proteins are classified into Class 1, comprising the well-characterized glucose transporters (GLUT1–4, 14), Class 2 (GLUT5, 7, 9, 11), and Class 3 (GLUT6, 8, 10, 12, 13) [14,15]. Of the many glucose transporters, GLUT1, GLUT3, and GLUT4 are expressed in rat L6 skeletal muscle cells [16], a cell line that retains many properties of skeletal muscle [17,18]. In cells such as muscle, the transport of glucose across the plasma membrane limits its availability [19,20]. Recent research showed that reduced mitochondrial ATP production due to insulin resistance in skeletal muscle is accompanied by a functional reduction in Class 1 GLUTs [14]. Thus, it has been suggested that GLUTs are closely related to changes in mitochondrial function.
The purpose of this study was to demonstrate whether FIR could increase intracellular transport of glucose and promote mitochondrial energy metabolism, thereby improving intracellular glucose deficiency conditions such as occurs in type 2 diabetes, resulting in therapeutic effects.
METHODS
FIR fabric
The FIR fabric samples were provided by Ventex Co. (Seoul, Korea). The bio-active materials coated fabric (BMCF) contained over 30 kinds of minerals, including SiO2, Mg, Al2O3, Na, Ca, and Fe2O3. The fabric was irradiated with FIR and the Korea Far-Infrared Association (Seoul, Korea) confirmed that the emission rate between 5 and 20 µm was 89.5%. The emission energy was 3.45 × 10² W/m2 · µm (issue number KFI-789) at 37°C. In the current study, we used BMCF that emitted 0% and 30% FIR. No abnormal skin reactions of any kind were observed during the safety evaluation of the BMCF.
Cells
Rat skeletal muscle L6 cells were purchased from the Korean Cell Line Bank (Seoul, Korea) and cultured in Dulbecco's modified Eagle medium (DMEM) supplemented with 25 or 5.5 mM glucose (L001-05 or L001-02; WELGENE, Gyeongsan, Korea), and containing 10% fetal bovine serum and 1% penicillin/streptomycin [21,22]. The cells were used between passage 29 and 33. For FIR radiation conditions, 0% and 30% BMCF was attached inside the culture dish at a distance of 1 cm from the cells [23], followed by incubation at 37°C in 5% CO2 for 24 and 72 h. The experimental design is shown in Supplementary Fig. 1.
GLUT3 siRNA treatment
L6 cells were cultured and left to stabilize in DMEM plus 25 mM glucose for 24 h, before sub-culturing in 5.5 mM glucose medium. GLUT3 siRNA (Slc2q3-rat-282; GenePharma, Shanghai, China) was then administered together with INTERFERin transfection reagent (Polyplus Transfection Inc., Strasbourg, France) at a final concentration of 10 nM siRNA.
Quantitative real-time polymerase chain reaction (qRT-PCR)
mRNA expression and mitochondrial DNA copy number (mtDNA-CN) were measured using the Fast Start DNA Master SYBR Green I kit and the LightCycler 2.0 system (Roche, Basel, Switzerland). All primers used for qPCR analysis are described in Supplementary Table 1. Gapdh was used as the internal control. For mtDNA-CN assessment, the expression of the mitochondrial displacement loop (D-loop) in total genomic DNA was also corrected for based on Gapdh levels. Each reaction mixture contained 0.8 µl MgCl2 (final concentration: 3 mM), 0.2 µl of each forward and reverse primer (final concentration: 0.2 µM), 1 µl of 10× LightCycler DNA Master SYBR Green I, and 1 µl cDNA template in a final volume of 10 µl in distilled water. mRNA expression was determined based on Ct values using the 2−ΔΔCt reference method [24].
Reverse transcription PCR (RT-PCR)
Pgc-1a mRNA expression was measured using the AccuPower Taq PCR Premix (Bioneer, Deajeon, Korea) and a C1000 Thermal Cycler (Bio-Rad, Hercules, CA, USA). Gapdh was used as the internal control. The primers used for RT-PCR are described in Supplementary Table 1. The reaction mixture contained 1 U Taq DNA polymerase, 250 µM dNTPs, 1× reaction buffer (with 1.5 mM MgCl2), 0.2 µl of each forward and reverse primer (final concentration: 0.2 µM), and 1 µl template cDNA.
Mitochondrial oxygen consumption
Mitochondrial oxygen consumption was measured according to the method described by Frezza et al. [25]. Measurement of the respiratory control rates was performed in a solution containing 20 mM ADP, 5 mM glutamate, 2.5 mM malate, and MIR05 buffer (0.5 mM EGTA, 3 mM MgCl2-6H2O, 60 mM K-lactobionate, 20 mM taurine, 10 mM KH2PO4, 20 mM HEPES, 110 mM sucrose, 1 g/L BSA, pH 7.1). Oxygen consumption was carried out in a NeoFox chamber and was monitored with NeoFox viewer software v. 2.30 (Ocean Optics Inc., Dunedin, FL, USA). The respiratory control ratio (RCR) was calculated according to the oxygen consumption values in the presence (state 3) and absence (state 4) of ADP [26].
ΔΨm and mitochondrial mass measurement
ΔΨm was measured using tetramethylrhodamine ethyl ester (TMRE; excitation/emission = 549/574 nm; Abcam, Cambridge, UK). L6 cells were treated with TMRE at a final concentration of 100 nM and allowed to react at 37°C for 30 min to induce TMER accumulation in the mitochondria [27]. To measure mitochondrial mass, cells were stained with acridine orange 10-nonyl bromide (NAO; Invitrogen, Waltham, MA, USA) at a final concentration of 2.5 µM in phosphate-buffered saline (PBS) solution [28], incubated in the dark at 37°C for 30 min, and then washed twice with PBS. TMRE and NAO fluorescence for each group were observed under an LSM 700 confocal microscope (Carl-Zeiss, Oberkochen, Germany). Mitochondrial mass measurements were performed at an excitation wavelength of 488 nm, and the emission of NAO was measured beyond 585 nm. The TMRE and NAO mean intensity of the region of interest (ROI) were measured in each cell and analyzed by Image J software (NIH, Bethesda, MD, USA) [29].
Statistical analysis
All collected data were analyzed using IBM SPSS Statistics v. 20.0 (IBM Corp., Armonk, NY, USA). Statistical significance was determined using the Student's t-test and one-way and two-way ANOVA. A p-value < 0.05 was considered statistically significant. The Student's t-test was used to evaluate mRNA relative expression, mtDNA-CN relative ratio, and RCR/mtDNA-CN ratio data. The one-way and two-way ANOVA were used for assessing TMRE and NAO fluorescence intensity per cell area ratio data.
RESULTS
GO pathways related to glucose transport and regulation are stimulated by FIR in rat skeletal muscle
Microarray data extracted from a previous study [23] were assembled for GO map analysis. We confirmed that pathways related to glucose transport and regulation were stimulated by FIR in rat skeletal muscle (Fig. 1). Response to glucose (GO:0009749, p < 0.001), regulation of glucose transport (GO:0010827, p < 0.01), glucose transport (GO:0015758, p < 0.05), positive regulation of glucose transport (GO:0010828, p < 0.05), regulation of glucose import (GO:0046324, p < 0.05), glucose import (GO:0046323, p = 0.057), cellular response to glucose stimulus (GO:0071333), cellular glucose homeostasis (GO:0001678), positive regulation of glucose import (GO:0046326), glucose metabolic process (GO:0006006), glucose homeostasis (GO:0042593), and regulation of glucose metabolic process (GO:0010906) were all activated by FIR. These results confirm that FIR hold potential to affect glucose metabolism.
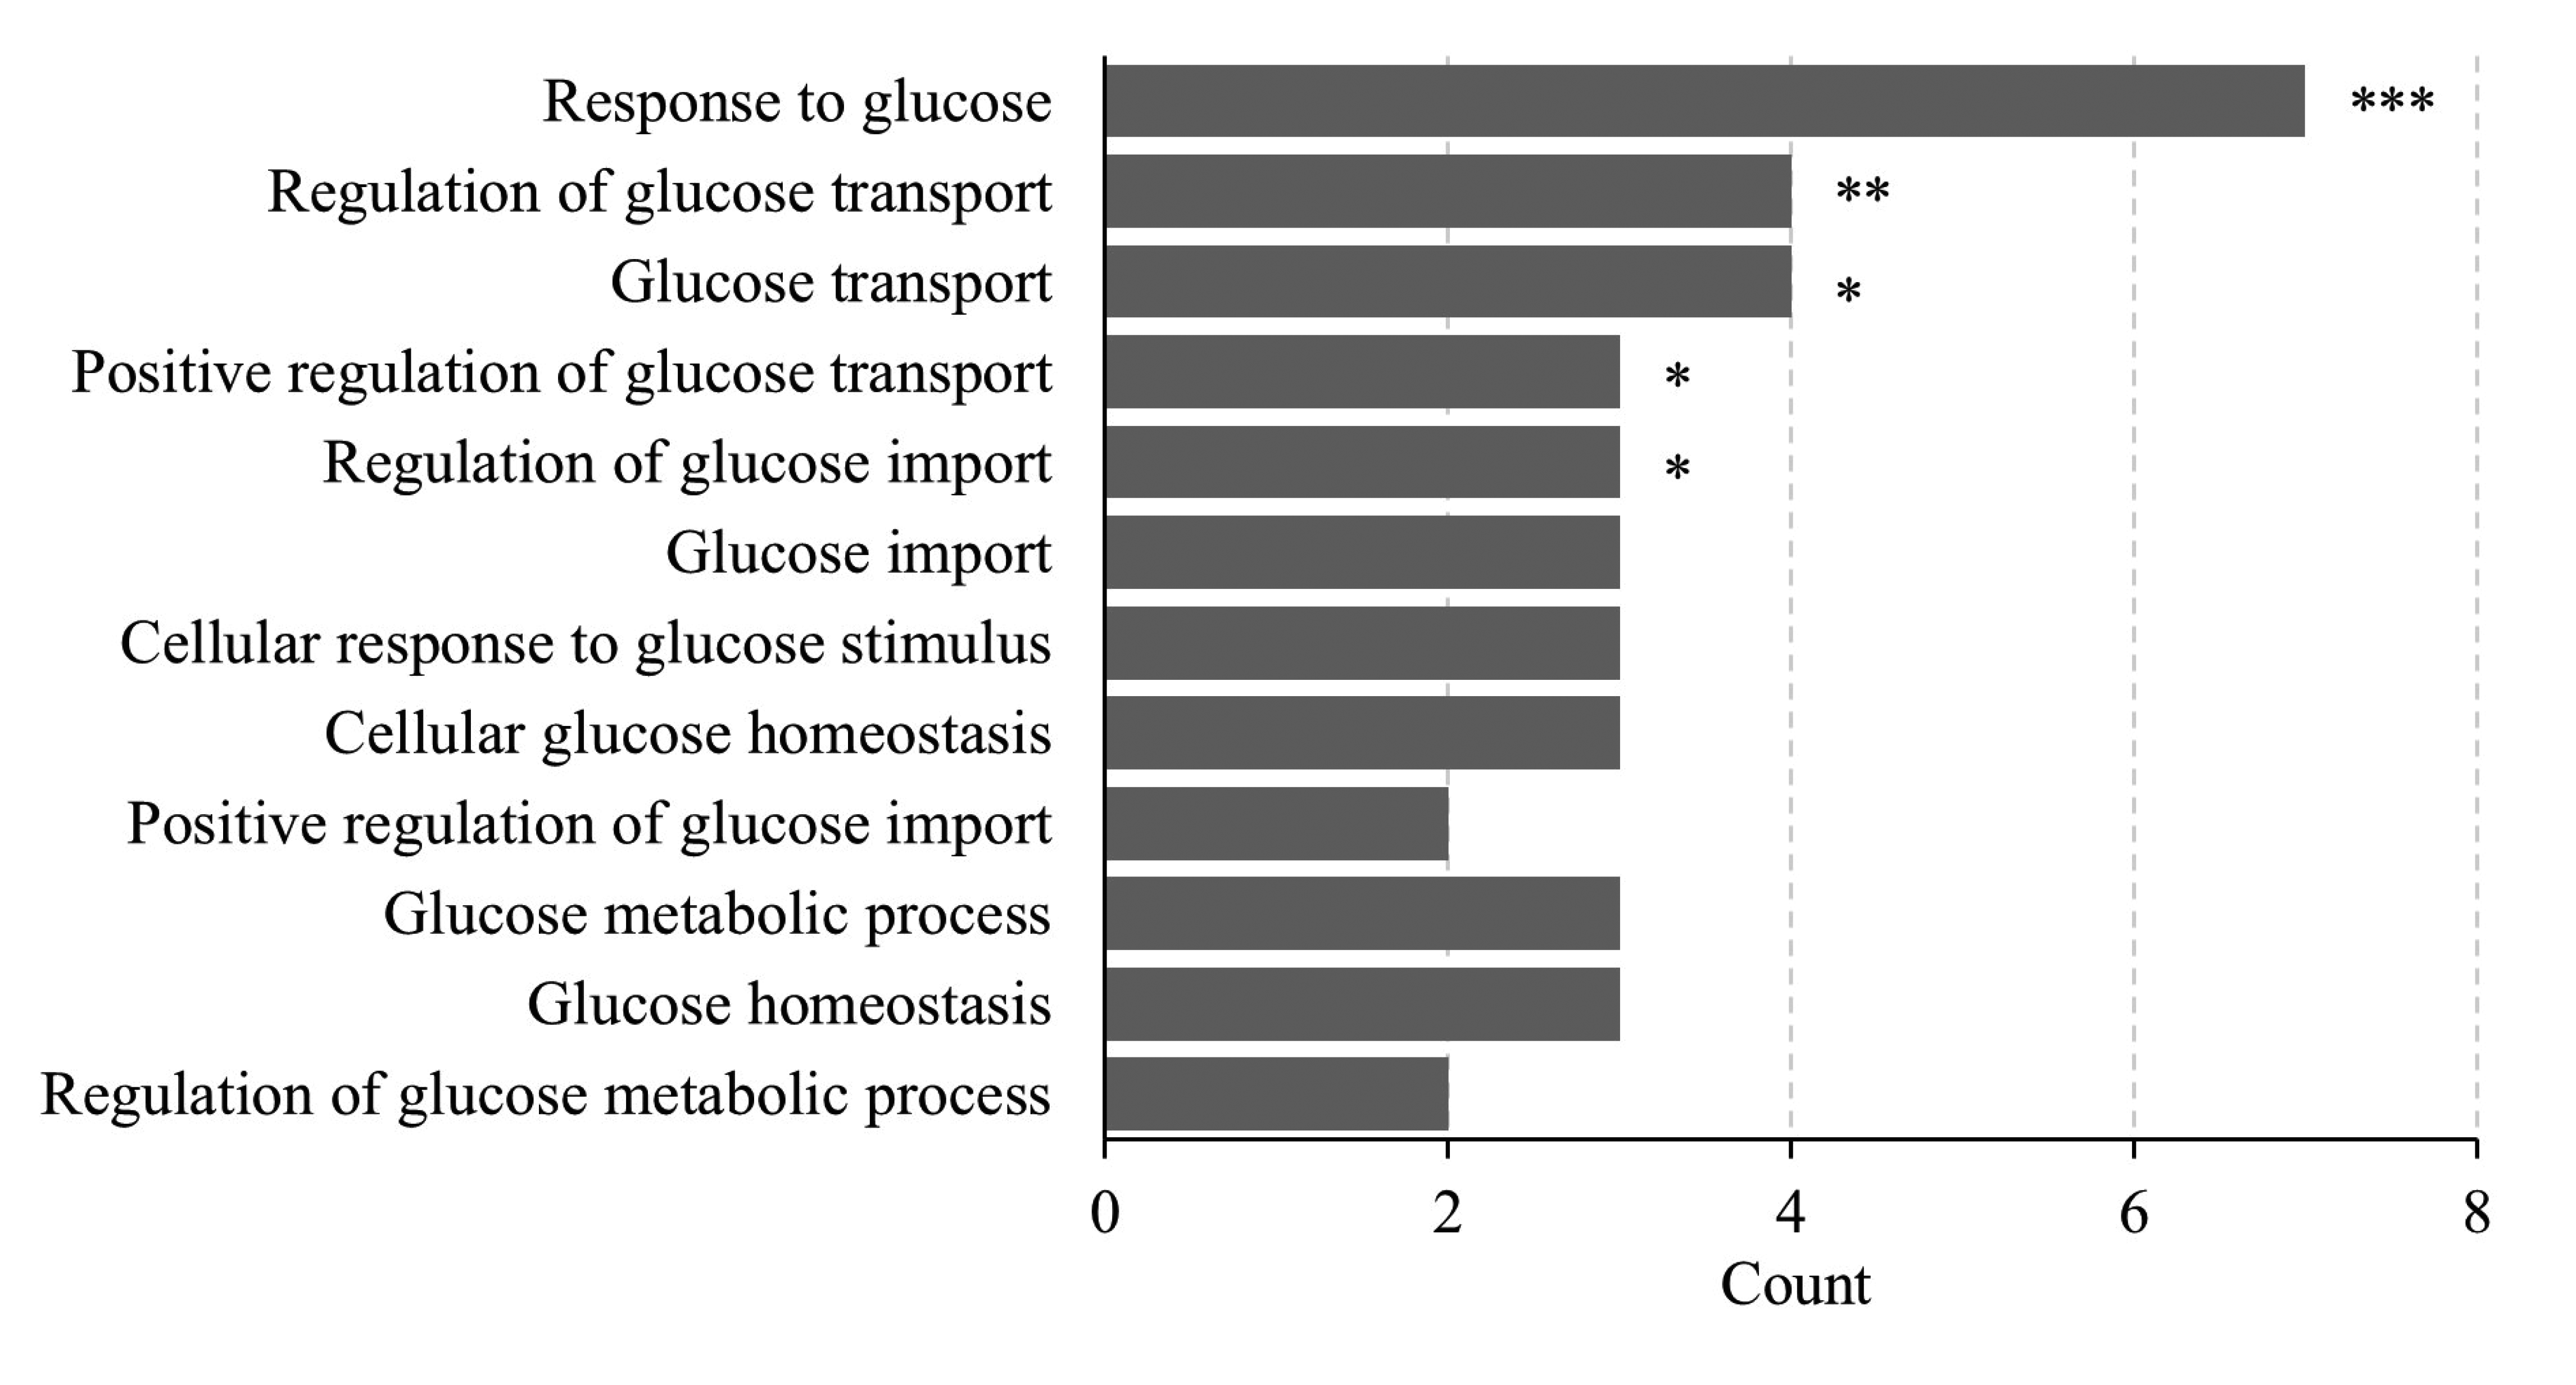
Fig. 1
Gene ontology (GO) enrichment analysis.
The bar graph indicates the number of differently expressed genes in GO terms associated with glucose from bio-active materials coated fabric-worn rat skeletal muscle. The nine GO biological process terms ranked with the highest p-value are shown. GO functional analysis was based on gomap stat. *p < 0.05, **p < 0.01, ***p < 0.001 vs. control group.
![]()
FIR regulates GLUT3 expression in L6 cells under low glucose conditions
To assess the effect of FIR on glucose metabolism, L6 cells were exposed to BMCF for 24 h under 25 and 5.5 mM glucose conditions. Interestingly, genes related to glucose metabolism identified in the microarray data (Table 1) were found to be altered in the in vitro assay. Among these, a 2.0-fold significant increase was only observed in the expression of GLUT3 (also known as Slc2a3) in the presence of 30% BMCF and 5.5 mM glucose compared with that of the non-treated group (p < 0.05, Fig. 2B). No significant differences were observed in the expression levels of other genes related to glucose metabolism, such as G6pd, Ugdh, Uggt2, Slc2a5, Slc2a10, Slc35d2, Slc37a2, RGD1559971, Slc2a13, Soga1, Gfod2, Gdpgp1, Slc2a9, Slc2a12, Tgds, Ugcg, Gpi, Naglt1, Uggt1, Slc2a8, RGD1304770, Slc2a7, Ugp2, H6pd, Slc37a4, Slc5a2, G6pc, RGD1563815, RGD1561777, Slc2a6, G6pc3, Slc5a1, Slc5a4, Slc37a1, and Gfod1 (data not shown).
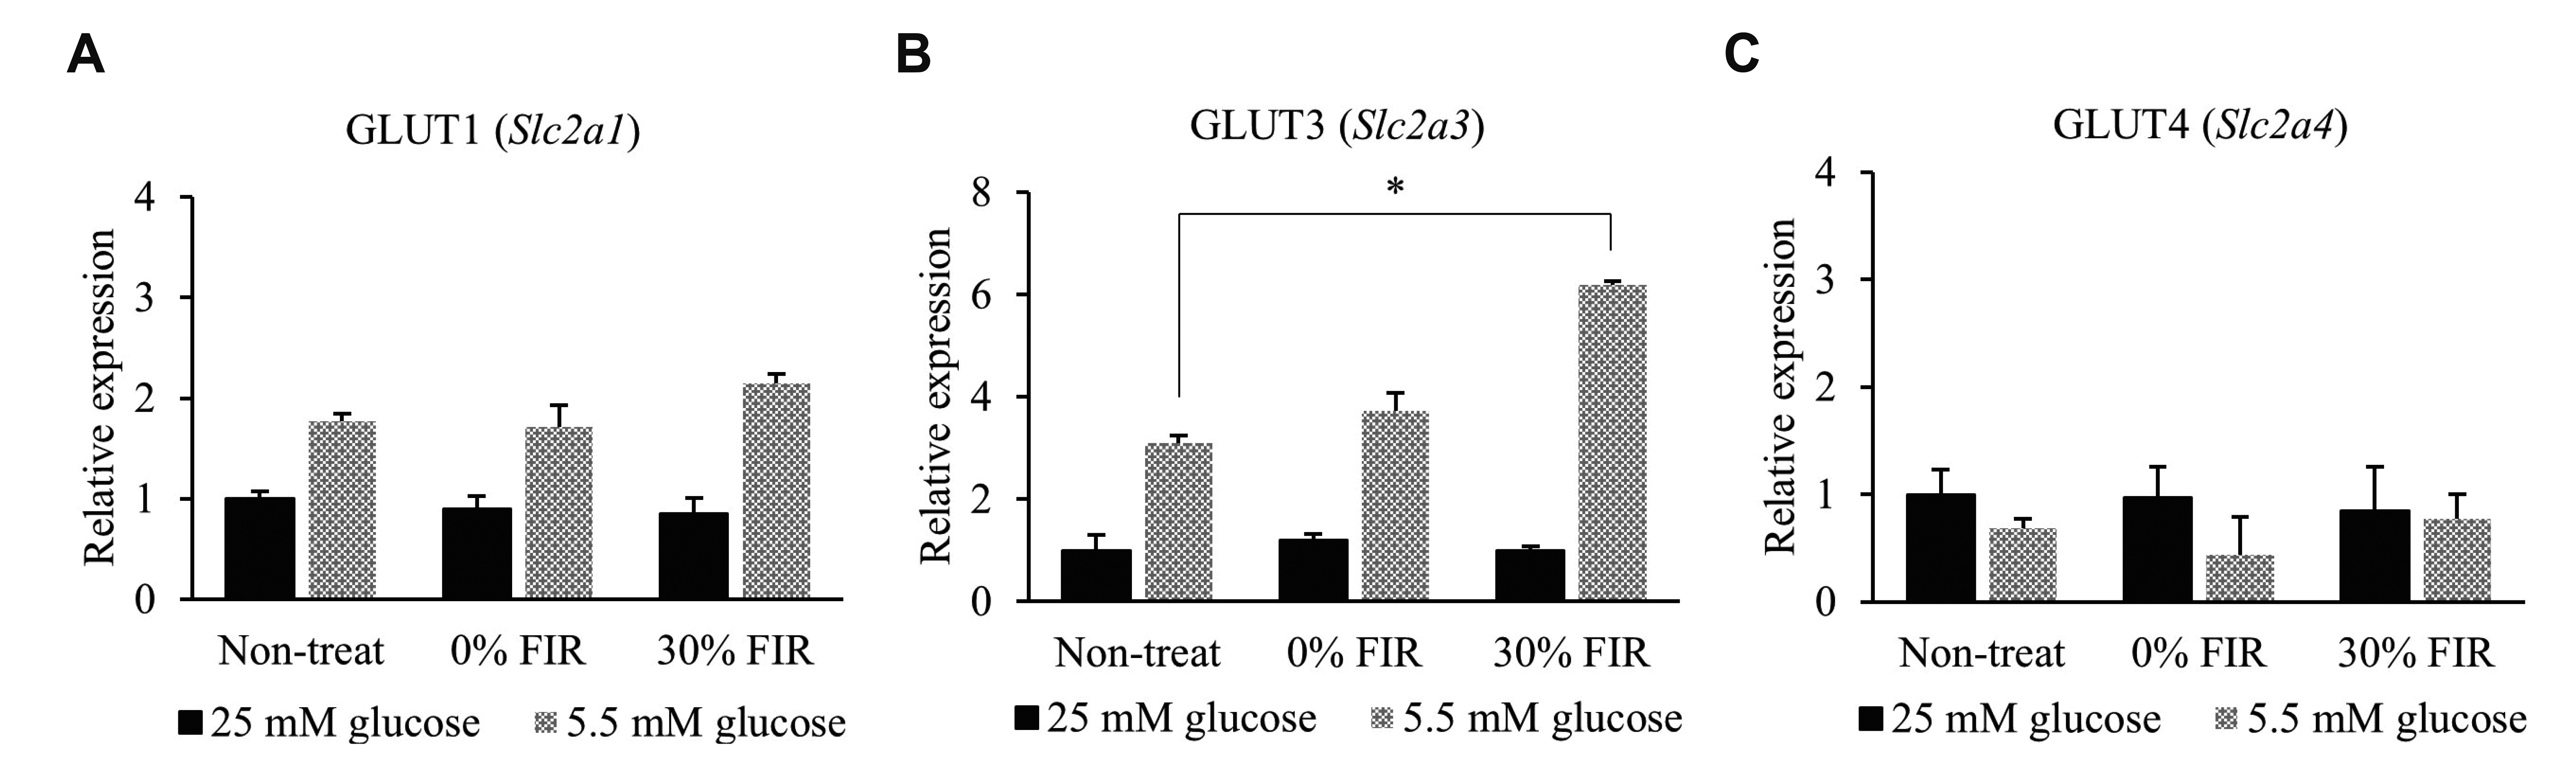
Fig. 2
Far-infrared rays (FIR) alter the mRNA expression of glucose transporter class 1 members.
(A) GLUT1 (Slc2a1) (B) GLUT3 (Slc2a3), and (C) GLUT4 (Slcea4) expression was analyzed under 25 and 5.5 mM glucose conditions, and upon bio-active materials coated fabric treatment for 24 h by quantitative real-time polymerase chain reaction. *p < 0.05 vs. control group.
![]()
Table 1
List of glucose transport-related genes from microarray data of BMCF-worn rat skeletal muscle
![]()
Given the observed increase in GLUT3 expression by 30% BMCF under low glucose conditions, the expression of GLUT1, 2, and, 4 were also evaluated in a similar experimental setting. GLUT1 expression increased 1.7-fold in the presence of 5.5 mM glucose compared to that of the 25 mM glucose condition, but no significant change in its expression was observed following 30% BMCF (Fig. 2A). In addition, no significant difference was observed in GLUT4 expression between 25 and 5.5 mM glucose conditions following treatment with 30% BMCF (Fig. 2C). GLUT2 levels in L6 cells were very low and thus could not be compared for each glucose condition following BMCF treatment (data not shown).
FIR improve mitochondrial biogenesis
Changes in the mtDNA-CN in L6 cells following incubation with 25 or 5.5 mM glucose plus BMCF treatment for 24 h were assessed. The mtDNA-CN increased 1.7- and 1.3-fold in the 25 and 5.5 mM glucose conditions (p < 0.05), respectively, compared to the non-treated control (Fig. 3A). Next, changes in mitochondrial oxygen consumption in relation to the change in mtDNA-CN were determined to evaluate mitochondrial ATP production ability. The results indicated a 1.2- and 1.5-fold increase in ATP production ability of mitochondria under 30% BMCF and 25 and 5.5 mM glucose conditions (p < 0.05 and p < 0.01), respectively, compared to the non-treated control (Fig. 3B). In addition, TMRE fluorescence tended to increase upon treatment with 30% BMCF (Fig. 3C). In particular, by analyzing the TMRE fluorescence intensity ROI, the ΔΨm was found to be significantly increased by 3.4-fold following 30% BMCF compared to the non-treated control (p < 0.001, Fig. 3D). However, no significant differences in Pgc-1a expression were observed in the 5.5 mM glucose and 30% BMCF compared to the non-treated control (Fig. 3E).
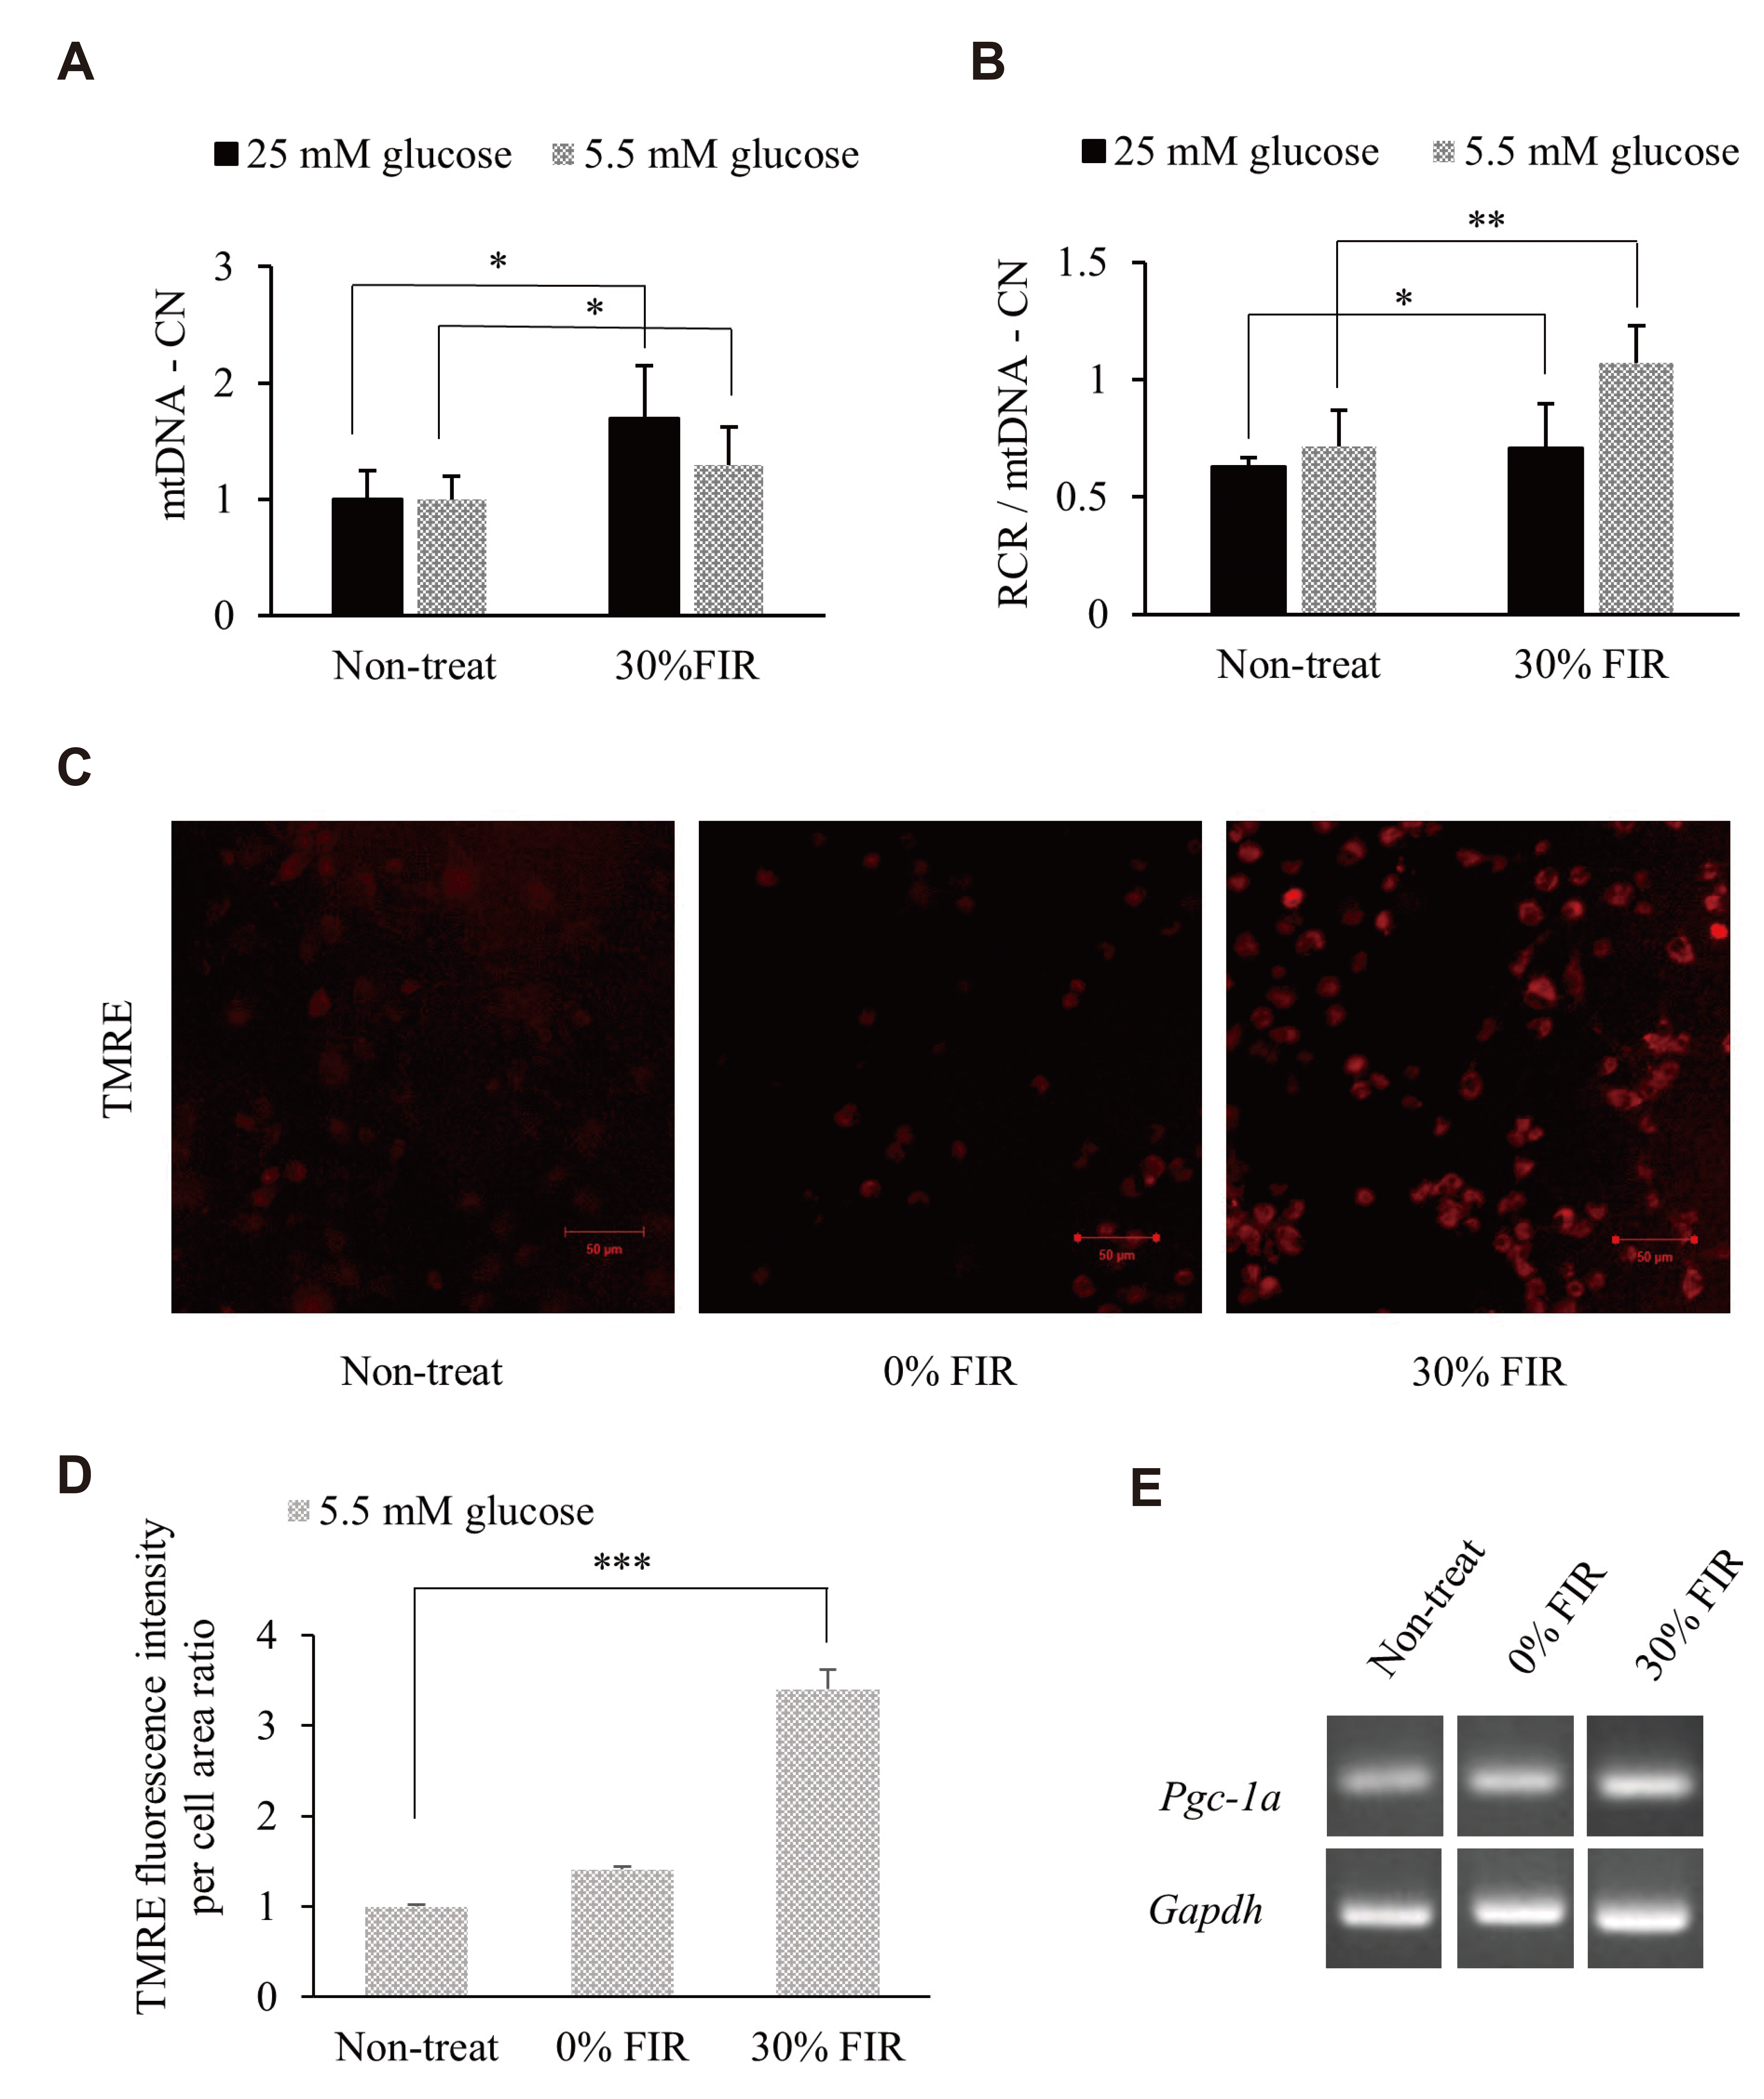
Fig. 3
Far-infrared rays (FIR) effectively activate mitochondrial biogenesis.
Changes in (A) mitochondrial DNA copy number (mtDNA-CN) and (B) respiratory control ratio (RCR) per mtDNA-CN ratio under 25 mM and 5.5 mM glucose conditions. (C) Mitochondrial membrane potential (ΔΨm) was determined by measuring TMRE (tetramethylrhodamine, ethyl ester) fluorescence under 5.5 mM glucose conditions by confocal microscopy (scale bar = 50 μm). (D) TMRE region of interest fluorescence intensity per cell area ratio measurement using Image J. (E) Pgc-1a expression was analyzed by reverse transcription polymerase chain reaction. *p < 0.05, **p < 0.01, ***p < 0.001 vs. control group.
![]()
Activation of mitochondrial biogenesis by FIR is more pronounced in the presence of GLUT3
The correlation between increased GLUT3 expression and the improvement in mitochondrial biogenesis under 5.5 mM glucose and FIR treatment was evaluated through gene silencing of GLUT3. The normal control (without siRNA) and GLUT3 siRNA groups were treated with FIR fabric for 72 h, as GLUT3 silencing was not confirmed until 72 h (data not shown); TMRE and NAO fluorescence intensity increased in both groups (Fig. 4A, B). Moreover, the ROI calculation of TMRE confirmed that the normal GLUT3 control cells exhibited a 4.2-fold higher fluorescence intensity compared with that of the non-treated group following 72 h of 30% BMCF treatment (p < 0.001), while cells silenced GLUT3 showed a 3.0-fold increase in TMRE intensity (p < 0.001, Fig. 4C). The ROI calculation of NAO further confirmed that the control cells exhibited higher fluorescence intensity than that of the non-treated group following 72 h of 30% BMCF (5.7-fold increase, p < 0.001), and the GLUT3 siRNA group showed a 3.6-fold increase (p < 0.001). Overall, in 30% BMCF conditions, the TMRE and NAO intensity of L6 cells reduced GLUT3 decreased 1.4-fold (p = 0.056) and 1.6-fold (p < 0.01), respectively, compared to that of the control group (Fig. 4D). In addition, Pgc-1a expression increased following 30% BMCF treatment in both the control and GLUT3 siRNA groups (Fig. 4E).
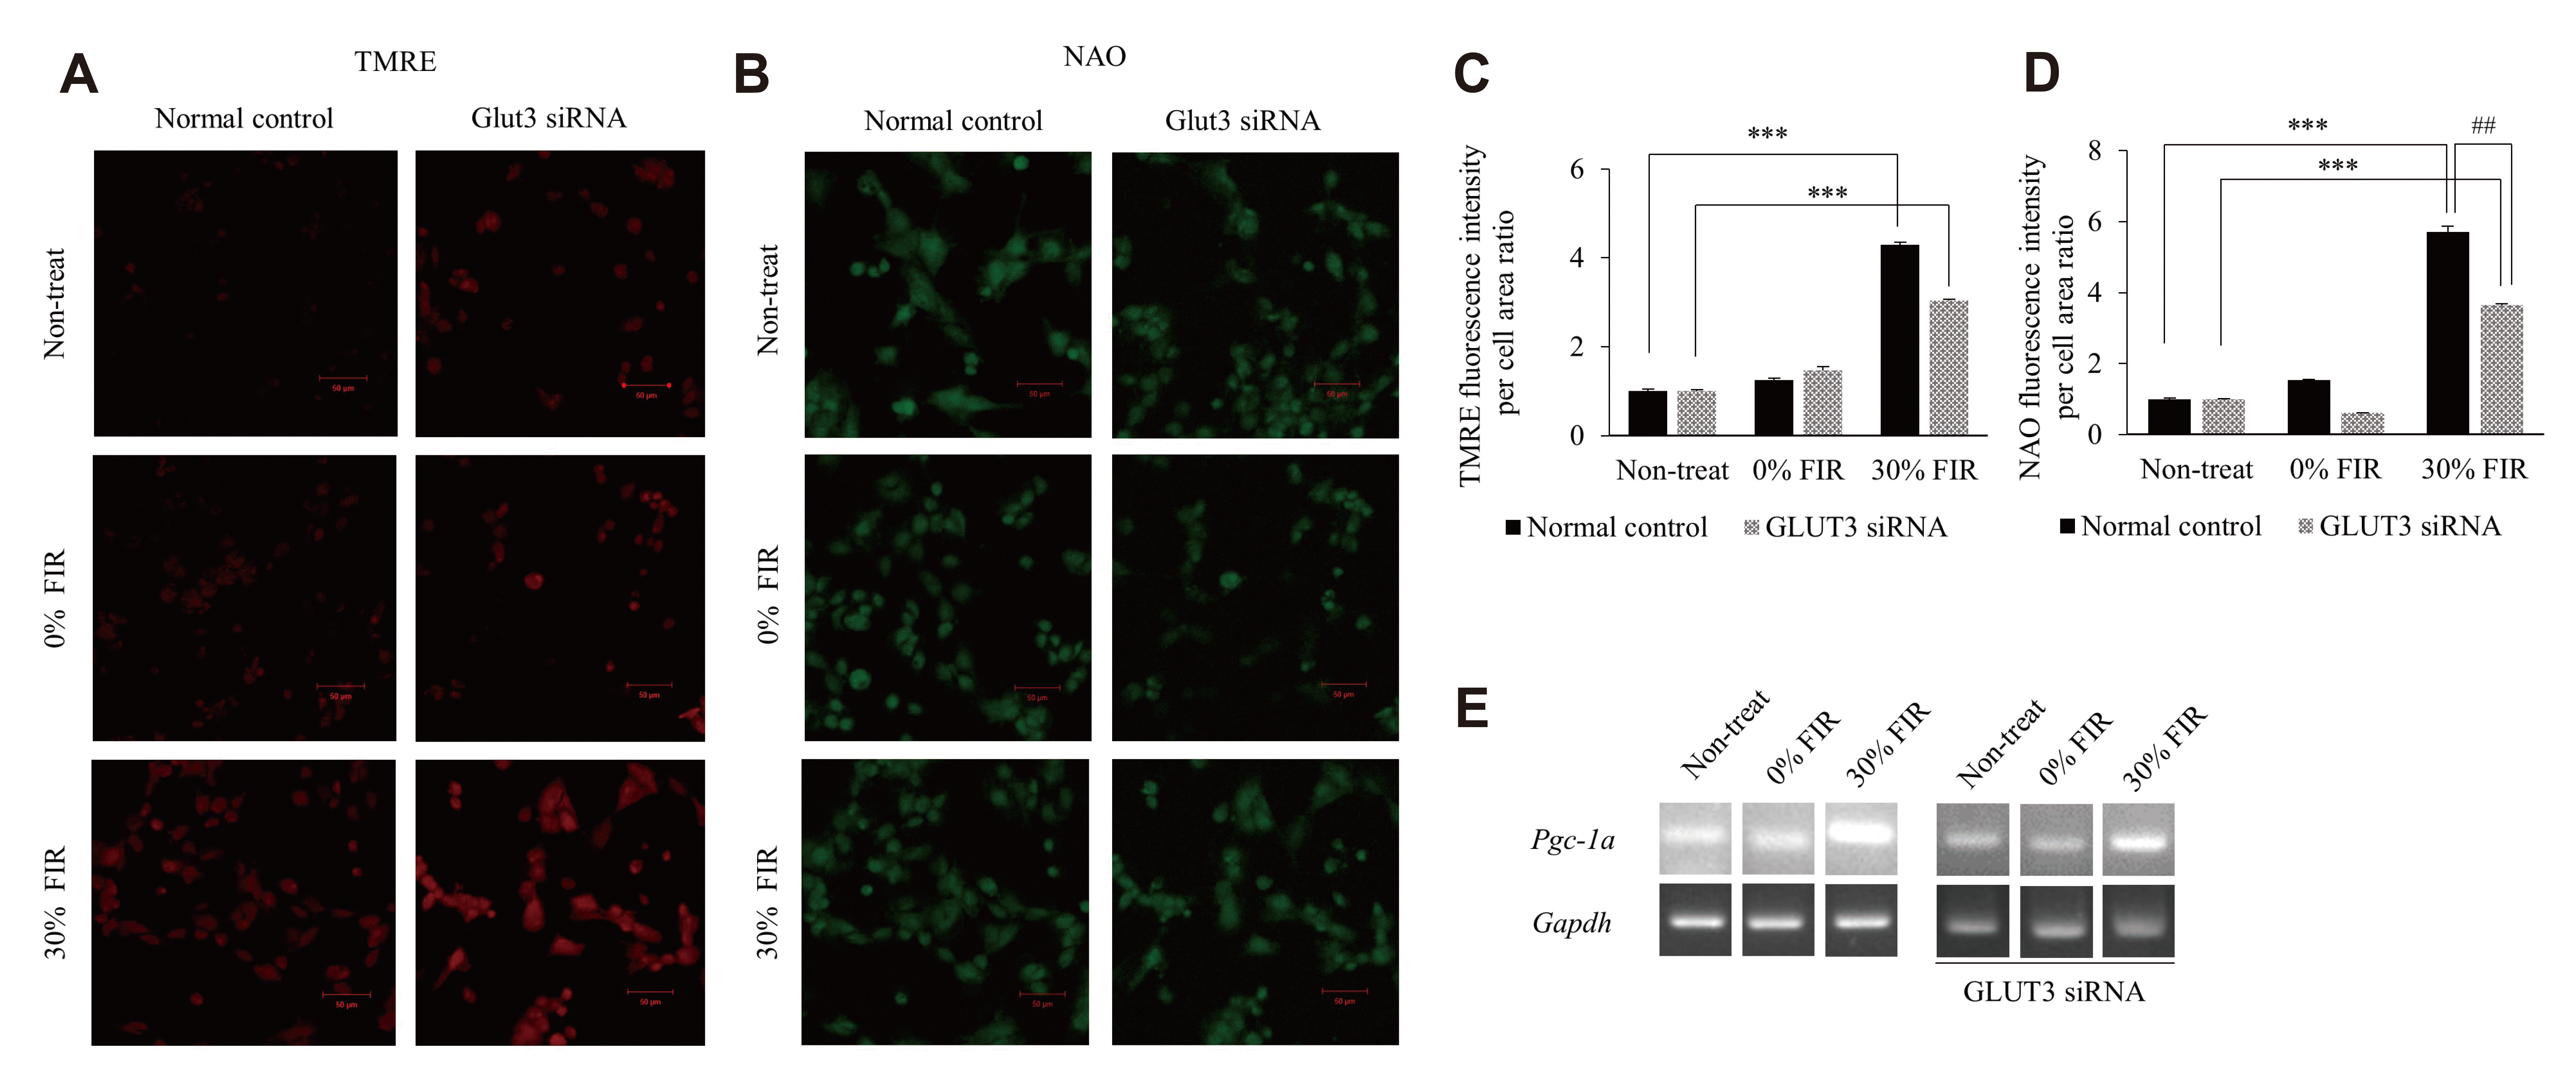
Fig. 4
Far-infrared rays (FIR) activate mitochondrial biogenesis at low glucose concentrations via GLUT3.
The control and GLUT3 siRNA groups were treated with bio-active materials coated fabric for 72 h under 25 or 5.5 mM glucose conditions. (A) Mitochondrial membrane potential (ΔΨm) as determined by TMRE (tetramethylrhodamine, ethyl ester) fluorescence and (B) confirmation of mitochondrial mass by measurements of NAO (acridine orange 10-nonyl bromide) fluorescence using confocal microscopy (scale bar = 50 μm). (C) TMRE and (D) NAO region of interest fluorescence intensity per cell area ratio. (E) Pgc-1a expression was performed by reverse transcription polymerase chain reaction. ***p < 0.001 vs. control group; ##p < 0.01 vs. experimental group.
![]()
DISCUSSION
Here, we aimed to assess changes in glucose transporter expression and mitochondrial biogenesis following exposure to FIR under high and low glucose levels. In fact, 5.5 mM glucose is usually considered a normal glucose serum concentration and corresponds with a low glucose culture medium in vitro. A glucose concentration of 20 mM in vitro corresponds with a high glucose culture medium and is comparable to a hyperglycemic environment that can be found in vivo, notably in diabetic patients [22]. In summary, GLUT3 expression was significantly increased by treatment with BMCF for 24 h at low glucose levels. Further, the ratio of the mitochondrial function index RCR per mtDNA-CN also increased significantly, as well as the ΔΨm. In addition, Pgc-1a expression increased following 30% BMCF treatment for 72 h. Taken together, these results demonstrate that FIR effectively activate mitochondrial biogenesis and GLUT3 expression at low glucose concentrations.
In our previous study, microarray analysis revealed that mRNA expression in rat muscle cells was stimulated by FIR radiation in a dose-dependent manner at 10% and 30% BMCF [23]. Additional analysis of genetic data through GO analysis confirmed the possibility that FIR could affect glucose metabolism (Fig. 1). The present study explored further the impact of FIR on the expression of genes associated with glucose metabolism under high and low glucose conditions in rat skeletal muscle cells (L6). The expression of GLUT3, which is abundant in neurons and is known to transport glucose into cells under hypoglycemic or ischemic conditions [30], tended to increase under 5.5 mM glucose conditions compared with that under 25 mM glucose. In addition, GLUT3 expression was significantly increased (2.0-fold) upon FIR treatment compared with that of the non-treated group (Fig. 2B). GLUT1 [31] is widely distributed in red blood cells and the heart, where it facilitates glucose transport into cells independently of an insulin signal [32]. The expression of GLUT1 in this study showed a tendency to increase in response to 5.5 mM glucose compared that at 25 mM as seen for GLUT3, but no change in expression was observed following 30% BMCF treatment (Fig. 2A). In addition, the expression of GLUT4, which is abundant in muscle and adipocytes where it transports glucose in response to insulin [32,33], was not significantly different between the two concentrations of glucose tested nor following 30% BMCF treatment (Fig. 2C). Given the importance of GLUT3 in neurons [34] and muscle development [35], it is important to characterize the mechanisms that regulate its expression. These observations suggest that FIR specifically stimulate the expression of GLUT3, the product of which transports glucose into cells at low glucose concentrations, independent of insulin. In L6 myotubles, insulin stimulates glucose transport through translocation of the glucose transporters GLUT1, GLUT3, and GLUT4 from intracellular stores to the plasma membrane [36]. It has been proposed that GLUT3 may play an important role in glucose metabolism in muscle development [16]. Preliminary reports of GLUT expression in muscle biopsies from insulin-resistant subjects showed that GLUT-3 mRNA was low and GLUT-1 mRNA was increased compared with that of normal control subjects [37]. These data suggest that glucose transporter content may be an important correlate of insulin responsiveness. Therefore, the results of this study suggest that FIR stimulation may provide therapeutic improvement in a cellular environment where glucose supply is insufficient (e.g., type 2 diabetes).
Our previous study demonstrated that FIR activate mitophagy and improve mitochondrial oxidative respiration based on mtDNA-CN and RCR [4]. Herein, it was confirmed that both parameters increased under high and low glucose conditions following FIR treatment compared to non-treated controls (Fig. 3A, B). Determining mitochondrial ATP production and the ΔΨm allows for an assessment of the functional state of mitochondria [26,38,39]. The RCR per mtDNA-CN ratio increased significantly (p < 0.05), as well as the ΔΨm, following 30% BMCF treatment under 5.5 mM glucose when compared with that of 25 mM glucose (Fig. 3B–D). The change in ΔΨm and mass is related to mitochondrial energy metabolism activity and/or mitochondrial biogenesis. Biogenesis of mitochondria, particularly under stress conditions, is often reflected by an increase in their mass [40]. Genetic down-modulation of GLUT3 expression through siRNA confirmed that TMRE and NAO decreased when GLUT3 was reduced (Fig. 4A–D), demonstrating that the FIR effect on skeletal muscle cells persisted even after 72 h, and that ΔΨm and mitochondrial mass were reduced upon GLUT3 loss. PGC-1a is the master regulator linking external physiological stimuli and the regulation of mitochondrial viability [41], functioning as a good indicator of mitochondrial biogenesis. Of note, no significant change was observed in the expression of Pgc-1a following 30% BMCF for 24 h (Fig. 3E), whereas it was increased in both the control and the GLUT3 knock-down cells following 30% BMCF for 72 h (Fig. 4E). Thus, these findings suggest that the upregulation of mitochondrial energy metabolism by FIR is greater after 72 h at low glucose levels and that GLUT3 is associated with mitochondrial biogenesis. Several studies have shown that the occurrence of diabetes is closely related to mitochondrial dysfunction [42,43]. Mitochondrial biogenesis plays an important role in maintaining mitochondrial numbers, cell renewal, adapting to cell damage, and the demand for energy supply [44]. Thus, the results of these experiments suggest that FIR can promote mitochondrial biosynthesis in a low glucose environment.
Altogether, this study highlights the therapeutic potential of FIR for the treatment of cellular insulin resistance, which leads to glucose deficiency and conditions such as degenerative disease or type 2 diabetes, potentially owing to decreased mitochondrial function. Additional studies are warranted to explore the exact transport pathway and the stimulatory mechanism of glucose involved in FIR-mediated improvement of mitochondrial biogenesis at low glucose conditions.
SUPPLEMENTARY MATERIALS
Supplementary data including one table and one figure can be found with this article online at https://doi.org/10.4196/kjpp.2021.25.2.167.
 XML Download