

 PDF
PDF Citation
 Print
Print


INTRODUCTION
Liver fibrosis, which is characterized by the accumulation of the extracellular matrix and scar formation,12 occurs in most types of chronic liver diseases, including chronic viral hepatitis, non-alcoholic fatty liver disease, alcoholic liver disease, and cholestatic and autoimmune liver diseases. The activation of hepatic stellate cells (HSCs), which localize to the perisinusoidal space between hepatocytes and sinusoidal endothelial cells, is a central event in liver fibrosis development. Activated HSCs subsequently differentiate into myofibroblasts,3 the major source of extracellular matrix constituents in the injured liver.
Receptor for advanced glycation end products (RAGE) was reported to be expressed in activated HSCs, and silencing RAGE expression suppressed the activation of HSCs and liver fibrosis in an experimental study.4 RAGE is a cell surface receptor and a multiligand binding member of the immunoglobulin superfamily. RAGE plays a key role in the onset and sustainment of the inflammatory response.56 Under physiological conditions, RAGE is expressed at low levels in all tissues, except in the lung.7 However, in pathophysiological settings, such as atherosclerosis, diabetes, inflammation, neurodegeneration, amyloidosis, and cancer, RAGE expression is increased drastically.8 Previous studies reported that RAGE protein expression is increased in animal models of liver fibrosis,49 and the activation of RAGE has been suggested as one of the mechanisms for the progression of chronic liver diseases.10 Therefore, the blockade of the RAGE pathway may be a strategy to prevent liver injury. Actually, soluble RAGE, a natural antagonist of RAGE, increased animal survival after acetaminophen-induced liver injury.11 In a carbon tetrachloride (CCl4)-induced animal model, silencing RAGE expression restrained the activation of HSCs and ultimately led to the reduction of liver fibrosis.4 However, research on the RAGE pathway in cholestasis-induced liver injury is very sparse. Cholestasis can result in acute liver injury or liver fibrosis/cirrhosis which can even lead to death. Because treatment options in cholestasis-induced liver injury are very limited, the effort to find effective therapy through understanding the molecular mechanism is essential. In this study, we investigated the expression of RAGE and S100B, one of the ligands interacting with RAGE, in an experimental mouse model of cholestasis-induced liver injury.
The S100 protein family is a multigenic group of non-ubiquitous Ca2+-binding proteins of the EF-hand type expressed in vertebrates exclusively. The S100 proteins exist as homologous and heterologous dimers by showing distinct tissue- and cell-type specific expression patterns.12 S100B is predominantly found in astroglia and Schwann cells, and it plays an important role in normal central nervous system development and recovery after injury by regulating the cytoskeletal structure and cell proliferation.13 S100B acts as an intracellular regulator and exerts extracellular functions by being a ligand of receptor for RAGE, inducing a series of signal transduction cascades.1415 Although S100B is a well-known marker of various brain injuries,1617 its expression was reported in other cell types, such as oligodendrocytes and adipocytes.1819 It remains unclear whether S100B is expressed in the liver itself. A previous study reported that the plasma S100B levels were increased in proportion to those of alanine aminotransferase during ischemic liver injury without brain insult.20 This finding suggests that the liver may be a possible extra-cranial source of S100B.
Therefore, we investigated S100B expression in the liver and the change in S100B and RAGE expression during liver fibrosis in mice that underwent common bile duct ligation (BDL), which is a well-accepted technique that is commonly used to induce cholestasis and liver fibrosis.21
Go to : 
METHODS
Animals and procedures
Male C57BL/6J mice (10 weeks old) were purchased from Raon Bio (Yongin, Republic of Korea) and housed in a clean facility under natural light-dark cycle conditions (12 hours/12 hours light/dark cycle). After a 1-week period of acclimatization, the mice were randomly assigned to two groups: a sham-operated group (control, n = 26) and a BDL group (liver fibrosis, n = 26). Under intraperitoneal tribromoethanol (200 mg/kg) anesthesia, the common bile duct was double ligated using 3-0 silk sutures after midline laparotomy. Sham-operated mice went through an identical laparotomy and liver manipulation procedure without BDL. Thirteen mice from each group were sacrificed at weeks 1 and 3, and the livers were collected under anesthesia.
Cell culture and small interfering RNA (siRNA) transfection
HSC-T6 cell lines (provided by Dr. Scott Friedman, Division of Liver Diseases, Icahn School of Medicine at Mount Sinai, NY, USA), were previously established.22 HSC-T6 cells were maintained in Dulbecco's modified Eagle's medium containing 10% fetal bovine serum and 1% penicillin/streptomycin (Thermo Fisher Scientific, Rockford, IL, USA) at 37°C under 5% CO2. The HSC-T6 cells were transiently transfected with siRNA targeting rat RAGE (Bioneer, Daejeon, Korea) for 72 hours to silence RAGE expression using the Lipofectamine RNAiMAX reagent (Thermo Fisher Scientific) according to the manufacturer's instructions.
Expression and purification of recombinant S100B protein
Recombinant mouse S100B protein was expressed and purified as described previously with minor modifications.2324 Briefly, the expression vector pET41a-S100B plasmid was transformed into E. coli BL21 (DE3) cells. S100B-expressing BL21 cells were grown in 1 L of LB media with 40 mg/mL kanamycin until the A600 reached 0.9; then 1 mM isopropyl β-D-1-thiogalactopyranoside was added to the bacteria for induction. Cells were harvested and resuspended in lysis buffer (50 mM Tris-HCI, 5 mM EDTA, 1 mM 8 mercaptoethanol, pH 7.5). S100B was purified by HPLC phenyl column (10 μm, 3.9 × 300 mm) according to the manufacturer's instructions, desalted, and freeze dried. Bacterial endotoxin contamination in S100B protein purified from bacterial cultures was minimized with Endotoxin Removal Spin Columns (Thermo Fisher Scientific) according to the manufacturer's instructions. Residual bacterial endotoxin was evaluated using the LAL chromogenic endotoxin quantitation Kit (Thermo Fisher Scientific).
Histology
Formalin-fixed paraffin-embedded liver sections were prepared using standard histological techniques. Six-μm-thick paraffin-embedded liver sections of sham control and BDL mice were stained with hematoxylin and eosin for histological analysis or saturated with picric acid containing 0.1% Sirius Red as previously described.25
Immunohistochemistry
Six-μm-thick paraffin-embedded liver sections of sham control and BDL mice were immunostained with a rabbit monoclonal anti-S100B antibody (1:200; Abcam, Cambridge, MA, USA), and visualization was performed using VECTASTAIN ABC Kit (Vector Labs, Burlingame, CA, USA). The sections were counterstained with Harris' hematoxylin solution (Sigma, St. Louis, MO, USA) and examined under a light microscope (Olympus BX51; Olympus, Tokyo, Japan).
Quantitative real-time reverse transcription polymerase chain reaction (qRT-PCR)
Total RNA was extracted from the mouse liver samples, and the complementary DNA synthesized as described previously.26 The qRT-PCR was performed with SYBR Green PCR master mix (Thermo Scientific, Waltham, MA, USA). The gene-specific primer sequences for S100B, α-smooth muscle actin (α-SMA), tissue inhibitor of metalloproteinases-1 (TIMP-1), collagen type I (Col1a1), and β-actin are listed in Table 1.
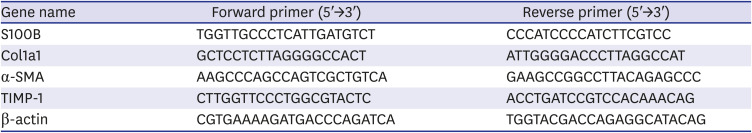
Table 1
Primers for quantitative real-time reverse transcription polymerase chain reaction
Col1a1 = collagen type I, α-SMA = α-smooth muscle actin, TIMP-1 = tissue inhibitor of metalloproteinases-1.
![]()
Western blot analysis
Total lysates from the liver samples were prepared using RIPA buffer (50 mM Tris-HCI, pH 7.5, 150 mM NaCl, 1 mM ethylenediaminetetraacetic acid, 1% Nonidet P-40, 0.5% sodium deoxycholic acid, 0.1% sodium dodecyl sulfate) and protease inhibitors (Pierce Biotechnology, Rockford, IL, USA). The liver tissue lysates (40 µg protein/each lane) were subjected to 12 or 15% SDS-PAGE and transferred to polyvinylidene difluoride membranes (Merck Millipore, Lake Placid, NY, USA). The membranes were incubated with the following target primary antibodies; rabbit monoclonal anti-S100B (1:1,000; Abcam); rabbit polyclonal anti-RAGE (1:1,000; Abcam); rabbit polyclonal anti- α-SMA (1:1,000; Abcam); rabbit polyclonal anti-collagen1 (1:1,000; Abcam); and mouse monoclonal β-actin (1:5,000; Sigma). Chemiluminescent signals were detected with the ImageQuant LAS 4000 apparatus (GE Healthcare Life Sciences, Piscataway, NJ, USA).
Immunogold labeling and transmission electron microscopy analysis
Mice were anesthetized with tribromoethanol (200 mg/kg) and perfused with 0.1 M phosphate-buffered saline (PBS; pH 7.4) containing 4% paraformaldehyde (PFA) and 2.5% glutaraldehyde (GA). The liver was trimmed into small pieces immediately following excision and kept in fixative buffer (0.1 M PBS containing 4% PFA and 2.5% GA) for 2 hours at 4°C. Postfixation was performed in 0.1 M PBS containing 1% osmium tetroxide, followed by dehydration with a graded ethanol series and embedding with the Embed 812 kit (EMS, Hatfield, PA, USA). Ultrathin sections (75 nm) were cut with an RMC MTXL ultramicrotome (RMC Boeckeler, Tucson, AZ, USA) and nickel grids. The grids were incubated on drops of 4% aqueous sodium metaperiodate for 10 minutes at RT followed by incubation on drops of 1% aqueous periodic acid for 10 minutes. The sections were blocked with Aurion blocking solution (Aurion, Dunedin, New Zealand). For double immunogold labeling, sections were incubated in a mixture of rabbit monoclonal anti-S100B (1:100; Abcam) and mouse monoclonal anti-RAGE (1:100; Millipore) diluted with PBS containing 0.1% Aurion BSA-c™ (Aurion; PBS/BSA-c). After washing with PBS/BSA-c, sections were incubated in the mixture of goat anti-rabbit immunoglobulin G (IgG)-conjugated 15 nm gold particles (for S100B) and goat anti-mouse IgG-conjugated 25 nm gold particles (for RAGE) diluted 1:50 with PBS/BSA-c. Sections were poststained with uranyl acetate and lead citrate in the usual manner. The sections were observed under a transmission electron microscope (JEM-1011; JEOL, Tokyo, Japan).
Immunofluorescence staining
Six-μm-thick paraffin-embedded liver sections, and the sections were subjected to antigen retrieval with Tris-EDTA buffer at pH 9.0, followed by blocked with 10% normal donkey serum in 1% BSA for 1 hour, and probed with the following primary antibodies in PBST overnight at 4°C: mouse monoclonal anti-α-SMA (1:200; Dako, Glostrup, Denmark), rabbit monoclonal anti-S100B (1:200; Abcam), rat polyclonal anti-cytokeratin19 (CK19, 1:200; DSHB, IA, USA), or goat polyclonal anti-RAGE (1:100; Santa Cruz, CA, USA). After primary antibody incubation, the sections were incubated with Alexa Fluor 488 goat anti-mouse or rabbit IgG, Alexa Fluor 568 goat anti-mouse or rat IgG, or Alexa Fluor 647 donkey anti-goat IgG (Invitrogen, Carlsbad, CA, USA), and then mounted using gold antifade reagent (Invitrogen). Images were obtained using a confocal laser scanning microscope (LSM 700; Carl Zeiss, Oberkochen, Germany).
Statistical analyses
Statistical analyses were performed, and graphs were generated using GraphPad Prism software (GraphPad Prism 8; GraphPad software, La Jolla, CA, USA). Statistical differences were determined by one-way analysis of variance followed by Tukey's post hoc test. The data are presented as the means ± standard error of mean. Statistical significance was reached at P < 0.05.
Ethics statement
The procedures used and the care of animals were approved by the Institutional Animal Care and Use Committee of Hallym Medical Center Institutional Animal Care and Use Committee (HMC2020-1-0611-18).
Go to :
RESULTS
Development of liver fibrosis in BDL mice
To evaluate the development of liver fibrosis, we examined the histopathological and biochemical changes in liver tissues in sham control and BDL mice at weeks 1 and 3 after the operation. Histological examination of the livers from sham control mice showed a normal structure (Fig. 1A and B, upper panels), whereas BDL mice showed an induction of expanded portal tracts with bile duct proliferation and periportal fibrosis with clusters of injured hepatocytes compared with sham controls (Fig. 1A, lower panels). In addition, the progression of collagen deposition at weeks 1 and 3 after the operation was determined by Sirius Red staining. As shown in Fig. 1B, increased collagen deposition and definite fibrotic septae around central veins were observed in the livers of BDL mice compared with sham controls. According to qRT-PCR, the messenger RNA (mRNA) expression of α-SMA, TIMP-1, and Col1a1, which are fibrosis-related markers, at weeks 1 and 3 after BDL were significantly upregulated compared with sham controls in a time-dependent manner (Fig. 1C). These findings showed that liver fibrosis was successfully induced in BDL mice.
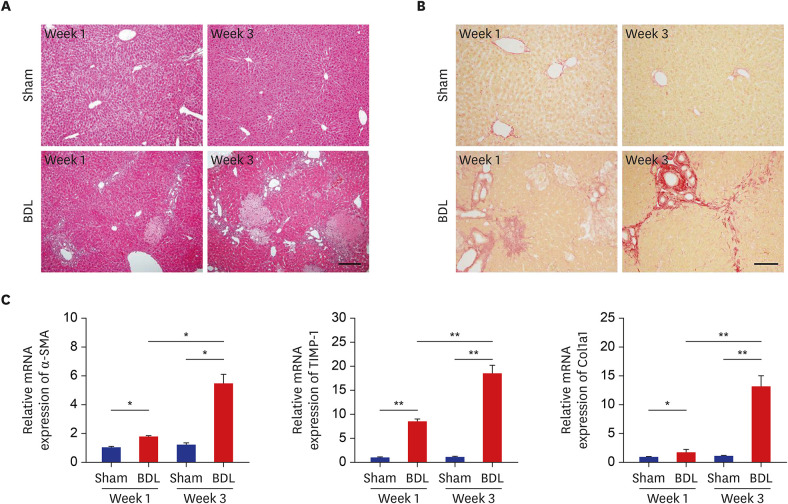 | Fig. 1Development of liver fibrosis after BDL. (A, B) Liver sections from sham control (upper panels) and BDL (lower panels) mice were examined by hematoxylin and eosin staining (A) and Sirius Red staining (B) at weeks 1 and 3 after BDL. (C) The mRNA levels of fibrotic marker genes at weeks 1 and 3 after BDL were determined by quantitative real-time reverse transcription polymerase chain reaction and normalized to β-actin (n = 9). The data represent the mean ± standard error of mean of three independent experiments. Scale bars, 25 μm.BDL = bile duct ligation, mRNA = messenger RNA, α-SMA = α-smooth muscle actin, TIMP-1 = tissue inhibitor of metalloproteinases-1, Col1a1 = collagen type I.
*P < 0.05, **P < 0.01.
|
Upregulation of S100B expression during liver fibrosis in BDL mice
To determine the expression levels of S100B protein and mRNA during liver fibrosis, we performed Western blot and qRT-PCR analyses, respectively, using liver tissues from sham controls and BDL mice. Interestingly, the expression levels of S100B protein (Fig. 2A) and mRNA (Fig. 2B) at weeks 1 and 3 were significantly increased in the livers of BDL mice compared with sham controls. These results suggest that the increased S100B expression may be involved in the progression of liver fibrosis.
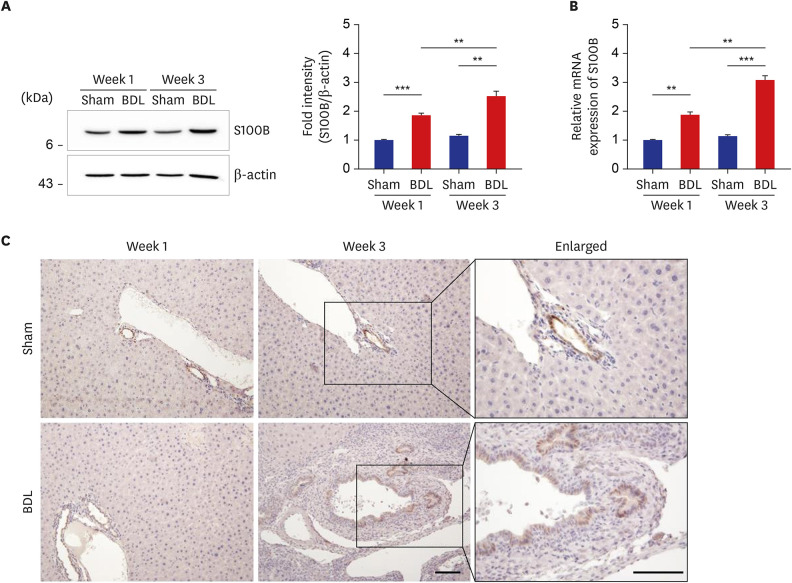 | Fig. 2Upregulated S100B expression in the livers of BDL mice. (A, B) Expression levels of S100B protein (A) and mRNA (B) in the livers from sham control and BDL mice was determined by Western blot analysis (A) and quantitative real-time reverse transcription polymerase chain reaction (B) and normalized to β-actin (n = 9) at each time point. The data represent the mean ± standard error of mean of three independent experiments. (C) Immunohistochemical staining of S100B in liver tissues from sham control and BDL mice. Note that an increased number of S100B-positive cells was found in the bile duct of BDL liver. Scale bars, 25 μm.BDL = bile duct ligation, mRNA = messenger RNA.
**P < 0.01, ***P < 0.001.
|
Next, to verify the increased expression of S100B and to determine the cellular localization of S100B in BDL-induced liver fibrosis, immunohistochemical analysis was performed using liver sections from sham control and BDL mice (Fig. 2C). In both sham control and BDL mice, S100B protein was detected in bile duct epithelial cells but not in hepatocytes. Interestingly, as the bile ductules were increased in liver fibrosis induced by BDL, the number of S100B-positive cells were increased. This finding indicates that increased S100B expression is related to proliferating bile duct epithelial cells in BDL-induced liver fibrosis and that S100B protein may be a possible marker of ductular reaction occurred in cholestatic liver fibrosis.
Increased expression of RAGE protein during liver fibrosis in BDL mice
Previous studies have demonstrated a role for RAGE in the modulation of liver regeneration and activation of HSCs.2728 Because RAGE is a receptor of S100B, we examined whether RAGE expression is also affected in BDL-induced liver fibrosis. As shown in Fig. 3A, RAGE protein expression in the livers of BDL mice was significantly increased at 1 week and 3 weeks compared with sham controls. These findings suggest that RAGE expression is increased with the progression of cholestatic liver fibrosis, which positively correlates with S100B expression.
 | Fig. 3Subcellular localization of S100B and RAGE in the livers of BDL mice. (A) Expression of RAGE protein in the livers of sham control and BDL mice at 1 week and 3 weeks after operation was analyzed by Western blot analysis (left panel) and normalized to β-actin (right panel) (n = 9). The data represent the mean ± standard error of mean of three independent experiments. (B, C) Triple immunofluorescence staining of S100B, RAGE, and α-SMA (B) or CK19 (C) were performed in the liver sections of sham control and BDL mice at 3 weeks after operation. Note the colocalization of S100B and RAGE in α-SMA-positive activated HSCs (B) as well as CK19-positive bile duct epithelial cells (C) in the BDL livers. Green, S100B; red, α-SMA, and CK19; white, RAGE. Scale bars, 20 μm.RAGE = receptor for advanced glycation end products, BDL = bile duct ligation, α-SMA = α-smooth muscle actin, CK19 = cytokeratin19.
*P < 0.05, **P < 0.01, ***P < 0.001.
|
Colocalization of S100B and RAGE in activated HSCs as well as bile duct epithelial cells in the livers of BDL mice
Next, to determine the cellular localization of S100B and RAGE, we performed immunofluorescence staining using α-SMA and CK19 as markers for activated HSCs and biliary/progenitor cells, respectively. S100B has been known to exert an extracellular function as a ligand of RAGE.14 Thus, we investigated whether S100B colocalizes with RAGE in the livers of BDL mice. Because RAGE expression was observed in activated HSCs and proliferating bile duct epithelial cells in the BDL livers, we performed triple immunofluorescence staining using S100B, RAGE, and α-SMA or CK19. As shown in Fig. 3B and C, colocalization of S100B and RAGE was intensely observed in α-SMA-positive activated HSCs as well as CK19-positive bile duct epithelial cells in the livers of BDL mice. Supporting these findings, immunogold labeling and transmission electron microscopy analysis revealed that in the livers of BDL, S100B (arrows) and RAGE (arrowhead) were predominantly localized in the cytoplasm and microvilli of bile duct epithelial cells (Fig. 4, upper panels). In HSCs, S100B- and RAGE-labeled gold particles were found in the nucleus and its environs (Fig. 4, lower panels). These data suggest that colocalization of S100B and RAGE with a ligand-receptor binding may contribute to the pathogenesis of BDL-induced liver fibrosis via ductular reaction and HSCs activation.
 | Fig. 4Double immunogold labeling of S100B and RAGE in the livers of BDL mice. The liver sections from sham control and BDL mice at week 3 were incubated with rabbit monoclonal anti-S100B (1:100) and mouse monoclonal anti-RAGE (1:100), followed by incubation with goat anti-rabbit IgG-conjugated 15 nm gold particles for S100B and goat anti-mouse IgG-conjugated 25 nm gold particles for RAGE. Note that immunogold particles indicating S100B (arrows) and RAGE (arrowhead) are present in the cytoplasm and microvilli of bile duct epithelial cells (upper panels), and in the HSCs, both particles were found in the nucleus and its environs (lower panels). Scale bars, 2 μm.RAGE = receptor for advanced glycation end products, BDL = bile duct ligation, HSC = hepatic stellate cell, IgG = immunoglobulin G, N = nuclei, M = mitochondria, L = lumen, LD = lipid droplet.
|
S100B regulates HSC activation through RAGE
HSC activation induces α-SMA and Col1a1 expression via RAGE in HSCs.29 Therefore, we investigated whether S100B affects HSC activation. As shown in Fig. 5A and B, recombinant S100B protein treatment upregulated HSC activation-related fibrotic marker proteins and mRNAs in HSC-T6 cells. To elucidate whether the increased activation of HSCs regulated by S100B was due to RAGE-mediated signaling, siRNA-mediated knockdown of endogenous RAGE resulted in a decrease in the levels of fibrotic markers (Fig. 5C and D). These results suggest that S100B regulates HSC activation-related fibrotic proteins via RAGE.
 | Fig. 5S100B regulates HSC activation via RAGE. (A, B) HSC-T6 cells were treated with recombinant mouse S100B protein in a dose-dependent manner. After 12 hours, the cells were lysed, and HSC activation-related protein and gene expression levels were detected by Western blotting (A) and qRT-PCR (B), respectively. (C, D) HSC-T6 cells were transiently transfected with either SCR or si-RAGE in a dose-dependent manner, then incubated with 25 ng of recombinant S100B protein for 12 hours and analyzed by Western blotting (C) and qRT-PCR (D). The data represent the mean ± standard error of mean of three independent experiments.RAGE = receptor for advanced glycation end products, Col1a1 = collagen type I, α-SMA = α-smooth muscle actin, GAPDH = glyceraldehyde 3-phosphate dehydrogenase, mRNA = messenger RNA, PBS = phosphate-buffered saline, SCR = scrambled, si-RAGE = small interfering RNA-mediated knockdown of endogenous RAGE, qRT-PCR = quantitative real-time reverse transcription polymerase chain reaction, HSC = hepatic stellate cell.
*P < 0.05, **P < 0.01, ***P < 0.001.
|
Go to :
DISCUSSION
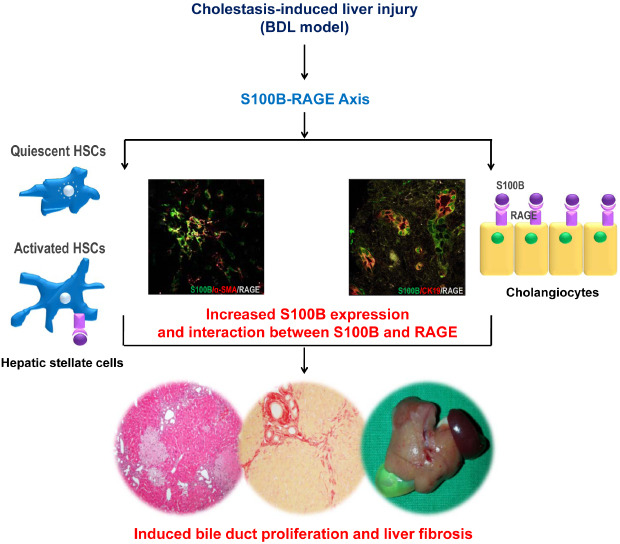
In the present study, we demonstrated the following. 1) S100B is present in bile duct epithelial cells (or cholangiocytes) of the liver under normal (sham) and injured (BDL) conditions, and S100B expression is highly increased in proportion to bile duct proliferation developed after BDL. 2) RAGE expression is upregulated during liver fibrosis by BDL and colocalizes with not only α-SMA, a marker of activated HSCs, but also CK19, a biliary/progenitor cell marker. 3) S100B colocalizes with RAGE in activated HSCs and bile duct epithelial cells of BDL livers, as shown in the immunofluorescence staining data.
Bile duct obstruction either clinically or experimentally leads to increased numbers of bile ducts in small portal tracts, a response termed ‘ductular reaction’ or ‘bile duct proliferation’. During bile duct proliferation, cholangiocytes obtain features of the neuroendocrine epithelium.3031 Proliferating cholangiocytes produce various autocrine factors regulating bile duct proliferation and activating HSCs in the nearby microenvironment. This process results in biliary fibrosis and subsequent liver cirrhosis.323334 Therefore, the proliferating capacity of cholangiocytes is very important in disease progression by BDL.
We found that S100B protein was immunohistochemically observed in the bile duct epithelial cells of the sham controls, and its expression level was increased in proportion to both the proliferation of bile duct epithelial cells and the stage of liver fibrosis. Such a finding was well reflected by the fibrosis markers α-SMA, TIMP-1, and Col1a1. Moreover, immunogold labeling and transmission electron microscopy analysis revealed that S100B was expressed in not only bile duct epithelial cells but also HSCs of the liver in mice that underwent BDL. These findings suggest that S100B may be one of the various auto- or paracrine factors regulating bile duct proliferation and activating HSCs in the nearby microenvironment.
However, the causal relationship between S100B overexpression in proliferating bile duct epithelial cells and liver fibrogenesis is unclear. Several intracellular signaling pathways that regulate cholangiocyte proliferation have been documented. The phosphorylation of AKT, an immediate downstream target of phosphatidylinositol 3-kinase (PI3K), is increased when cholangiocyte proliferation is induced by biliary obstruction.35 Considering that S100B expression in astrocyte cell lines is related to proliferation via the induced activity of the PI3K/AKT module,36 it is possible that S100B expression promotes bile duct proliferation through the PI3K/AKT pathway. Intracellular Ca2+ signaling also plays a pivotal role in modulating cAMP levels and acetylcholine involved in cholangiocyte proliferation.31 Considering that S100B is related to intracellular Ca2+ homeostasis, S100B may influence the Ca2+-dependent pathway involved in cholangiocyte proliferation.
We have shown that RAGE expression was increased during liver fibrosis induced by BDL. A recent experimental study reported that a RAGE-blocking antibody attenuated liver fibrosis and duct proliferation in a BDL model.37 These findings demonstrate that the RAGE pathway is involved in cholestasis-induced liver injury. Our immunofluorescence data showed that RAGE was intensely detected in not only α-SMA-positive activated HSCs but also CK19-positive bile duct epithelial cells of the BDL livers, and transmission electron microscopy analysis also showed the gold particles indicating RAGE in bile duct epithelial cells and HSCs of livers that underwent BDL. HSC activation and proliferation are major steps in liver fibrosis by various causes. RAGE expression in HSCs has been confirmed in humans and rats.93138 However, studies regarding the relevance between RAGE expression and bile duct proliferation are very sparse. In the present study, RAGE expression was observed in only BDL livers with RAGE evident in CK19-positive areas. This finding suggests that RAGE is not expressed in cholangiocytes under normal conditions but may be expressed in cholangiocytes with proliferating capacity acquired by BDL. A previous study reported that anti-RAGE-treated rats after BDL have significantly less bile duct proliferation than the control group,37 which supports the possibility that the RAGE-related pathway promotes bile duct proliferation. In the current study, immunofluorescence staining of BDL livers showed colocalizing areas of S100B-RAGE-CK19 and S100B-RAGE-α-SMA, and transmission electron microscopy analysis also demonstrated that S100B and RAGE were expressed in bile duct epithelial cells and HSCs of the BDL liver. These findings suggest that the S100B-RAGE axis may be involved in not only bile duct proliferation but also HSCs activation and that the extracellular release and function of S100B, along with the already known properties of S100B, occur in the BDL liver. In vitro experiments using HSC-T6 cells showed that the treatment with recombinant S100B protein increased the expression of RAGE and fibrotic markers in HSC-T6 cells, and RAGE knockdown suppressed S100B-stimulated upregulation of fibrotic markers, Col1a1 and α-SMA. These findings suggest a possibility of the S100B-RAGE axis as an inducer of liver fibrosis.
To our knowledge, this study is the first to suggest the pathophysiological role of S100B and RAGE in the BDL-induced liver injury model. To date, few human studies have investigated S100 protein expression in biliary tract diseases, including cholangiocarcinoma and primary biliary cholangitis, previously known as a primary biliary cirrhosis.394041 Sato et al.41 suggested S100P as a tissue and bile biomarker for the detection of cholangiocarcinoma and S100A2 as a potential prognostic marker of patients with cholangiocarcinoma. Another study showed augmented levels of S100A12 protein in the serum and S100A12 mRNA in peripheral mononuclear blood cells from patients with primary biliary cholangitis.40 These S100 proteins are known ligands of RAGE. However, there are no studies investigating the intra-hepatic expression of these S100 proteins or the interaction between these S100 proteins and RAGE in biliary tract diseases.
In conclusion, S100B protein is expressed in normal bile duct epithelial cells and is highly upregulated with bile duct proliferation (ductular reaction) during liver fibrosis by BDL, which correlates well with the transcript levels of other markers of fibrosis. RAGE is also upregulated after BDL and colocalizes with S100B in not only HSCs but also proliferating bile duct epithelial cells. These findings suggest that S100B-RAGE axis may promote the proliferation of bile duct epithelial cells and the activation of HSCs in a BDL model. Further studies will be needed to unveil the specific mechanism of the S100B-RAGE axis in cholestasis-induced liver injury and establish the role of S100B-RAGE in various liver injuries.
Go to :
 XML Download