Journal List > Diabetes Metab J > v.45(2) > 1146725

Lee, Baek, Han, and Koh: Insulin Resistance Increases Serum Immunoglobulin E Sensitization in Premenopausal Women

Abstract

Background

Although studies have shown that obesity is associated with aeroallergen sensitization (atopy), controversy still exists. We aimed to investigate the association between metabolic status, obesity, and atopy stratified by sex and menopausal status.

Methods

A total of 1,700 adults from the 2010 Korean National Health and Nutrition Examination Survey were classified into metabolically healthy nonobese (MHNO), metabolically unhealthy nonobese (MUNO), metabolically healthy obese (MHO), and metabolically unhealthy obese (MUO) by body mass index and insulin resistance. Atopy was defined as a positive response to at least one aeroallergen. Multiple regression analysis was used to evaluate the risk of immunoglobulin E (IgE) elevation or atopy in relation to the degree of metabolic abnormality and obesity.

Results

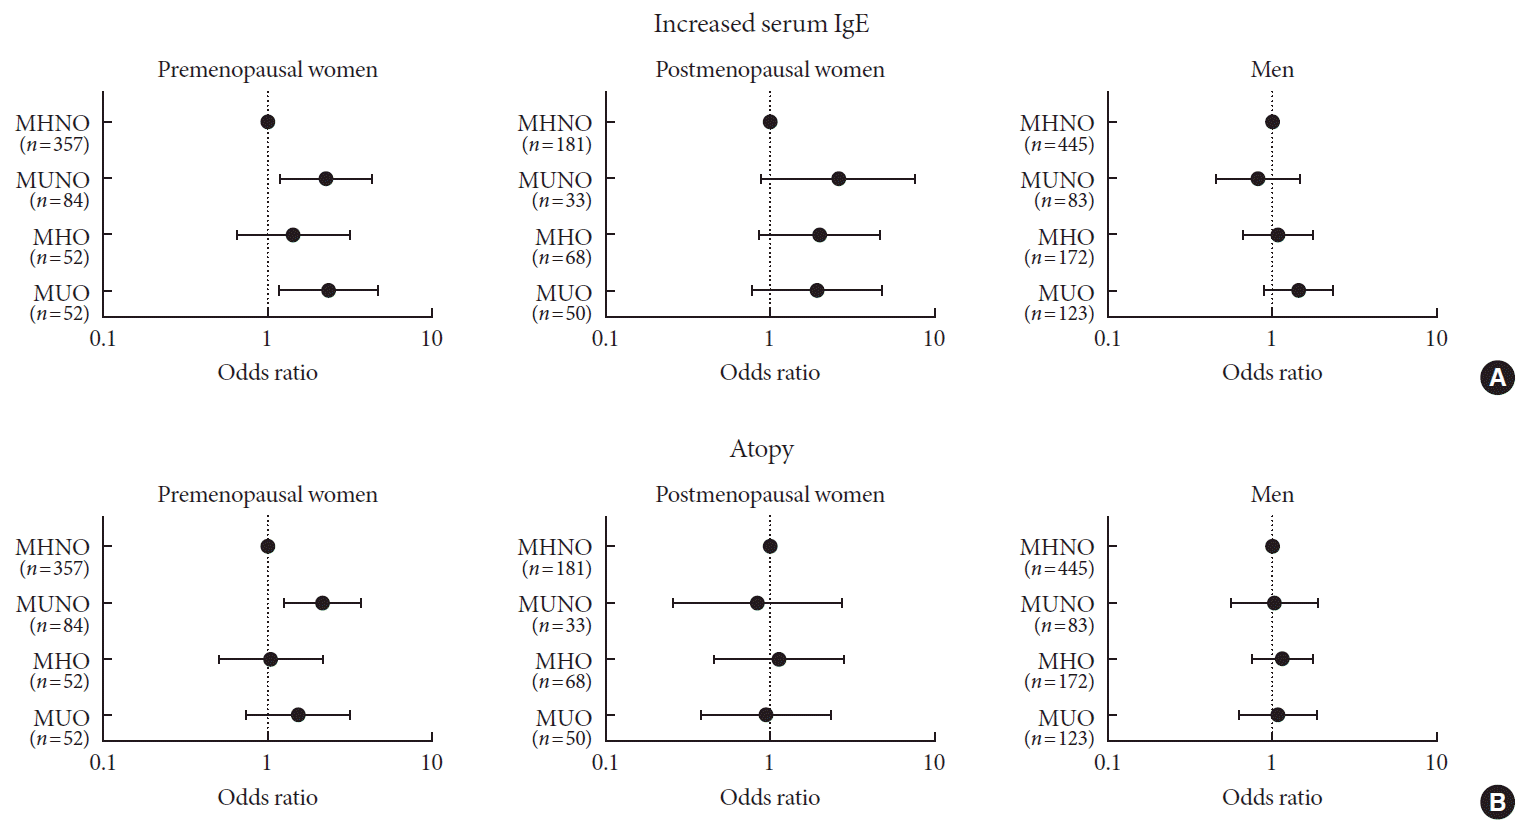
In premenopausal women, total IgE was positively correlated with obesity and insulin resistance. MUNO participants had a higher risk of having elevated total IgE compared to MHNO participants (odds ratio [OR], 2.271; 95% confidence interval [CI], 1.201 to 4.294), while MHO participants did not show a significant difference (OR, 1.435; 95% CI, 0.656 to 3.137) in premenopausal women. MUNO, but not MHO was also associated with atopy (OR, 2.157; 95% CI, 1.284 to 3.625). In men and postmenopausal women, there was no significant difference between metabolic status, obesity, and atopy among groups.

Conclusion

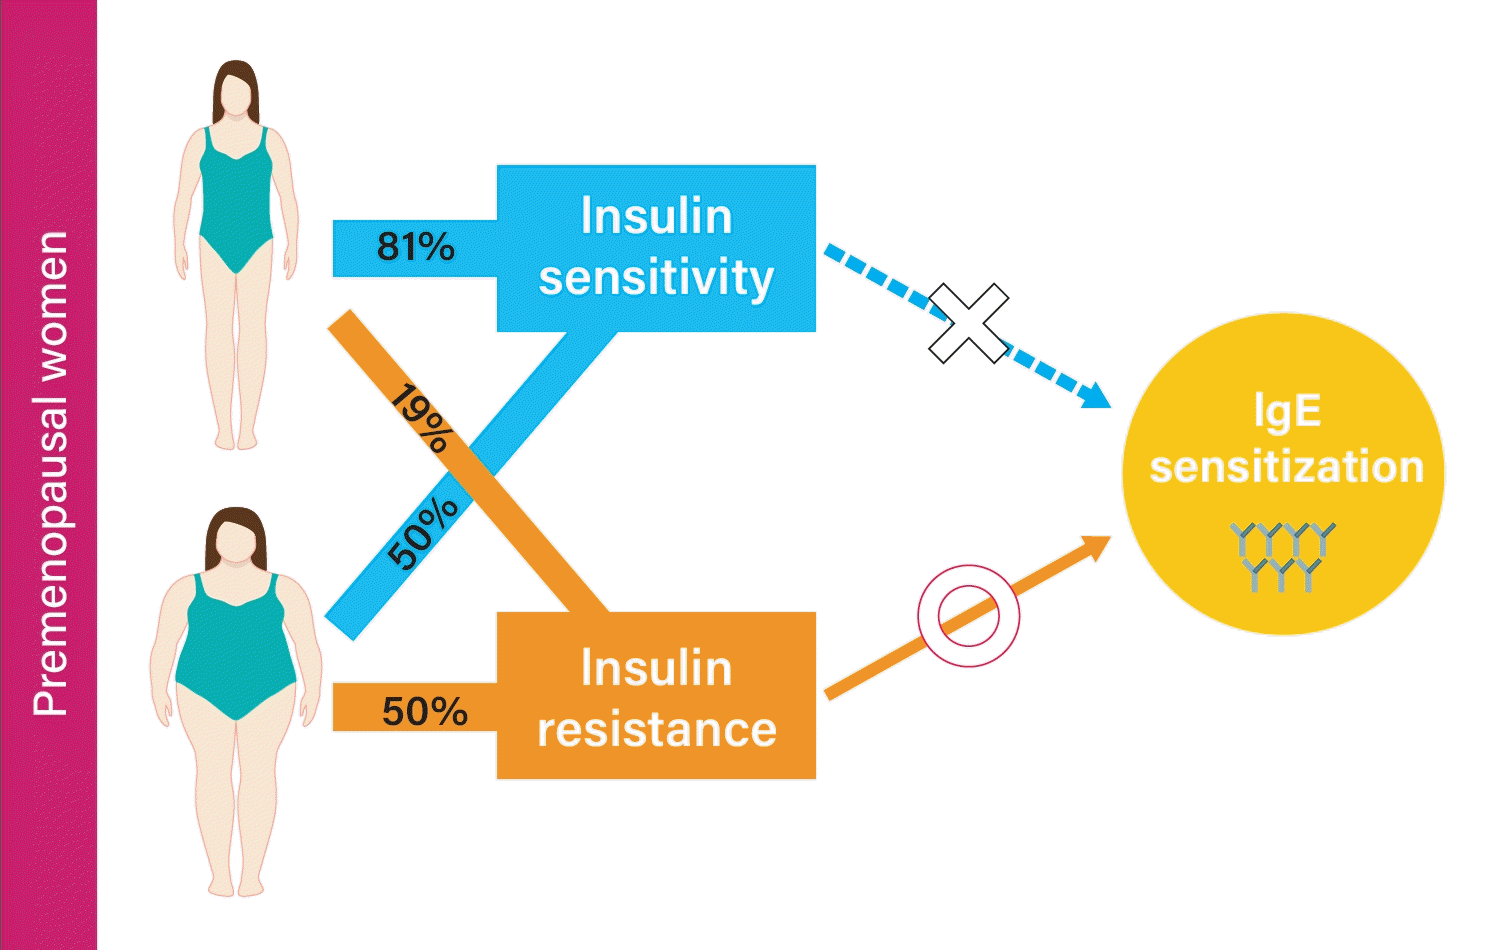
Increased insulin resistance is associated with total IgE and atopy in premenopausal women but not in postmenopausal women or men.

Graphical abstract

INTRODUCTION

As the impact of obesity epidemic has increased worldwide over the past four decades [1], obesity has become a major burden on health care systems. Consistent with the worldwide trend, the prevalence of obesity has also risen markedly in Korea, reaching 43.2% in males and 30.2% in females [2]. In a study using forecasting models, 61.5% men and 37.0% females in Korea were predicted to be obese by 2030 [3]. Previous epidemiologic studies have demonstrated the association between obesity and asthma [4]. Interestingly, aeroallergen sensitization (atopy) does not appear to mediate the relationship between obesity and asthma [5] despite atopy being a major factor in the development of asthma. Furthermore, studies examining the relationship between obesity and atopy have shown inconsistent results [6].
Although obesity is associated with elevated risk of overall mortality and cardiovascular diseases (CVD) [7], not all subtypes of obesity show detrimental outcomes. Obesity can be sub-classified as metabolically healthy obese (MHO) or metabolically unhealthy obese (MUO) [89] according to the presence or absence of metabolic abnormalities such as dyslipidemia, insulin resistance, hypertension or unfavorable inflammatory profile. MHO individuals, characterized by obesity but without metabolic syndrome, are prone to have more subcutaneous fat rather than visceral fat and show less inflammation in adipose tissue compared to MUO individuals despite their high degree of obesity [8]. Compared to MUO, MHO phenotype showed lower cardiometabolic risk profile with approximately 50% reduced risk of type 2 diabetes mellitus and CVD [1011]. Considering that the increased risk of atopy conferred by adiposity has been attributed to the associated insulin resistance [12], individuals with MHO phenotype might not be at an increased risk for atopy. However, no studies to date have reported an association between MHO phenotype and atopy.
Therefore, we aimed to investigate the influence of obesity and insulin resistance on total serum immunoglobulin E (IgE) and atopy using representative samples of the Korean population. Since studies have shown distinct effects of obesity on allergic diseases based on sex, suggesting an influence of estrogen levels [6], we stratified the analysis by age, sex and menopausal status to eliminate possible confounding due to difference in estrogen levels.

METHODS

Data source and study population

In this study, we used data from the first year (2010) of the 5th Korean National Health and Nutrition Examination Survey (KNHANES V-1), which was conducted from January 2010 to December 2010 by the Korea Centers for Disease Control and Prevention. KNHANES surveys are conducted annually to estimate the prevalence of chronic disease and monitor trends in prevalence and risk behavior at the national level. The KNHANES uses a complex, multi-stage probability sample design so that participant sampling can be representative of the total non-institutionalized civilian population of Korea [13].
The KNHANES collects data obtained by physical examination, clinical and laboratory tests, personal interviews, and related measurement procedures [13]. Notably, the 2010 KNHANES survey also gathered information on serum levels of total and allergen-specific IgE from randomly chosen participants. Among the 8,958 potential participants, subjects were excluded if: (1) the examinee was younger than 19 years of age (n= 2,218), (2) IgE measurements were not conducted (n=4,763), (3) there was substantial missing information (n=124), or (4) participants had a history of diabetes (n=153) because hypoglycemic drugs could possibly affect insulin sensitivity and body weight to a variable extent. Finally, the study population comprised 1,700 subjects. All participants in the KNHANES survey provided informed consent prior to participation. The Institutional Review Board of the Asan Medical Center, Seoul, Korea reviewed the protocol of the present study and it was exempted from a complete review, because it involved only secondary analysis of de-identified data (IRB No.: S2019-0226-0001).

Clinical and laboratory measurements

Participants in the survey were required to respond to all questions. The questionnaire included questions regarding age, sex, smoking and alcohol consumption, and regular exercise. Subjects who had smoked over 100 cigarettes in their lives were classified as ever-smokers. Heavy drinkers were defined as those who drank >60 g of pure alcohol/drinking session for men and >40 g of pure alcohol/drinking session for women with more than two dinking sessions per week. Subjects were defined as physically active if their exercise activity consisted of (1) ≥3 days of vigorous activity for ≥20 min/day per week or (2) ≥5 days of moderate intensity activity or walking for 30 min/day. Menopause was defined by health interview as having no menstruation due to natural or surgical causes. Body mass index (BMI) was calculated as weight divided by height squared (kg/m2). Waist circumference was measured at the level of the midpoint between the iliac crest and the costal margin at the end of a normal expiration. Vitamin D level was measured using a 1470 Wizard Gamma Counter (Perkin Elmer, Turku, Finland) and by radioimmunoassay (DiaSorin, Stillwater, MN, USA). Insulin levels were measured using a 1470 Wizard Gamma Counter (PerkinElmer, Waltham, MA, USA) by immunoradiometric assay (INS-IRMA kit; Biosource, Nivelles, Belgium). Total and allergen-specific IgE levels were analysed using a 1470 Wizard Gamma Counter (PerkinElmer) by immunoradiometric assay (ImmunoCAP 100; Phadia, Uppsala, Sweden).

Classification of metabolic health and obesity

Obesity was defined as a BMI of 25 kg/m2 or more and metabolic unhealthiness was defined as highest quartile of insulin resistance estimated by homeostasis model assessment of insulin resistance (HOMA-IR: fasting blood glucose [mg/dL]×fasting insulin [µIU/mL]/405) [14]. Based on these definitions, subjects were divided into four groups: MHO: BMI ≥25 kg/m2 and HOMA-IR index in the lower three quartiles (Q1–Q3); MUO: BMI ≥25 kg/m2 and HOMA-IR index in the top quartile (Q4); metabolically healthy nonobese (MHNO): BMI <25 kg/m2 and HOMA-IR index in Q1 to Q3; and metabolically unhealthy nonobese (MUNO): BMI <25 kg/m2 and HOMA-IR index in Q4 as in a previous study [15].

Assessment of aeroallergen sensitization

Specific IgE levels were measured for the following three inhalant allergens: house dust mite, cockroach and dog. Elevation of the total IgE level was defined as a total IgE level >100 kU/L [1617]. Positivity to allergen-specific IgE was defined as a specific IgE level >0.35 kU/L [1819]. We defined atopy (aeroallergen sensitization) as a positive response to at least one of the aeroallergens tested.

Statistical analysis

Continuous variables are presented as means with standard deviation. Logarithmic transformation was performed to normalize distribution of the insulin level, HOMA-IR, and IgE levels. We used one-way analysis of variance for continuous variables and the chi squared test for categorical variables; both were used to compare baseline characteristics. A multiple regression analysis was used to evaluate the risk of IgE elevation or atopy in relation to the degree of metabolic abnormality and obesity. The model was adjusted for age, smoking status, drinking habits, physical activity, and vitamin D levels.

RESULTS

Baseline characteristics of study subjects

Table 1 shows the baseline characteristics of the study subjects. Among the 1,700 participants, there were 545 premenopausal women, 332 postmenopausal women, and 823 men. Premenopausal women had a lower BMI than postmenopausal women and men. There was no significant difference regarding insulin resistance among groups. Total and allergen-specific levels of IgE were higher in men than in women in accordance with previous studies [2021].

Association between atopy and obesity or insulin resistance

Tables 2 and 3 show the association between IgE levels and the degree of obesity or insulin resistance, respectively among the three study groups. In premenopausal women, the levels of total IgE, cockroach-specific IgE, and dog-specific IgE were higher in obese participants than in nonobese participants (Table 2). In contrast, there was no significant association between obesity and the levels of IgE in postmenopausal women and in men, except for cockroach-specific IgE in men. Additionally, insulin resistance was associated with significantly higher levels of total and all types of allergen-specific IgE in premenopausal women (Table 3), while the association between insulin resistance and IgE levels was insignificant among postmenopausal women and men.

Risk of increased IgE and atopy according to obesity and metabolic health status

The odds ratios (ORs) for increased IgE levels and atopy according to obesity status and insulin resistance are presented in Fig. 1. Overall, 728 out of 1,700 subjects showed atopy (MHNO, n=412; MUNO, n=84; MHO, n=134; MUO, n=98). In premenopausal women, the MUNO group had a significantly higher risk of increased total IgE than the MHNO group after adjusting for age, smoking status, drinking habits, physical activity, and vitamin D levels (OR, 2.271; 95% confidence interval [CI], 1.201 to 4.294), while there was no significant difference between the MHO and MHNO groups (OR, 1.435; 95% CI, 0.656 to 3.137). The MUNO, but not the MHO phenotype was also associated with atopy (OR, 2.157; 95% CI, 1.284 to 3.625). In contrast, ORs of MUO individuals in postmenopausal women or men did not differ from those of the MHNO group.

DISCUSSION

This study found that obesity and increased insulin resistance are associated with raised serum levels of total and allergic specific IgE in premenopausal women but not in postmenopausal women or in men. In addition, further classification of obesity according to metabolic health status revealed that MUNO status increased the risk of allergic disease in premenopausal individuals, whereas MHO status did not show any increased risk, suggesting that obesity is related to increased IgE levels and atopy through mechanisms that are involved in the development of insulin resistance in premenopausal women.
Several studies have investigated the effects of insulin resistance as a common factor underlying asthma, atopy, and obesity [12222324]. Husemoen et al. [12], reported that obesity was associated with increased risk of aeroallergen sensitization in a Danish population-based study. However, the association between obesity and aeroallergen sensitization became insignificant after adjusting for insulin resistance, suggesting that insulin resistance is an effect modifier, similar to our results. In another study on the Danish population, insulin resistance was also associated with an increased risk of asthma like symptoms [24]. Conversely, insulin resistance was not found to be a risk factor for atopy or asthma in a study based on a nationally representative American adult population [23]. Ma et al. [23] proposed that the differences between these studies might be attributed to differences in the study population. However, in a more recent study also conducted on the American population [22], the association between insulin resistance and asthma was robust, suggesting that a difference in study population could not explain the incongruent results. In our study, we performed analyses independently according to sex and menopausal status and found that insulin resistance correlated positively with atopy in premenopausal women alone. Our findings indicate that sex and difference in menstrual status in women in determining the risk of atopy are important.
The predominant association between obesity and allergic disease in women has been reported previously in several studies [2526]. Although the reason why this association is found in women alone is presently unclear, previous studies provide some insights that might explain this. First, we can assume that differences in body composition between men and women may be a potential factor. For a given BMI, women have been reported to have a higher proportion of fat mass [2728]. Thus, higher levels of adipokines from fat tissues might be associated with a higher prevalence of allergic disease in obese women [4]. Another possible explanation for the greater correlation in premenopausal women could be found in a report by Hamano et al. [29]. In their study, pre-incubation with estradiol significantly increased the production of prototypical type 2 cytokines, interleukin-4 (IL-4) and IL-13 from antigen-sensitized peripheral blood mononuclear cells. This suggests that female hormones can exacerbate pre-existing allergic responses. However, the role of sex in pathophysiology of allergic diseases need to be further clarified.
In our study, the absolute levels of serum IgE were found to be significantly higher in men than in women (Table 1). The sex disparity of IgE levels observed in our study has also been previously reported [202130]. The underlying reasons that might explain this sex disparity include male specific genetic polymorphism [3132].
Insulin resistance can affect atopy through several possible mechanisms. Subjects with insulin resistance show higher level of plasma IL-6 than insulin sensitive subjects [33]. In addition, toll-like receptors (TLR) 2 and TLR4 have been reported to be key mediators of insulin resistance [3435]. Since IL-6 and activation of TLR2 and TLR4 are known to promote T helper type 2 differentiation [3637], stimulation of these receptors and subsequent cytokines released might induce allergic sensitization or exacerbation of allergic diseases. Interestingly, a recent study showed a beneficial effect of metformin, a well-known oral hypoglycemic agent with insulin sensitizing properties, on asthma related outcomes [38]. Whether treatment with metformin also reduces atopy needs to be investigated.
Our study has some limitations. First, as this study was cross-sectional, we could not evaluate causal relationships. Second, we only used HOMA-IR to define a metabolically healthy condition. There have been several criteria suggested for the definition of MHO [39] and there is currently a lack of consensus on the standard definition of metabolic health. Thus, future studies with different definitions of MHO may clarify the association between metabolic health and atopy. Third, we could not take the use of medications into consideration in our study. As several medications can affect insulin resistance, this might have influenced the HOMA-IR levels resulting in misclassification of metabolic status. Last, insufficient number of participants in subgroups could induce false negative results due to inadequate statistical power [40]. Indeed, premenopausal women in MUO group did not show significant difference in the risk of atopy compared to those in MHNO group although there was a slightly higher risk in the former. Despite these limitations, this study is the first attempt at comparing the risk of atopy using criteria of metabolic/obesity status. This strategy clarifies the effects of insulin resistance on atopy in both the obese and the nonobese groups.
In conclusion, our findings indicate that insulin resistance but not obesity itself is associated with atopy as well as increased total IgE levels in premenopausal women. Further studies are warranted to unravel the underlying mechanisms of influence of insulin resistance on atopy and the observed female predominance in the association. In addition, prospective and experimental studies to investigate the effects of insulin sensitization on atopy may provide further insights into the role of insulin resistance.

Notes

CONFLICTS OF INTEREST

No potential conflict of interest relevant to this article was reported.

AUTHOR CONTRIBUTIONS

Conception or design: S.E.L., J.Y.B., E.H.K.

Acquisition, analysis, or interpretation of data: S.E.L., J.Y.B., K.H., E.H.K.

Drafting the work or revising: S.E.L., J.Y.B., E.H.K.

Final approval of the manuscript: S.E.L., J.Y.B., K.H., E.H.K.

FUNDING

None

ACKNOWLEDGMENTS

None

References

1. NCD Risk Factor Collaboration (NCD-RisC). Trends in adult body-mass index in 200 countries from 1975 to 2014: a pooled analysis of 1698 population-based measurement studies with 19·2 million participants. Lancet. 2016; 387:1377–1396.
pmid
2. Shin HY, Kang HT. Recent trends in the prevalence of underweight, overweight, and obesity in Korean adults: The Korean National Health and Nutrition Examination Survey from 1998 to 2014. J Epidemiol. 2017; 27:413–419.
crossref pmid pmc
3. Baik I. Forecasting obesity prevalence in Korean adults for the years 2020 and 2030 by the analysis of contributing factors. Nutr Res Pract. 2018; 12:251–257.
crossref pmid pmc
4. Shore SA. Obesity and asthma: possible mechanisms. J Allergy Clin Immunol. 2008; 121:1087–1093.
crossref pmid
5. Chen Y, Dales R, Jiang Y. The association between obesity and asthma is stronger in nonallergic than allergic adults. Chest. 2006; 130:890–895.
crossref
6. Boulet LP. Obesity and atopy. Clin Exp Allergy. 2015; 45:75–86.
crossref
7. Bhaskaran K, Dos-Santos-Silva I, Leon DA, Douglas IJ, Smeeth L. Association of BMI with overall and cause-specific mortality: a population-based cohort study of 3·6 million adults in the UK. Lancet Diabetes Endocrinol. 2018; 6:944–953.
crossref pmid pmc
8. Stefan N, Haring HU, Hu FB, Schulze MB. Metabolically healthy obesity: epidemiology, mechanisms, and clinical implications. Lancet Diabetes Endocrinol. 2013; 1:152–162.
crossref pmid
9. Phillips CM. Metabolically healthy obesity: definitions, determinants and clinical implications. Rev Endocr Metab Disord. 2013; 14:219–227.
crossref pmid
10. Bell JA, Kivimaki M, Hamer M. Metabolically healthy obesity and risk of incident type 2 diabetes: a meta-analysis of prospective cohort studies. Obes Rev. 2014; 15:504–515.
crossref pmid pmc
11. Eckel N, Meidtner K, Kalle-Uhlmann T, Stefan N, Schulze MB. Metabolically healthy obesity and cardiovascular events: a systematic review and meta-analysis. Eur J Prev Cardiol. 2016; 23:956–966.
crossref pmid
12. Husemoen LL, Glumer C, Lau C, Pisinger C, Mørch LS, Linneberg A. Association of obesity and insulin resistance with asthma and aeroallergen sensitization. Allergy. 2008; 63:575–582.
crossref pmid
13. Kim Y. The Korea National Health and Nutrition Examination Survey (KNHANES): current status and challenges. Version 2. Epidemiol Health. 2014; 36:e2014002.
14. Lee SH, Ha HS, Park YJ, Lee JH, Yim HW, Yoon KH, et al. Identifying metabolically obese but normal-weight (MONW) individuals in a nondiabetic Korean population: the Chungju Metabolic disease Cohort (CMC) study. Clin Endocrinol (Oxf). 2011; 75:475–481.
crossref pmid
15. Meigs JB, Wilson PW, Fox CS, Vasan RS, Nathan DM, Sullivan LM, et al. Body mass index, metabolic syndrome, and risk of type 2 diabetes or cardiovascular disease. J Clin Endocrinol Metab. 2006; 91:2906–2912.
crossref pmid
16. Marsh DG, Bias WB, Ishizaka K. Genetic control of basal serum immunoglobulin E level and its effect on specific reaginic sensitivity. Proc Natl Acad Sci U S A. 1974; 71:3588–3592.
crossref pmid pmc
17. Kim EJ, Kwon JW, Lim YM, Yoon D, Seo JH, Chang WS, et al. Assessment of total/specific IgE levels against 7 inhalant allergens in children aged 3 to 6 years in seoul, Korea. Allergy Asthma Immunol Res. 2013; 5:162–169.
crossref pmid pmc
18. Vieira VJ, Ronan AM, Windt MR, Tagliaferro AR. Elevated atopy in healthy obese women. Am J Clin Nutr. 2005; 82:504–509.
crossref pmid
19. Burney P, Malmberg E, Chinn S, Jarvis D, Luczynska C, Lai E. The distribution of total and specific serum IgE in the European Community Respiratory Health Survey. J Allergy Clin Immunol. 1997; 99:314–322.
pmid
20. Jarvis D, Luczynska C, Chinn S, Burney P. The association of age, gender and smoking with total IgE and specific IgE. Clin Exp Allergy. 1995; 25:1083–1091.
21. Visness CM, London SJ, Daniels JL, Kaufman JS, Yeatts KB, Siega-Riz AM, et al. Association of obesity with IgE levels and allergy symptoms in children and adolescents: results from the National Health and Nutrition Examination Survey 2005-2006. J Allergy Clin Immunol. 2009; 123:1163–1169.
crossref pmid pmc
22. Cardet JC, Ash S, Kusa T, Camargo CA Jr, Israel E. Insulin resistance modifies the association between obesity and current asthma in adults. Eur Respir J. 2016; 48:403–410.
crossref pmid pmc
23. Ma J, Xiao L, Knowles SB. Obesity, insulin resistance and the prevalence of atopy and asthma in US adults. Allergy. 2010; 65:1455–1463.
crossref pmid
24. Thuesen BH, Husemoen LL, Hersoug LG, Pisinger C, Linneberg A. Insulin resistance as a predictor of incident asthma-like symptoms in adults. Clin Exp Allergy. 2009; 39:700–707.
crossref pmid
25. Beckett WS, Jacobs DR Jr, Yu X, Iribarren C, Williams OD. Asthma is associated with weight gain in females but not males, independent of physical activity. Am J Respir Crit Care Med. 2001; 164:2045–2050.
crossref pmid
26. Chen Y, Dales R, Tang M, Krewski D. Obesity may increase the incidence of asthma in women but not in men: longitudinal observations from the Canadian National Population Health Surveys. Am J Epidemiol. 2002; 155:191–197.
crossref pmid
27. Schorr M, Dichtel LE, Gerweck AV, Valera RD, Torriani M, Miller KK, et al. Sex differences in body composition and association with cardiometabolic risk. Biol Sex Differ. 2018; 9:28.
crossref pmid pmc
28. Gallagher D, Visser M, Sepulveda D, Pierson RN, Harris T, Heymsfield SB. How useful is body mass index for comparison of body fatness across age, sex, and ethnic groups? Am J Epidemiol. 1996; 143:228–239.
crossref pmid
29. Hamano N, Terada N, Maesako K, Hohki G, Ito T, Yamashita T, et al. Effect of female hormones on the production of IL-4 and IL-13 from peripheral blood mononuclear cells. Acta Otolaryngol Suppl. 1998; 537:27–31.
pmid
30. Paula Couto TA, Falsarella N, Mattos Cde C, Mattos LC. Total IgE plasma levels vary according to gender and age in Brazilian patients with allergic rhinitis. Clinics (Sao Paulo). 2014; 69:740–744.
pmid pmc
31. Raby BA, Soto-Quiros ME, Avila L, Lake SL, Murphy A, Liang C, et al. Sex-specific linkage to total serum immunoglobulin E in families of children with asthma in Costa Rica. Hum Mol Genet. 2007; 16:243–253.
crossref pmid
32. Yang KD, Ou CY, Hsu TY, Chang JC, Chuang H, Liu CA, et al. Interaction of maternal atopy, CTLA-4 gene polymorphism and gender on antenatal immunoglobulin E production. Clin Exp Allergy. 2007; 37:680–687.
crossref
33. Kern PA, Ranganathan S, Li C, Wood L, Ranganathan G. Adipose tissue tumor necrosis factor and interleukin-6 expression in human obesity and insulin resistance. Am J Physiol Endocrinol Metab. 2001; 280:E745–E751.
crossref
34. Kuo LH, Tsai PJ, Jiang MJ, Chuang YL, Yu L, Lai KT, et al. Toll-like receptor 2 deficiency improves insulin sensitivity and hepatic insulin signalling in the mouse. Diabetologia. 2011; 54:168–179.
crossref pmid
35. Shi H, Kokoeva MV, Inouye K, Tzameli I, Yin H, Flier JS. TLR4 links innate immunity and fatty acid-induced insulin resistance. J Clin Invest. 2006; 116:3015–3025.
crossref pmid pmc
36. Phipps S, Lam CE, Foster PS, Matthaei KI. The contribution of toll-like receptors to the pathogenesis of asthma. Immunol Cell Biol. 2007; 85:463–470.
crossref pmid
37. Doganci A, Sauer K, Karwot R, Finotto S. Pathological role of IL-6 in the experimental allergic bronchial asthma in mice. Clin Rev Allergy Immunol. 2005; 28:257–270.
crossref pmid
38. Li CY, Erickson SR, Wu CH. Metformin use and asthma outcomes among patients with concurrent asthma and diabetes. Respirology. 2016; 21:1210–1218.
crossref pmid
39. Kang YM, Jung CH, Jang JE, Hwang JY, Kim EH, Park JY, et al. The association of incident hypertension with metabolic health and obesity status: definition of metabolic health does not matter. Clin Endocrinol (Oxf). 2016; 85:207–215.
crossref pmid
40. Song F, Bachmann MO. Cumulative subgroup analysis to reduce waste in clinical research for individualised medicine. BMC Med. 2016; 14:197.
crossref pmid pmc
Fig. 1

Odds ratio for (A) increased serum immunoglobulin E (IgE) and (B) atopy according to the metabolic status and obesity. The study population was stratified by sex and menopausal status. MHNO, metabolically healthy nonobese; MUNO, metabolically unhealthy nonobese; MHO, metabolically healthy obese; MUO, metabolically unhealthy obese.
dmj-2019-0150f1.tif
dmj-2019-0150f2.tif
Table 1.
Clinical and demographic characteristics of the study population
Characteristic Premenopausal women (n=545) Postmenopausal women (n=332) Men (n=823) P value
Age, yr 35.3±0.4a,b 61.2±0.8b,c 42.5±0.6a,c <0.001
BMI, kg/m2 22.6±0.2a,b 24.5±0.3c 24±0.1c <0.001
Waist circumference, cm 74.8±0.5a,b 82.3±0.7c 83.6±0.46c <0.001
Ever smoker, % 12.8 (1.9)b 8.3 (2.4)b 76.1 (1.8)a,c <0.001
Heavy drinker, % 3.4 (1.1)b 0.9 (0.6)b 16.4 (1.5)a,c <0.001
Physically active subjects, % 18.3 (1.8)b 23.8 (3.4) 29.8 (1.9)c <0.001
25-hydroxyvitamin D, ng/mL 16±0.4a,b 18.4±0.6c 19.4±0.46c <0.001
Insulin resistance
 HOMA-IR 2.19 (2.09–2.29) 2.26 (2.14–2.39) 2.19 (2.11–2.28) 0.559
 Insulin, µIU/mL 9.91 (9.52–10.31) 9.7 (9.26–10.17) 9.58 (9.27–9.9) 0.417
Allergen sensitization
 Total IgE, kU/L 59.8 (51.9–69)b 62.3 (50.1–77.5)b 128.4 (113.5–145.3)a,c <0.001
  Dust mite-specific IgE, kU/L 0.177 (0.14–0.222)a,b 0.09 (0.066–0.121)b,c 0.36 (0.296–0.438)a,c <0.001
  Cockroach-specific IgE, kU/L 0.067 (0.057–0.078)b 0.064 (0.053–0.078)b 0.137 (0.12–0.157)a,c <0.001
  Dog-specific IgE, kU/L 0.026 (0.022–0.029)b 0.022 (0.019–0.025)b 0.039 (0.034–0.045)a,c <0.001

Values are presented as mean±standard deviation, number (%), or geometric mean (95% confidence interval).

BMI, body mass index; HOMA-IR, homeostatic model assessment of insulin resistance; IgE, immunoglobulin E.

a P<0.001 vs. postmenopausal women,

b P<0.001 vs. men,

c P<0.001 vs. premenopausal women.

Table 2.
Association between BMI, total IgE, and allergen-specific IgE stratified by sex and menopausal status
BMI, kg/m2 HOMA-IR Total IgE, kU/L P value Dust mite-specific IgE, kU/L P value Cockroach-specific IgE, kU/L P value Dog-specific IgE, kU/L P value
Premenopausal women 0.015a 0.101 0.035a 0.042a
Underweight, <18.5 (n=50) 2.00 (1.90–2.11) 39.6 (26.9–58.3) 0.066 (0.032–0.134) 0.043 (0.032–0.057) 0.017 (0.012–0.023)
Healthy weight, 18.5–22.9 (n=306) 2.35 (2.11–2.61) 55.5 (46.2–66.8) 0.167 (0.121–0.231) 0.063 (0.052–0.077) 0.024 (0.020–0.029)
Overweight, 23.0–24.9 (n=85) 1.83 (1.65–2.04) 65.7 (46.7–92.5) 0.281 (0.136–0.581) 0.083 (0.056–0.125) 0.028 (0.022–0.036)
Obesity, ≥25.0 (n=104) 2.77 (2.52–3.04) 79.1 (57.4–108.9) 0.221 (0.118–0.415) 0.079 (0.056–0.111) 0.033 (0.023–0.046)
Postmenopausal women 0.333 0.581 0.598 0.536
Underweight, <18.5 (n=3) 1.92 (1.77–2.08) 77.5 (20.0–300.7) 0.047 (0.017–0.134) 0.062 (0.015–0.257) 0.015 (0.008–0.030)
Healthy weight, 18.5–22.9, (n=119) 2.28 (2.11–2.46) 54.2 (37.9–77.5) 0.077 (0.052–0.116) 0.065 (0.045–0.093) 0.021 (0.016–0.028)
Overweight, 23.0–24.9 (n=92) 1.34 (1.29–1.39) 50.5 (33.8–75.5) 0.097 (0.059–0.160) 0.069 (0.050–0.096) 0.020 (0.016–0.025)
Obesity, ≥25.0 (n=118) 2.62 (2.40–2.85) 70.2 (49.6–99.4) 0.093 (0.053–0.162) 0.057 (0.042–0.077) 0.024 (0.019–0.030)
Men 0.106 0.594 0.015a 0.668
Underweight, 18.5 (n=23) 1.83 (1.74–1.92) 56.1 (24.5–128.4) 0.096 (0.027–0.339) 0.072 (0.038–0.138) 0.023 (0.015–0.035)
Healthy weight, 18.5–22.9 (n=303) 2.20 (2.09–2.32) 128.1 (105.1–156.2) 0.386 (0.277–0.537) 0.124 (0.099–0.155) 0.040 (0.032–0.051)
Overweight, 23.0–24.9 (n=202) 1.73 (1.50–1.99) 126.7 (101.2–158.7) 0.350 (0.229–0.536) 0.120 (0.091–0.159) 0.037 (0.028–0.047)
Obesity, ≥25.0 (n=295) 2.71 (2.54–2.89) 147.2 (120.8–179.3) 0.363 (0.266–0.495) 0.177 (0.139–0.224) 0.040 (0.033–0.049)

Values are presented as geometric mean (95% confidence interval). Values of total and specific IgE levels were adjusted for age, vitamin D, smoking status, drinking status, and physical activity.

BMI, body mass index; IgE, immunoglobulin E; HOMA-IR, homeostatic model assessment of insulin resistance.

a P<0.05.

Table 3.
Association between HOMA-IR, total IgE, and allergen-specific IgE stratified by sex and menopausal status
Variable Total IgE, kU/L P value Dust mite-specific IgE, kU/L P value Cockroach-specific IgE, kU/L P value Dog-specific IgE, kU/L P value
Premenopausal women 0.009a 0.003a 0.003a 0.025a
 HOMA-IR Q1 48.1 (37.5–61.9) 0.094 (0.064–0.139) 0.054 (0.043–0.066) 0.018 (0.015–0.022)
 HOMA-IR Q2 55.8 (43.6–71.3) 0.203 (0.122–0.336) 0.060 (0.047–0.078) 0.032 (0.024–0.042)
 HOMA-IR Q3 55.8 (43.0–72.5) 0.137 (0.082–0.229) 0.066 (0.049–0.088) 0.024 (0.019–0.030)
 HOMA-IR Q4 81.7 (62.2–107.3) 0.343 (0.192–0.615) 0.092 (0.067–0.125) 0.031 (0.023–0.041)
Postmenopausal women 0.077 0.304 0.992 0.336
 HOMA-IR Q1 45.2 (30.1–67.8) 0.067 (0.036–0.125) 0.063 (0.041–0.096) 0.020 (0.014–0.027)
 HOMA-IR Q2 66.5 (43.5–101.7) 0.086 (0.048–0.153) 0.065 (0.045–0.094) 0.021 (0.016–0.027)
 HOMA-IR Q3 49.5 (31.3–78.5) 0.105 (0.048–0.231) 0.059 (0.043–0.082) 0.023 (0.016–0.031)
 HOMA-IR Q4 82.4 (56.5–120.1) 0.097 (0.062–0.152) 0.064 (0.042–0.098) 0.024 (0.018–0.031)
Men 0.178 0.311 0.250 0.371
 HOMA-IR Q1 130.3 (101.7–167.0) 0.325 (0.209–0.506) 0.133 (0.101–0.175) 0.037 (0.028–0.049)
 HOMA-IR Q2 103.0 (80.0–132.6) 0.254 (0.172–0.376) 0.118 (0.090–0.154) 0.035 (0.027–0.046)
 HOMA-IR Q3 145.9 (116.5–182.7) 0.520 (0.341–0.793) 0.147 (0.109–0.198) 0.042 (0.032–0.054)
 HOMA-IR Q4 148.6 (117.3–188.2) 0.358 (0.242–0.529) 0.155 (0.123–0.195) 0.042 (0.032–0.055)

Values are presented as geometric mean (95% confidence interval). Subjects were divided into four categories (Q1 to Q4), ranging from the lowest quartile group to the highest quartile group. Values of total and specific IgE levels were adjusted for age, vitamin D, smoking status, drinking status, and exercise.

HOMA-IR, homeostatic model assessment of insulin resistance; IgE, immunoglobulin E.

a P<0.05.

TOOLS
Similar articles