

 PDF
PDF Citation
 Print
Print


INTRODUCTION
Hyperglycemia on admission is a common feature of the early phase of an acute myocardial infarction (AMI) with or without diabetes [1], and is also a prognostic factor of the mortality rate [234]. However, an association between dysglycemia and myocardial injury or the cardiac dysfunction, which eventually leads to death, is unclear in AMI patients. In the current study, we aimed to determine the impact of dysglycemia on myocardial injury, the cardiac function, and 30-day mortality in AMI patients that underwent percutaneous coronary intervention (PCI).
Go to : 
METHODS
From October 2005 to January 2016, a total of 1,593 consecutive patients with an AMI who underwent a PCI at Yeungnam University Medical Center were enrolled. AMIs were diagnosed if the patients met the following criteria: (1) at least one positive cardiac biochemical marker of ischemia and (2) typical symptoms compatible with myocardial ischemia or new ischemic electrocardiographic changes, or imaging evidence of a new loss of viable myocardium, or new regional wall motion abnormality. This study was approved by the Institutional Review Board of the Yeungnam University Medical Center (No. 2019-08-037). Written informed consent by the patients was waived due to a retrospective nature of our study.
We classified all patients into five groups according to the initial plasma glucose level on admission: Group 1 (hypoglycemic, n= 5), ≤80 mg/dL; Group 2 (euglycemic, n=634), 81 to 140 mg/dL; Group 3 (mild hyperglycemic, n=492), 141 to 200 mg/dL; Group 4 (moderate hyperglycemic, n=229), 201 to 260 mg/dL; and Group 5 (severe hyperglycemic, n=233), ≥261 mg/dL. The plasma glucose was the random, non-fasting glucose level at the time of hospital admission, and cut-off levels of 140 and 200 mg/dL were used according to the diagnostic criteria of impaired glucose tolerance in the American Diabetes Association (ADA) guidelines [5], and then each group was stratified at an interval of 60 mg/dL, referring to the grouping methods in the previous study about the admission glucose and mortality in the Korea Acute Myocardial Infarction Registry [6]. Diabetes mellitus (DM) was defined by the patient-reported history, medical records, or a glycosylated hemoglobin (HbA1c) value of ≥6.5% or an oral glucose tolerance test during the admission period according to the ADA guidelines. The clinical, laboratory, and echocardiographic parameters and 30-day mortality were analyzed.
All statistical analyses were performed using IBM SPSS version 20.0 (IBM Co., Armonk, NY, USA). Continuous variables were compared using a one-way analysis of variance, Kruskal-Wallis test, independent Student's t-test, or Mann-Whitney U test. Categorical variables were compared using chi-square statistics or a Fisher's exact probability test. A P value <0.05 was considered statistically significant.
Go to :
RESULTS
The mean age was 64.9±12.0 years (Table 1). The mean admission glucose level was 68.4 mg/dL in Group 1, 116.6 mg/dL in Group 2, 166.1 mg/dL in Group 3, 225.2 mg/dL in Group 4, and 348.4 mg/dL in Group 5, respectively.
Table 1.
Baseline characteristics of the study subjects according to the admission glucose level
Values are presented as mean±standard deviation or number (%).
BMI, body mass index; STEMI, ST-segment elevation myocardial infarction; NSTEMI, non-ST-segment elevation myocardial infarction; DM, diabetes mellitus; BP, blood pressure; HDL-C, high-density lipoprotein cholesterol; LDL-C, low-density lipoprotein cholesterol; HbA1c, glycosylated hemoglobin.
![]()
We analyzed the relationships between the admission glucose and serum N-terminal probrain natriuretic peptide (NT-proBNP), peak troponin I, and peak aspartate aminotransferase (AST) levels and the white blood cell (WBC) count during the admission period (Table 2). The troponin I and WBC levels exhibited a positive linear relationship to the admission glucose level (P<0.001), but the NT-proBNP level (the highest value of 5,295.8 pg/mL was observed in Group 1) and AST levels did not. In the echocardiographic parameters, the left ventricular ejection fraction (LVEF) had a trend of an inverted U-shape, while the transmitral Doppler early filling velocity to tissue Doppler early diastolic mitral annular velocity (E/E') ratio exhibited a U-shape trend based on Group 2.
Table 2.
Laboratory and echocardiographic parameters and mortality rate according to the admission glucose level
| Variable | Group 1 | Group 2 | Group 3 | Group 4 | Group 5 | P value | |
|---|---|---|---|---|---|---|---|
| <80 mg/dL (n=5) | 81–140 mg/dL (n=634) | 141–200 mg/dL (n=492) | 201–260 mg/dL (n=229) | >260 mg/dL (n=233) | |||
| NT-proBNP, pq/mL | |||||||
| Total | 5,295.8 | 1,424.5 | 1,931.8 | 2,260.2 | 4,170.1 | <0.001 | |
| DMa | 12,911.5 | 2,308.2 | 3,181.5 | 2,797.4 | 4,616.5 | 0.009 | |
| Non-DMb | 218.7 | 1,301.2 | 1,397.3 | 1,530.3 | 2,109.3 | 0.698 | |
| P valuec | <0.001 | 0.012 | <0.001 | 0.002 | 0.005 | ||
| Troponin I, ng/mL | |||||||
| Total | 10.9 | 30.1 | 49.5 | 48.3 | 51.8 | <0.001 | |
| DM | 5.7 | 25.2 | 40.7 | 44.5 | 47.5 | 0.071 | |
| Non-DM | 14.3 | 30.7 | 53.3 | 53.5 | 71.9 | <0.001 | |
| P value | 0.088 | 0.591 | 0.169 | 0.374 | 0.033 | ||
| AST, IU/L | |||||||
| Total | 49.6 | 120.3 | 201.5 | 233.8 | 254.6 | 0.055 | |
| DM | 35.0 | 89.5 | 122.5 | 127.2 | 194.7 | 0.187 | |
| Non-DM | 59.3 | 124.6 | 235.3 | 380.5 | 533.1 | 0.002 | |
| P value | 0.210 | 0.191 | 0.108 | 0.005 | <0.001 | ||
| WBC, K/μL | |||||||
| Total | 7.1 | 9.7 | 10.5 | 11.0 | 12.7 | <0.001 | |
| DM | 6.9 | 9.3 | 10.2 | 10.7 | 12.2 | <0.001 | |
| Non-DM | 7.3 | 9.7 | 10.6 | 11.4 | 15.0 | <0.001 | |
| P value | 0.440 | 0.599 | 0.444 | 0.645 | 0.132 | ||
| LVEF, % | |||||||
| Total | 51.6 | 52.3 | 49.2 | 49.4 | 46.1 | <0.001 | |
| DM | 44.0 | 50.0 | 48.2 | 49.2 | 45.8 | 0.023 | |
| Non-DM | 56.7 | 52.6 | 49.7 | 49.7 | 47.8 | <0.001 | |
| P value | 0.136 | 0.802 | 0.399 | 0.525 | 0.729 | ||
| E/E’ ratio | |||||||
| Total | 16.2 | 12.1 | 12.6 | 13.6 | 15.1 | <0.001 | |
| DM | 23.4 | 13.9 | 13.6 | 13.9 | 15.3 | 0.046 | |
| Non-DM | 11.4 | 11.9 | 12.1 | 13.2 | 14.3 | 0.037 | |
| P value | 0.342 | <0.001 | 0.054 | 0.707 | 0.808 | ||
| Mortality, % | |||||||
| Total | 0.0 | 1.9 | 2.8 | 6.1 | 12.4 | <0.001 | |
| DM | 0.0 | 2.6 | 2.0 | 5.3 | 8.9 | <0.001 | |
| Non-DM | 0.0 | 1.8 | 3.2 | 7.3 | 29.3 | 0.055 | |
| P value | - | 0.751 | 0.410 | 0.482 | <0.001 | ||
![]()
In a subgroup analysis, all patients were divided into diabetic (n=551) and nondiabetic groups (n=1,042) (Table 2). In the nondiabetic groups, the troponin I, AST, and WBC levels had a positive linear relationship to admission glucose level. The troponin I and AST levels were higher in nondiabetics than diabetics in Group 5 (P=0.033 and P<0.001, respectively).
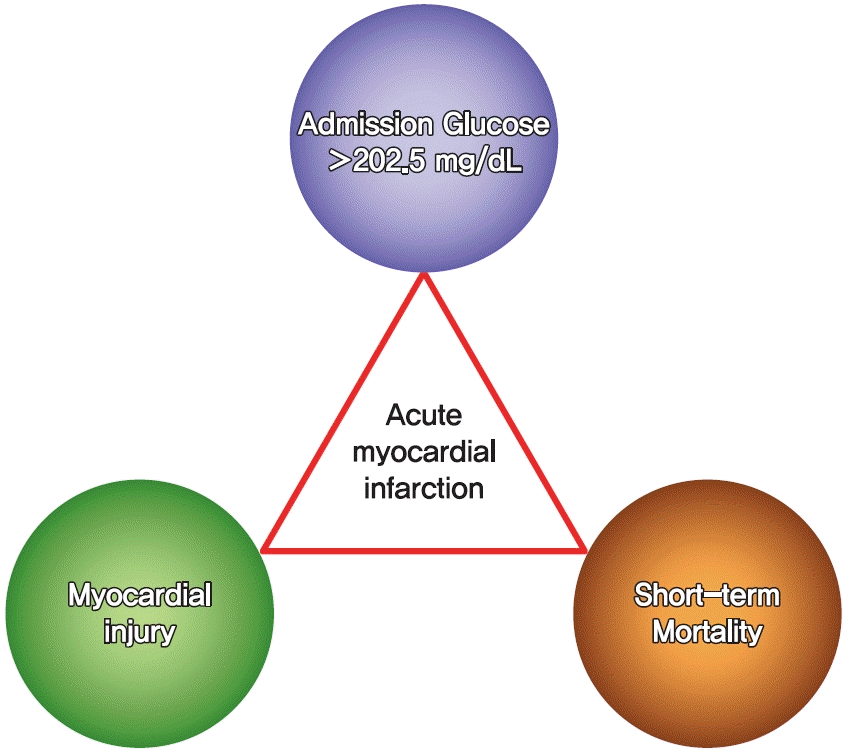
Among 1,593 patients, 69 (4.3%) died within 30 days. The 30-day mortality increased according to the groups (1.9% for Group 2, 2.8% for Group 3, 6.1% for Group 4, and 12.4% for Group 5, P<0.001) excluding Group 1. The cut-off value for predicting the 30-day mortality was 202.5 mg/dL (area under the curve 0.703, sensitivity 0.623, specificity 0.741, P<0.001). Forty out of 1,042 nondiabetics and 29 of 551 diabetics died within 30-days. In the nondiabetic groups, there was a linear correlation between the admission glucose level and 30-day mortality. Of note, in Group 5, the 30-day mortality in nondiabetics was higher than that in diabetics (P<0.001). The cut-off value for predicting the 30-day mortality was 174.5 mg/dL in nondiabetics and 208.5 mg/dL in diabetics.
Go to :
DISCUSSION
In this study, we chose the laboratory parameters, including the serum NT-proBNP, peak troponin I [78], and AST level [9], during admission as a marker of myocardial injury and the WBC count as a marker of myocardial inflammation [10]. Further, we also chose representative echocardiographic parameters, including the LVEF as a marker of the systolic cardiac function, and the E/E' ratio as a marker of the diastolic function [1112].
Previous studies reported that hyperglycemia is related to myocardial injury by analyzing the effects of a high admission glucose level on the LVEF at admission and discharge [13]. In this study, it was significant in that the factors more directly reflecting myocardial injury were used to demonstrate the connection between the blood glucose level and myocardial injury. This research also showed that a high admission glucose level during an AMI was related to a higher short-term mortality. As a result, the blood glucose level had the possibility of being used as an assisting factor for predicting myocardial injury and the short-term mortality during AMIs owing to the advantage it has in being able to be measured easily compared to the other factors.
In our research, severe hyperglycemia (Group 5) in the AMI patients was associated with a greater 30-day mortality in the nondiabetic group than diabetic group (P<0.001). Also, the troponin I and AST levels were higher in the nondiabetics, which meant the cardiac injury during hyperglycemia was more severe and stressful in nondiabetics than diabetics. Additionally, the mortality could be low in diabetics because the threshold of the blood glucose causing cell damage might increase in diabetics [14].
This study had several limitations. First, this study was a single center and retrospective study based on AMI patients with a PCI. Therefore, this data did not include patients who did not receive a PCI or who already died in the emergency room. Second, there was the possibility of other factors that could have affected the admission glucose level such as the food intake, meal time intervals, and amount of food. Finally, there was a limited number of patients in Group 1, so it was hard to assess the relationship between hypoglycemia and myocardial injury or dysfunction. Although the diabetic patients with admission hypoglycemia had the highest NT-proBNP level and E/E' ratio and worst LVEF in the subgroup analysis, we could not perform a mortality analysis because of the scanty number of patients in that subgroup.
In conclusion, dysglycemia, especially hyperglycemia, appears to be associated with myocardial injury, and could be another adjunctive parameter for predicting the mortality in patients with an AMI.
Go to :
 XML Download