

 PDF
PDF Citation
 Print
Print


Reliable assessment of folate status in clinical and non-clinical settings is greatly needed, as both deficiency and excessive exposure to folate can have serious adverse health effects [1, 2]. Folate status is frequently assessed by measuring the folate concentration in plasma using immunochemical assays available from various manufacturers [3]. The Roche Cobas e platform (Roche Diagnostics, Mannheim, Germany) is the most frequently used automated platform in Dutch hospitals according to external quality assessment schemes of the Dutch Foundation for Quality Assessment in Clinical Laboratories (SKML) [2, 4]. In the circulation, folate is mainly present in red blood cells (RBCs), and folate concentrations in RBCs are several fold higher than those in the plasma [5]. Consequently, there is a risk of overestimating folate concentration and underdiagnosing folate deficiency when measuring folate concentration in hemolytic plasma samples. However, to our knowledge, the effect of hemolysis on plasma folate concentration remains elusive, leaving many clinical laboratories uninformed about interpreting folate status in hemolytic samples. It is largely unknown how hemolysis affects folate analysis in samples with a low, medium, and high plasma folate concentration. Therefore, in the most elaborate study conducted thus far, we investigated the relationship between folate concentration and degree of hemolysis in patient samples using Roche Cobas 8000 platforms. We established an evidence-based approach that aids in the interpretation of the folate concentration in slightly hemolytic plasma samples and examined whether this interpretation depends on the plasma folate concentration. This study was approved by the Institutional Review Board of the University Medical Center Groningen, Groningen, the Netherlands (M20.262950).
Seventy-seven discarded and de-identified lithium heparin-anticoagulated plasma samples with a hemolysis index ≤10 μmol/L and corresponding EDTA-anticoagulated whole blood samples (i.e., from the same patient and sampling time) used for routine patient care were collected randomly and retrospectively over a six-month period (July to December 2019). These samples had already been transported from the clinical units and general practitioners to the laboratories of the University Medical Center Groningen and Isala and had undergone centrifugation (1,885×g for 5 minutes at 18°C), thus excluding a significant effect of either hemoglobin or folate from RBCs due to in vitro hemolysis. Hemolysates were prepared according to the osmotic shock procedure adapted from the CLSI guidelines (EP7-A2 and EP56) for interference analysis in clinical chemistry [6, 7]. Briefly, RBCs from 0.5 mL of whole blood were washed twice with a standard phosphate-buffered saline solution (VWR, Radnor, PA, USA) and hemolysates were obtained by adding 1 mL distilled water. Thereafter, all samples were stored in a dark container immediately at -80°C for at least 24 hours and were centrifuged before use.
Hemolysis was simulated by spiking the plasma samples with their corresponding hemolysate. To avoid any potential matrix effect, a three-level dose–response series was prepared for each patient by adding 2 μL (level 1), 4 μL (level 2), and 10 μL (level 3) of hemolysate to 198 μL, 196 μL, and 190 μL of plasma, respectively. The folate concentration and hemolysis index were analyzed at the University Medical Center Groningen on two Cobas 8000 platforms with c702 and e602 modules (Roche Diagnostics), and increments were calculated relative to the blank (i.e., unspiked) plasma. The CVfolate was 9.6% at a concentration of 6.3 nmol/L. Samples above the upper detection limit (folate >45.4 nmol/L) were excluded. The hemolysis index had a CV of 3.3%.
Hematology parameters [i.e., hemoglobin, RBC, mean corpuscular volume (MCV), and white blood cell count (WBC)] were measured on an XN-10 analyzer (Sysmex Corporation, Kobe, Japan). For hemoglobin and MCV, the inter-assay CV was 1.1% and 0.9%, respectively. Data analyses and computations were performed using SPSS 22.0 (IBM Corp., Armonk, NY, USA) and GraphPad Prism version 5.01 (GraphPad Software, San Diego, CA, USA). All data are presented as the median and interquartile range (IQR), because they were considered to be non-normally distributed. The potential influence of sample transportation, centrifugation, and cellular constitution (notably WBCs, which may alter the plasma fluid fraction [8] and may also contain folate [9, 10]) on baseline folate concentrations, and the potential associations of the baseline hemolysis index, RBC, and WBC with baseline folate concentration were analyzed using univariate and multivariate linear regression analyses.
Since hemolysis was previously reported to be associated with an increase in plasma folate concentration [11], the critical difference in the laboratory-specific plasma folate concentration (CDfolate) was calculated with the formula [12]: CDfolate =1.65 ×√2 ×CVfolate. Changes greater than the CDfolate were interpreted as interference due to the hemolysate. The CDfolate was used to calculate the hemolysis threshold from the regression equations of the relationships between the increments in folate concentration and hemolysis index in the dose–response series. To explore the effect of hemolysis on to the plasma folate concentration, the samples were divided into tertiles according to the plasma folate concentration, and hemolysis thresholds were analyzed using an independent-samples median test. A two-sided P < 0.05 indicated statistical significance. To determine the implications of the newly established hemolysis threshold for folate concentration reporting, which was recently adopted in our laboratory, we compared it to our previous practice, in which folate concentrations with a hemolysis index > 2 μmol/L were automatically flagged and reported with the cautionary comment “Hemolytic sample, result increased.” This comparison was based on a retrospective analysis, using folate concentrations and corresponding hemolysis indices reported over a one-yr period (April 1, 2019 to April 1, 2020). Folate concentrations in the plasma samples ranged from 2.9 to 30.9 nmol/L, with a median (IQR) of 11.4 (8.6–19.1) nmol/L. The median (IQR) hemolysis index was 4 (2–5) μmol/L. The folate concentration was not associated with the hemolysis index (standardized β= −0.07, P = 0.57; Table 1), indicating that the effect of a marginal degree of hemolysis on folate concentration in the plasma samples was negligible. The median (IQR) hemoglobin, RBC, MCV, and WBC in the whole blood samples were 129 (113–139) g/L, 4.2 (3.6–4.6)× 1012/L, 92 (88–95) fL, and 7.2 (5.7–8.8) × 109/L, respectively. Neither RBC nor WBC was associated with the baseline plasma folate concentration (Table 1).
Based on the combined analytical variation of the folate assays (9.6%), a CDfolate of 22% was calculated. The linear function describing the relationship between the increment in folate concentration (x) and hemolysis index (y) was defined as y= 1.86x + 1.56 (R2 = 0.996). The equation yielded a hemolysis threshold of 42 μmol/L for our laboratory. These data extend the existing literature [11] by providing a tangible approach for defining the acceptable degree of hemolysis, which considers the biological variation of plasma folate, RBC folate, and hemoglobin concentration. Our approach considers the fact that the hemolysis threshold is dependent on the analytical variation of the folate assay and may differ across laboratories.
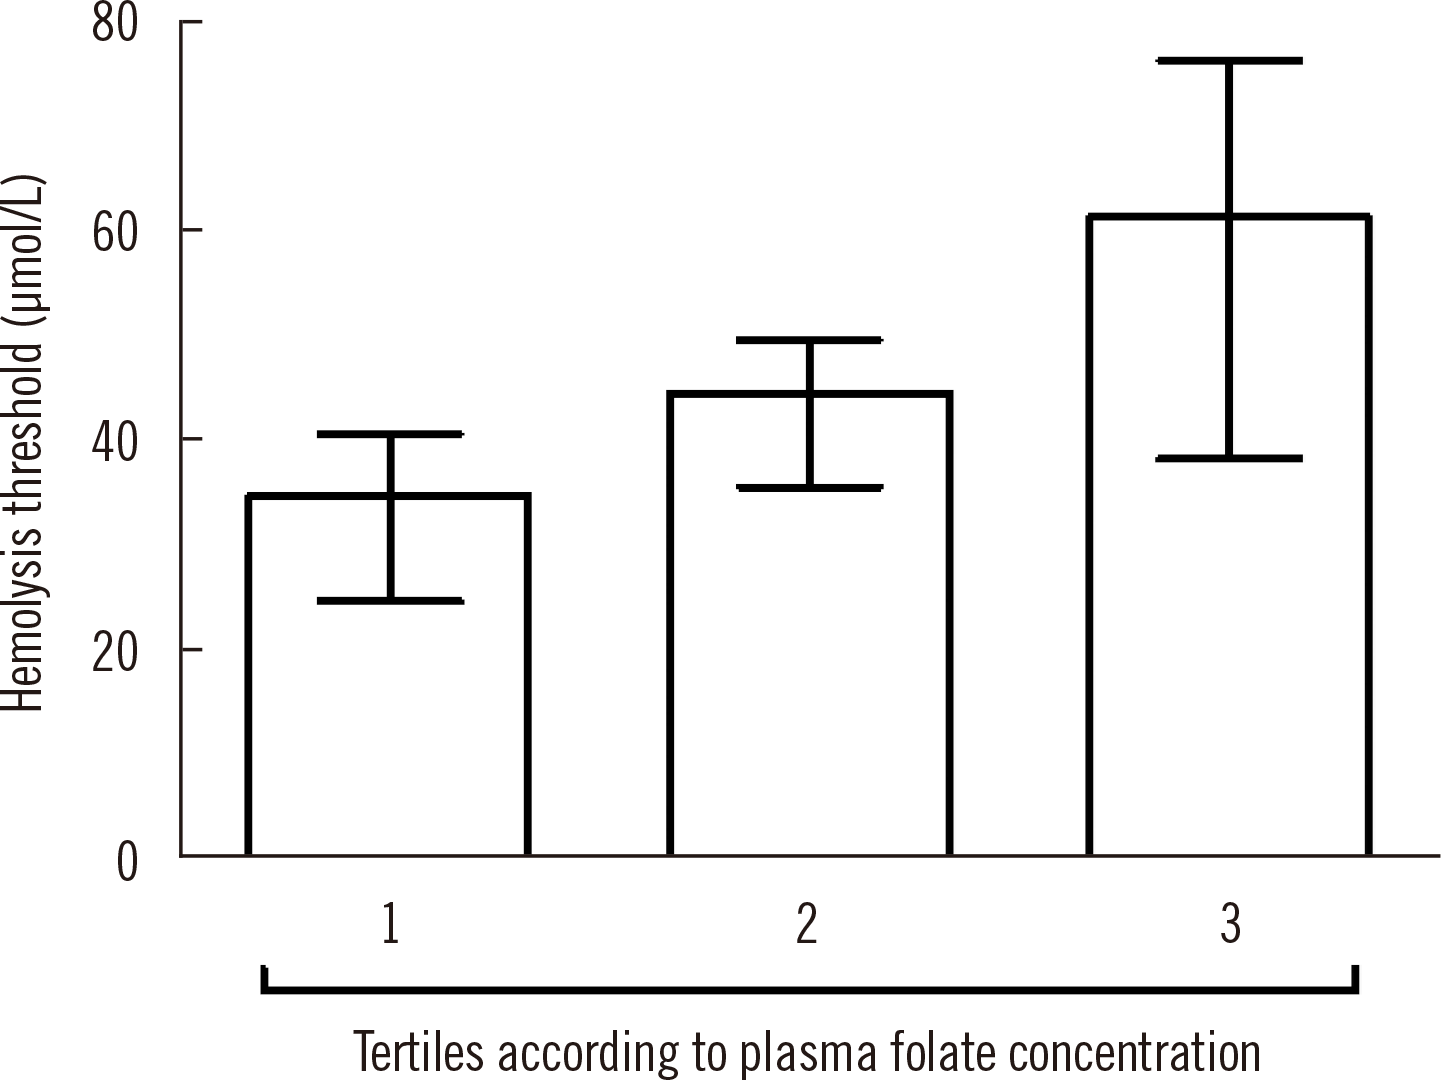
The median (IQR) hemolysis thresholds were not significantly different across tertiles of plasma folate concentration, at 35 (24–41), 44 (35–49), and 61 (39–77) μmol/L for the first, second, and third tertile, respectively (P = 0.10; Fig. 1). This was likely due to the large combined inter-individual variation of hemoglobin [13, 14] and RBC folate concentration [15].
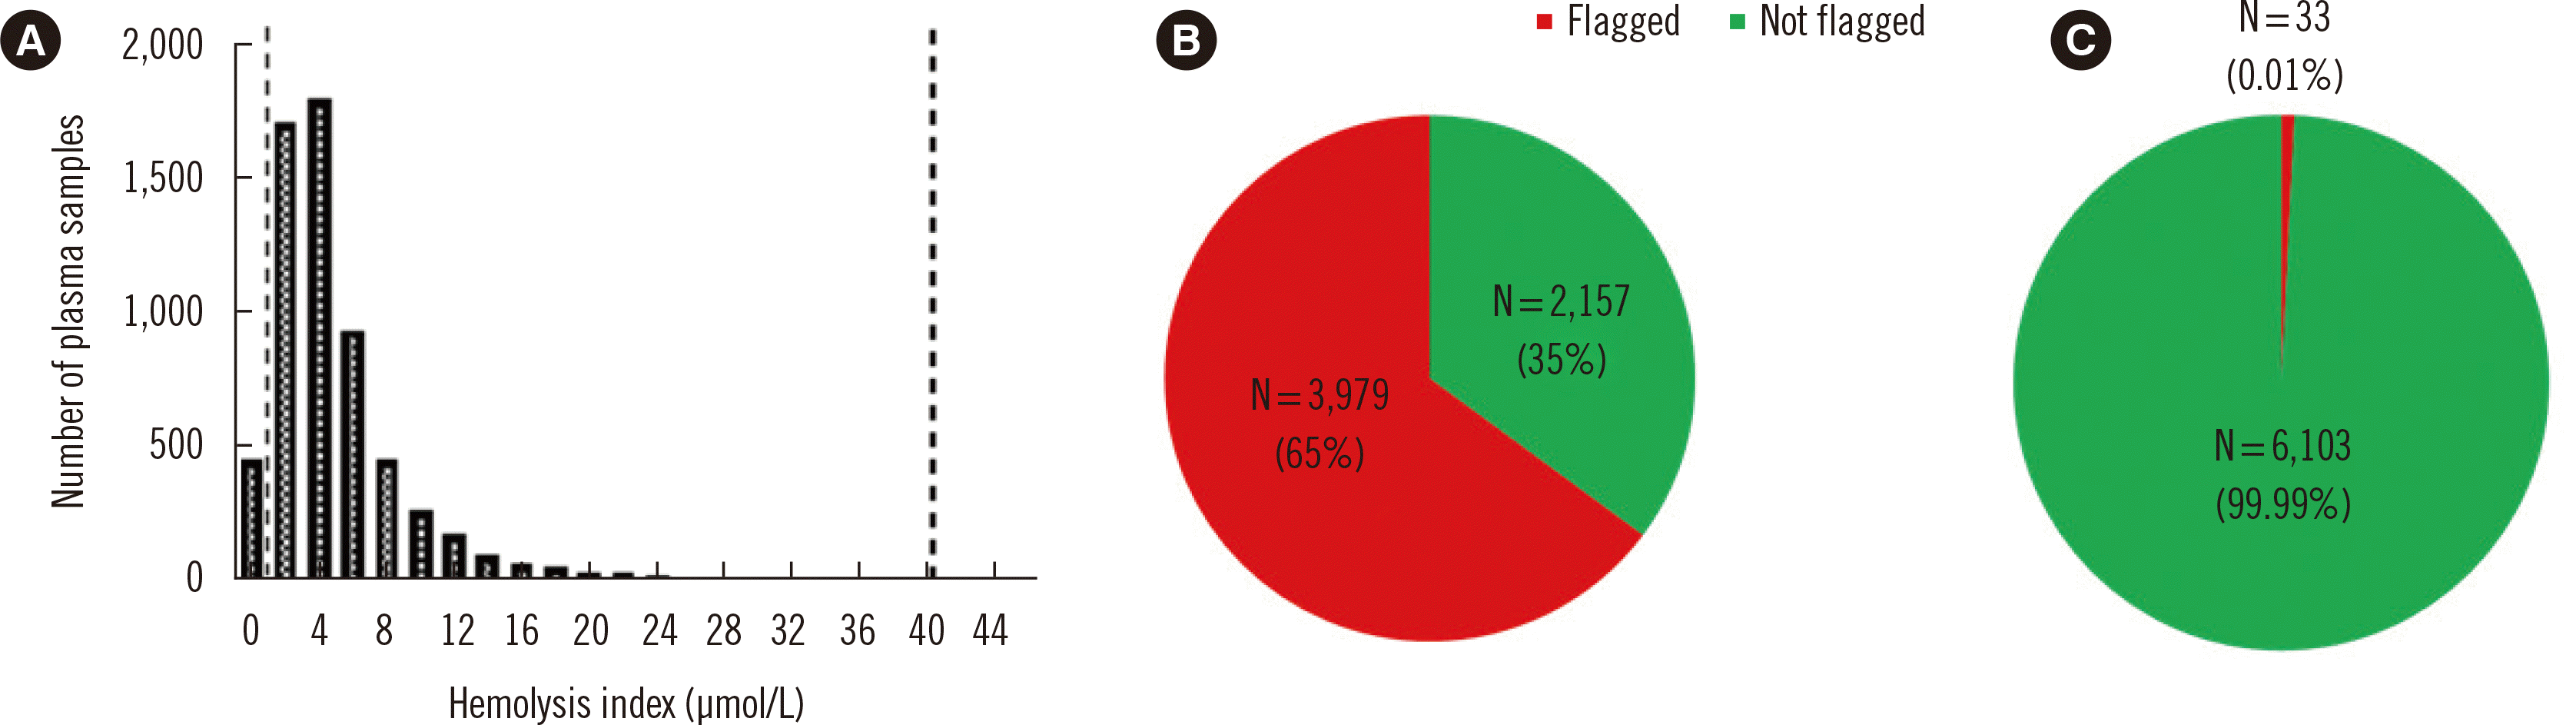
Over a one-year period, our laboratory performed 6,136 plasma folate concentration measurements. The hemolysis index followed a skewed distribution with a range of 0–201 μmol/L and a median (IQR) of 4 (2–5) μmol/L (Fig. 2). In 3,979 (65%) of the samples, the hemolysis index exceeded the hemolysis threshold of 2 μmol/L and, accordingly, the folate concentration was flagged. When a hemolysis threshold of 42 μmol/L was applied to the hemolysis index distribution, the flagging rate decreased to 0.01% (Fig. 2). The practical implications of the suggested approach may differ across laboratories, because they will depend on the current protocol used to assess and report the folate concentrations.
This study has several limitations. First, we only assessed plasma samples. Therefore, the suggested approach for calculating a hemolysis threshold should be used only when routine folate concentration is measured in plasma. Second, our data are based on the assumption that hemolysis assays represent everyday conditions of hemolytic samples transported from clinical units. Despite the swift preparation of hemolysates with a dose–response series and a single freeze–thaw cycle, we cannot fully exclude the possibility that a certain loss of reduced folates or incomplete dissociation of folates from cellular binding proteins may have occurred during preparation of the hemolysates [16]. However, both situations would also hold true in the case of in vitro hemolysis occurring during the day-to-day transport of plasma samples. Thus, the hemolysis assays performed in this study are likely a good reflection of the sample conditions in routine practice. Third, we did not have information on RBC folate concentrations because RBC folate is not a routine diagnostic modality in the Netherlands. However, this parameter may be useful when plasma and RBC concentrations are discordant or when patients consistently produce hemolytic plasma samples [17].
In conclusion, the relationship between the degree of hemolysis and change in plasma folate concentration can be approximated with the equation y= 1.86x+1.56, where x and y represent the laboratory-specific CDfolate and hemolysis threshold, respectively. The calculated hemolysis threshold can be used in-
dependent of the patient’s folate status.
 XML Download