Journal List > Ann Lab Med > v.41(5) > 1146668

Ahn, Park, Kim, Cho, Jang, Bae, Lee, Lee, Koh, and Im: Granulocytic and Monocytic Myeloid-Derived Suppressor Cells are Functionally and Prognostically Different in Patients with Chronic Myeloid Leukemia

Abstract

Myeloid-derived suppressor cells (MDSCs) represent phenotypically heterogeneous populations that suppress tumor-specific T-cell responses. MDSCs are produced from myeloid precursors in emergent states and are increased in several hematologic malignancies. We evaluated the differences in the levels and prognostic significance of MDSCs according to the clinical status of chronic myeloid leukemia (CML). The percentages and numbers of granulocytic (g)MDSCs and monocytic (m)MDSCs in peripheral blood (PB) and bone marrow (BM) aspirates were determined by five-color flow cytometry (HLA-DR/CD11b/CD15/CD33/CD14). The median BM-gMDSC% and PB-gMDSC% of the CML group were lower than those of the complete hematologic response (CHR) and control groups (P<0.001). In the CHR group, patients with major molecular response (MMR) showed higher median BM-gMDSC% than those without MMR (P=0.039). Conversely, the PB-mMDSC number of the CML group was higher than those of the CHR and control groups (P<0.001). Patients with high PB-gMDSC number exhibited superior survival to those with low PB-gMDSC number (P=0.021), and patients with high PB-mMDSC% showed inferior survival to those with low PB-mMDSC%, but there was no statistical significance (P=0.182). Increased gMDSCs at CHR may reflect non-leukemic granulopoiesis, and a high number of PB-gMDSCs suggests better prognosis in CML. However, mMDSCs may be associated with malignant conditions and poor prognosis.

Myeloid-derived suppressor cells (MDSCs) represent phenotypically heterogeneous myeloid cell population that are at different stages of development and have immune suppressive capability [1]. MDSCs are classified into two major subsets based on their phenotypic and morphologic features: granulocytic (g)MDSCs and monocytic (m)MDSCs [2]. In the bone marrow (BM), they represent 20%–30% of nucleated cells, whereas in the spleen, they represent 4% of total cells under normal physiological conditions [3]. Under pathological conditions, MDSCs maintain their immature status and accumulate in lymphoid organs and the circulatory system instead of differentiating into effector granulocytes, macrophages, and dendritic cells [4].
MDSCs can suppress immune cells, particularly, T cells, B cells, and natural killer cells [1]. Additionally, MDSCs are a major component of the tumor microenvironment and may alter BM niches, potentially contributing to the progression of myeloid malignancies [5]. Recently, MDSCs have been recognized as important immune regulators, potential biomarkers, and therapeutic targets in cancer and other diseases associated with chronic inflammation, including infection, autoimmunity, and trauma [6, 7]. An increase in MDSC numbers has been reported in several hematologic malignancies [8]; however, in CML, MDSCs have not been extensively studied [9, 10]. This is the first study to evaluate the differences in the levels and prognostic significance of MDSCs according to the clinical status of CML.
A total of 66 CML patients who were diagnosed at Asan Medical Center, Seoul, Korea, between August 2013 and December 2014 were consecutively enrolled in this prospective study. Patients with a prior history of any other malignancies, including hematologic and solid cancers, were excluded from the study. Peripheral blood (PB) and BM aspirates were obtained from the CML patients including the chronic, accelerated, and blast phases, and from the patients with complete hematologic response (CHR) after tyrosine kinase inhibitor (TKI) treatment. PB and BM aspirates were obtained from 11 patients at diagnosis and after treatment. Further, 40 PB samples were collected from age- and sex-matched healthy controls (HCs). Thirty-eight patients with non-Hodgkin lymphoma without BM involvement were recruited as the BM normal control (NC) group; 38 PB and BM aspirates were obtained from this group. All participants, including HCs and BM NCs, provided written informed consent. This study was approved by the Institutional Review Board of Asan Medical Center (S2018-1547-0008).
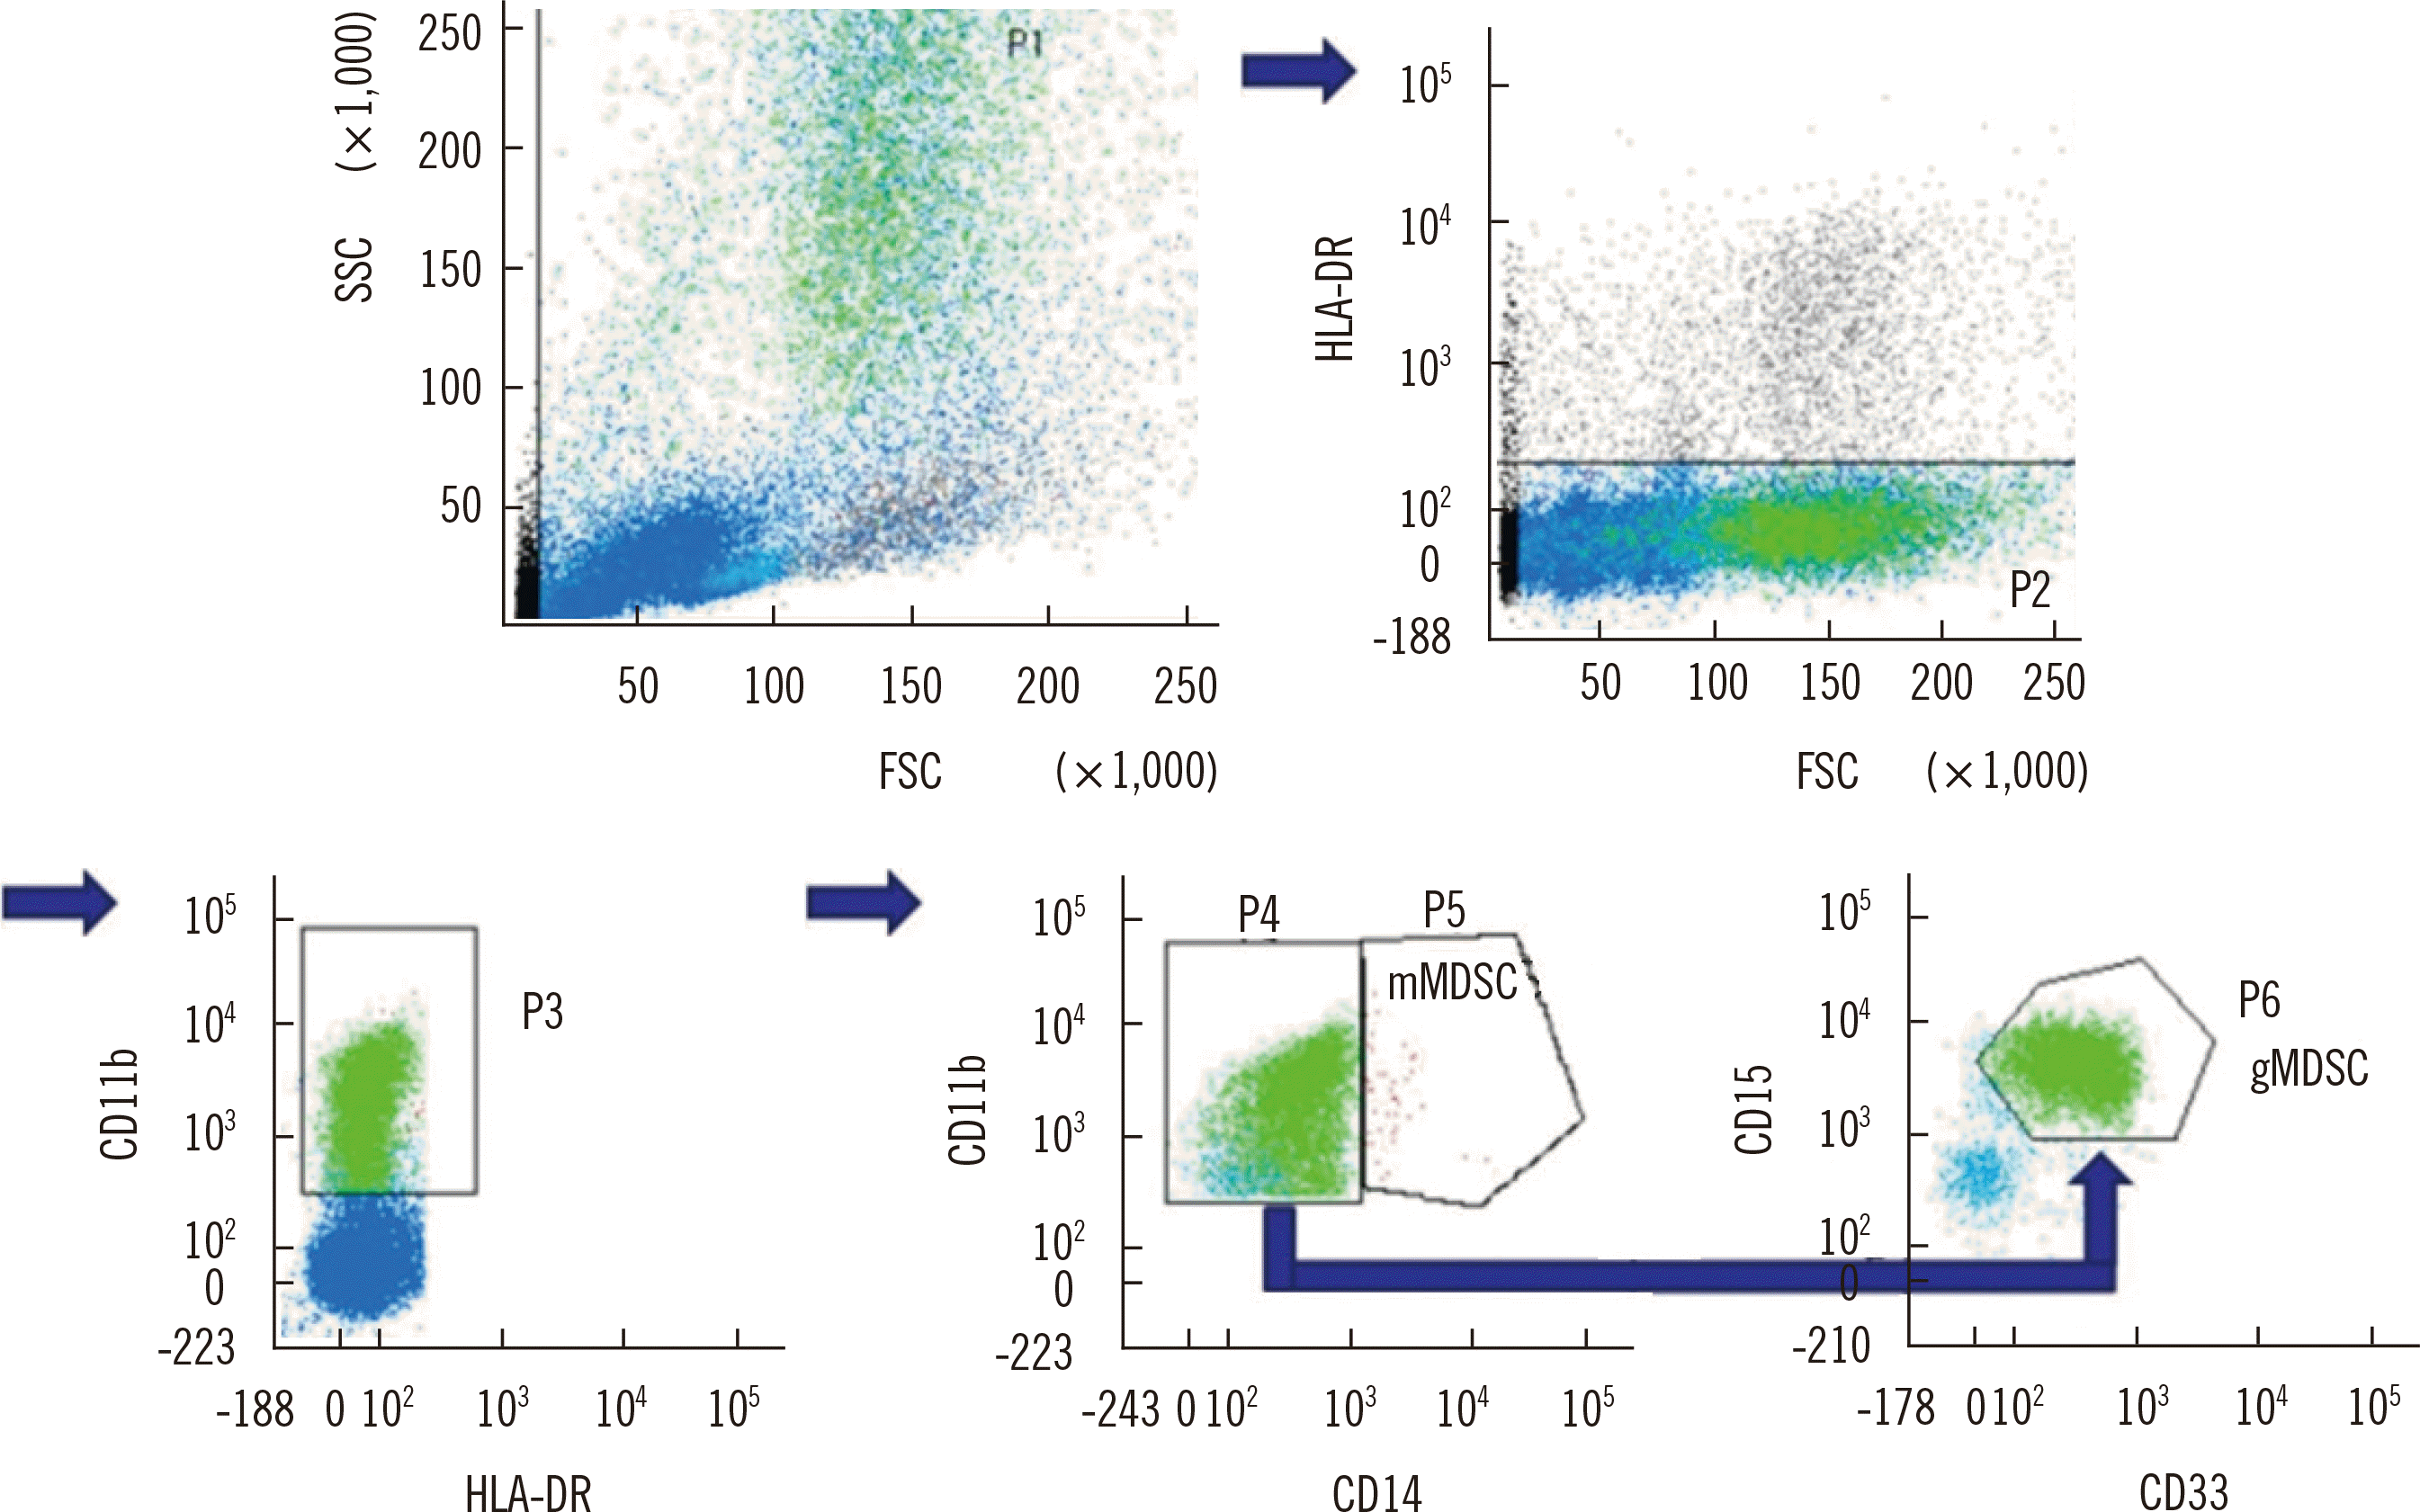
Fresh EDTA anti-coagulated PB and/or BM aspirate samples were collected. Nucleated cells (5×10⁴) were isolated and analyzed by flow cytometry using a FACSCanto II Flow Cytometer and FACSDiva software (Becton Dickinson, San Jose, CA, USA). The following monoclonal antibodies (Becton Dickinson) were used: fluorescein isothiocyanate-labeled anti-HLA-DR, phycoerythrin (PE)-labeled anti-CD11b, allophycocyanin-labeled anti-CD15, peridin chlorophyll protein complex-labeled anti-CD33, and PE-cyanine 7-labeled anti-CD14. Analysis was performed by manual serial gating, according to our protocol (Fig. 1).
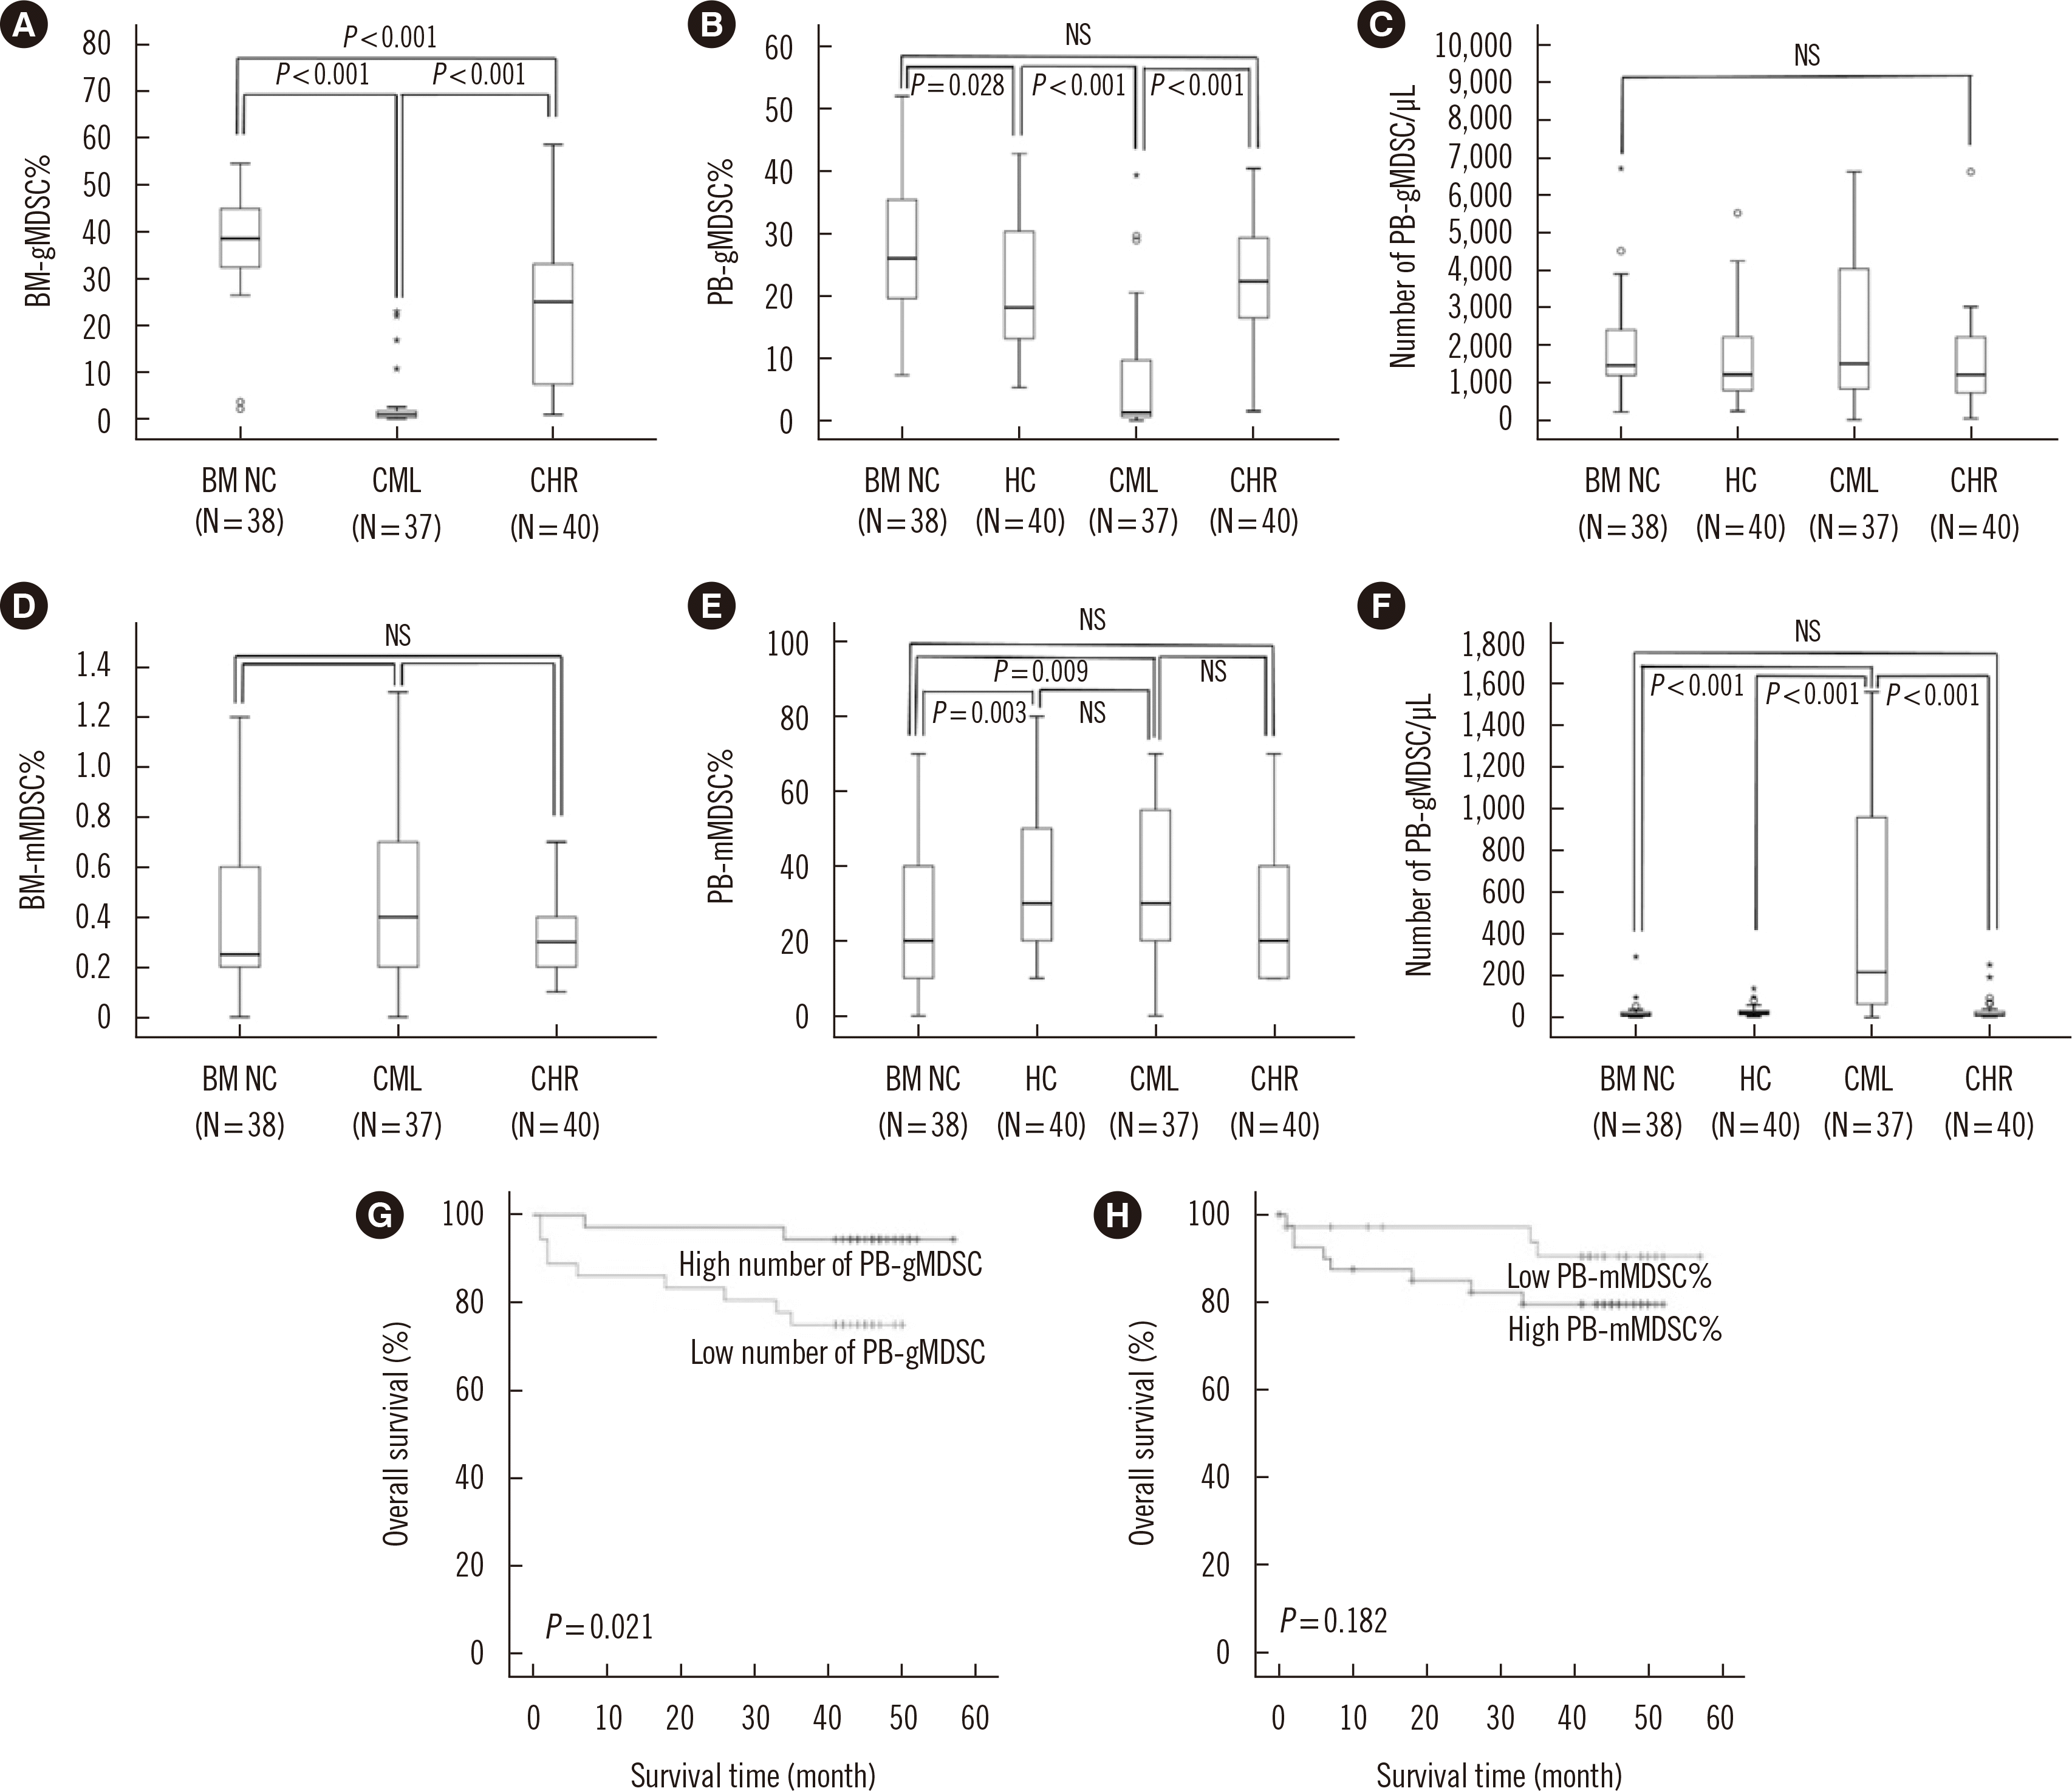
We measured the BM-gMDSC%, BM-mMDSC%, PB-gMDSC%, and PB-mMDSC%, and calculated the absolute numbers of PB-gMDSCs and PB-mMDSCs using the total white blood cell (WBC) count. CML patients were divided into high and low groups based on the median values of BM-gMDSC% (3.3%), BM-mMDSC% (0.35%), PB-gMDSC% (15.4%), PB-mMDSC% (0.3%), and the numbers of PB-gMDSCs (1,345.7/μL) and PB-mMDSCs (42.4/μL), and the survival between these two groups was compared. MDSC levels were analyzed and compared by Kruskal–Wallis test and Mann–Whitney test. The Spearman rank correlation test was used to analyze the correlation between MDSC and BCR-ABL1 levels, WBC and platelet counts, basophil%, blast%, and the hemoglobin level. We used Kaplan–Meier estimates to calculate the overall survival. The 3-year survival rates according to MDSC percentage or number were compared using the log-rank test. Statistical analyses were performed using SPSS version 21.0 (IBM Corp., Armonk, NY, USA). P<0.05 was considered significant.
The median BM-gMDSC% of the CML group was lower than that of the CHR and BM NC groups (P<0.001) (Fig. 2A). The median PB-gMDSC% of the CML group was also lower than that of the CHR, HC, and BM NC groups (P<0.001), and the median PB-gMDSC% at BM NC was higher than that of the HC group (P=0.028) (Fig. 2B). However, the number of PB-gMDSCs did not differ between any of the groups (Fig. 2C). In the CHR groups, patients with major molecular response (MMR) (N=7) showed higher median BM-gMDSC% than those without MMR (N=28) (P=0.039). The BM-gMDSC% and PB-gMDSC% were negatively correlated with the BCR-ABL1 level, WBC count, basophil% (P<0.001, respectively), platelet count (P<0.001 and P=0.001, respectively), and blast% (P=0.012 and P=0.001, respectively), but positively correlated with the hemoglobin level (P<0.001) (Table 1).
The median BM-mMDSC% of the CML group was higher than that of the CHR and BM NC groups, but there was no statistical significance (Fig. 2D). The median PB-mMDSC% of the CML group was higher than that of the BM NC group (P=0.009) (Fig. 2E). The number of PB-mMDSCs of the CML group was higher than that of the CHR, HC, and BM NC groups (P<0.001) (Fig. 2F).
The median (25th–75th percentiles) follow-up duration was 45 (42–49) months. Patients with high PB-gMDSC number exhibited superior 3-year survival to those with low PB-gMDSC number (93.8% vs. 75.6%, P=0.021, Fig. 2G). However, the group with low PB-mMDSC% showed higher survival than the group with high PB-mMDSC%, but there was no statistical significance (90.4% vs. 79.5%, P=0.182, Fig. 2H).
MDSCs are generated from normal granulocyte or monocyte precursors under pathological conditions, such as cancer and chronic inflammation, under an increased demand for myeloid cells (emergency myelopoiesis) [11]. These conditions result in aberrant myelopoiesis characterized by the accumulation of immature myeloid cells that deviate from the normal differentiation path [2, 12].
Two types of signals are required for MDSC generation: expansion/mobilization signals and activation signals [11]. Growth factors, such as granulocyte-macrophage colony-stimulating factor (GM-CSF), G-CSF, and M-CSF, are associated with MDSC expansion/mobilization and immune suppression [811]. G-CSF administration to mobilize stem cells is accompanied by gMDSC expansion [13]. Proinflammatory mediators, such as cytokines and chemokines, including TGF-β, IL-1β, IL-6, IL-10, IL-12, IL-13, CCL2, CXCL5, and CXCL12, induce the upregulation of STAT3 in myeloid progenitors [11]. The activation signal is mediated by proinflammatory stimuli, such as lipopolysaccharides, PGE2, IL-1, and S100A8/A9, resulting in NF-κB upregulation and induction of the suppressive MDSC phenotype [11]. A recent study suggested that mMDSCs also arise from the reprogramming of monocytes through pathogen- or danger-associated molecular patterns and Toll-like receptor activation, and through certain cytokines and mediators [12].
The decreased number of gMDSCs in CML patients observed in our study is in contrast with findings of Giallongo, et al. [9, 10]. At the diagnosis of CML, leukemic granulocytes are differentiated from the leukemic stem cells of CML; however, a small number of gMDSCs might be generated from few remaining normal granulocytic precursors. As the normal granulocytic precursors recovered after TKI treatment, the BM-gMDSC% and PB-gMDSC% increased in the CHR phase. The negative correlation of PB-gMDSC% and BM-gMDSC% with the BCR-ABL1 level, WBC and platelet counts, basophil%, and blast%, and their positive correlation with the hemoglobin level suggest that the PB-gMDSC% and BM-gMDSC% in the CHR phase might reflect non-leukemic but aberrant granulopoiesis. The finding that the survival rate of the group with a high number of PB-gMDSCs was higher than that of the group with a low number of PB-gMDSCs strongly suggests that the presence of gMDSCs might reflect the recovery of normal granulocytic precursors after the treatment of CML.
mMDSCs, in contrast to gMDSCs, are generated from normal monocyte precursors, which are not affected in CML. In the present study, mMDSCs increased in the CML group and decreased in the CHR phase. The opposing results for mMDSCs and gMDSCs suggest that mMDSCs may be associated with the neoplastic clinical course of CML. The finding that the group with low PB-mMDSC% tended to show better survival than the group with high PB-mMDSC% is in line with the findings of Xu, et al. [14]. The levels of MDSCs, especially mMDSCs, were associated with the clinical status of CML, and mMDSCs promoted the proliferation of human CML cells and CD34+ stem cells [14].
gMDSCs and mMDSCs differ not only in morphology and immunophenotype but also in the mechanisms of their immunosuppressive functions [15]. The major difference lies in the use of non-antigen-specific vs. antigen-specific mechanisms [3]. gMDSCs require close cell–cell contact with T cells and the upregulation of reactive oxygen species [16]. However, mMDSCs can effectively suppress antigen-dependent T-cell responses without direct cell–cell contact via the upregulation of nitric oxide, arginase, and immunosuppressive cytokines, and other mechanisms [15]. Generally, the proportion of gMDSCs is higher than that of mMDSCs; nevertheless, some studies have suggested that on a cell basis, mMDSCs are more potent than gMDSCs [3, 1720]. This is consistent with our findings that a high number of PB-mMDSCs of the CML group was associated with poor prognosis.
In conclusion, the increased gMDSC number at CHR may indicate the regeneration of normal granulocytic precursors under emergent/aberrant myelopoietic conditions after TKI treatment, and a high number of gMDSCs suggests better prognosis in CML. However, a high number of mMDSCs may be associated with poor prognosis.

Notes

AUTHOR CONTRIBUTIONS

Study conception and design: Ahn A and Park CJ. Data acquisition, analysis, and interpretation: Ahn A, Park CJ, Kim MS, Cho YU, Jang S, Bae MH, Lee JH, Lee JH, Koh KN, Im HJ. Final approval of the manuscript: Ahn A, Park CJ, Kim MS, Cho YU, Jang S, Bae MH, Lee JH, Lee JH, Koh KN, Im HJ.

CONFLICTS OF INTEREST

None declared.

RESEARCH FUNDING

None declared.

REFERENCES

1. Bueno V, Sant'Anna OA, Lord JM. 2014; Ageing and myeloid-derived suppressor cells: possible involvement in immunosenescence and age-related disease. Age (Dordr). 36:9729. DOI: 10.1007/s11357-014-9729-x. PMID: 25399072. PMCID: PMC4233024.
crossref pmid pmc
2. Bronte V, Brandau S, Chen S-H, Colombo MP, Frey AB, Greten TF, et al. 2016; Recommendations for myeloid-derived suppressor cell nomenclature and characterization standards. Nat Commun. 7:12150. DOI: 10.1038/ncomms12150. PMID: 27381735. PMCID: PMC4935811.
crossref
3. Youn JI, Nagaraj S, Collazo M, Gabrilovich DI. 2008; Subsets of myeloid-derived suppressor cells in tumor-bearing mice. J Immunol. 181:5791–802. DOI: 10.4049/jimmunol.181.8.5791. PMID: 18832739. PMCID: PMC2575748.
crossref pmid pmc
4. Talmadge JE, Gabrilovich DI. 2013; History of myeloid-derived suppressor cells. Nat Rev Cancer. 13:739–52. DOI: 10.1038/nrc3581. PMID: 24060865. PMCID: PMC4358792.
crossref pmid pmc
5. Korn C, Méndez-Ferrer S. 2017; Myeloid malignancies and the microenvironment. Blood. 129:811–22. DOI: 10.1182/blood-2016-09-670224. PMID: 28064238. PMCID: PMC5314811.
crossref pmid pmc
6. Gabrilovich DI. 2017; Myeloid-derived suppressor cells. Cancer Immunol Res. 5:3–8. DOI: 10.1158/2326-6066.CIR-16-0297. PMID: 28052991. PMCID: PMC5426480.
crossref pmid pmc
7. Veglia F, Perego M, Gabrilovich D. 2018; Myeloid-derived suppressor cells coming of age. Nat Immunol. 19:108–19. DOI: 10.1038/s41590-017-0022-x. PMID: 29348500. PMCID: PMC5854158.
crossref pmid pmc
8. Solito S, Marigo I, Pinton L, Damuzzo V, Mandruzzato S, Bronte V. 2014; Myeloid‐derived suppressor cell heterogeneity in human cancers. Ann NY Acad Sci. 1319:47–65. DOI: 10.1111/nyas.12469. PMID: 24965257.
crossref pmid
9. Giallongo C, Parrinello N, Tibullo D, La Cava P, Romano A, Chiarenza A, et al. 2014; Myeloid derived suppressor cells (MDSCs) are increased and exert immunosuppressive activity together with polymorphonuclear leukocytes (PMNs) in chronic myeloid leukemia patients. PloS One. 9:e101848. DOI: 10.1371/journal.pone.0101848. PMID: 25014230. PMCID: PMC4094386.
crossref
10. Giallongo C, Parrinello N, Brundo MV, Raccuia SA, Di Rosa M, La Cava P, et al. 2015; Myeloid derived suppressor cells in chronic myeloid leukemia. Front Oncol. 5:107. DOI: 10.3389/fonc.2015.00107. PMID: 26029664. PMCID: PMC4432672.
crossref pmid pmc
11. Bizymi N, Bjelica S, Kittang AO, Mojsilovic S, Velegraki M, Pontikoglou C, et al. 2019; Myeloid-derived suppressor cells in hematologic diseases: promising biomarkers and treatment targets. Hemasphere. 3:e168. DOI: 10.1097/HS9.0000000000000168. PMID: 31723807. PMCID: PMC6745940.
crossref
12. Wang J, Shirota Y, Bayik D, Shirota H, Tross D, Gulley JL, et al. 2015; Effect of TLR agonists on the differentiation and function of human monocytic myeloid-derived suppressor cells. J Immunol. 194:4215–21. DOI: 10.4049/jimmunol.1402004. PMID: 25825448. PMCID: PMC4402268.
crossref pmid pmc
13. Luyckx A, Schouppe E, Rutgeerts O, Lenaerts C, Fevery S, Devos T, et al. 2012; G-CSF stem cell mobilization in human donors induces polymorphonuclear and mononuclear myeloid-derived suppressor cells. Clin Immunol. 143:83–7. DOI: 10.1016/j.clim.2012.01.011. PMID: 22341087.
crossref pmid
14. Xu H, Liu J, Shen N, Zhao Z, Cui J, Zhou S, et al. 2020; The interaction of tumor cells and myeloid-derived suppressor cells in chronic myelogenous leukemia. Leuk Lymphoma. 61:128–37. DOI: 10.1080/10428194.2019.1658098. PMID: 31530212.
crossref pmid
15. Youn JI, Gabrilovich DI. 2010; The biology of myeloid‐derived suppressor cells: the blessing and the curse of morphological and functional heterogeneity. Eur J Immunol. 40:2969–75. DOI: 10.1002/eji.201040895. PMID: 21061430. PMCID: PMC3277452.
crossref pmid pmc
16. Nagaraj S, Gupta K, Pisarev V, Kinarsky L, Sherman S, Kang L, et al. 2007; Altered recognition of antigen is a mechanism of CD8+ T cell tolerance in cancer. Nat Med. 13:828–35. DOI: 10.1038/nm1609. PMID: 17603493. PMCID: PMC2135607.
crossref pmid pmc
17. Priceman SJ, Sung JL, Shaposhnik Z, Burton JB, Torres-Collado AX, Moughon DL, et al. 2010; Targeting distinct tumor-infiltrating myeloid cells by inhibiting CSF-1 receptor: combating tumor evasion of antiangiogenic therapy. Blood. 115:1461–71. DOI: 10.1182/blood-2009-08-237412. PMID: 20008303. PMCID: PMC2826767.
crossref pmid pmc
18. Movahedi K, Guilliams M, Van den Bossche J, Van den Bergh R, Gysemans C, Beschin A, et al. 2008; Identification of discrete tumor-induced myeloid-derived suppressor cell subpopulations with distinct T cell - suppressive activity. Blood. 111:4233–44. DOI: 10.1182/blood-2007-07-099226. PMID: 18272812.
pmid
19. Dolcetti L, Peranzoni E, Ugel S, Marigo I, Fernandez Gomez A, Mesa C, et al. 2010; Hierarchy of immunosuppressive strength among myeloid‐derived suppressor cell subsets is determined by GM‐CSF. Eur J Immunol. 40:22–35. DOI: 10.1002/eji.200939903. PMID: 19941314.
crossref pmid
20. Nausch N, Galani IE, Schlecker E, Cerwenka A. 2008; Mononuclear myeloid-derived "suppressor" cells express RAE-1 and activate natural killer cells. Blood. 112:4080–9. DOI: 10.1182/blood-2008-03-143776. PMID: 18753637. PMCID: PMC2582006.
crossref pmid pmc

Fig. 1
Serial gating strategy for the quantification of gMDSCs (HLA-DRlow/- CD11b+ CD33+ CD15+ CD14) and mMDSCs (HLA-DRlow/-CD11b+ CD14+) in peripheral blood and bone marrow aspirates.
Abbreviations: MDSCs, myeloid-derived suppressor cells; gMDSCs, granulocytic MDSCs; mMDSCs, monocytic MDSCs.
alm-41-5-479-f1.tif
Fig. 2
Levels of gMDSCs and mMDSCs according to the clinical status of CML patients, and overall survival curves according to the levels. (A) BM-gMDSC% and (B) PB-gMDSC% of the CML group were significantly lower than those of the CHR and BM NC groups (P<0.001), and PB-gMDSC% of the CML group was also significantly lower than that of the healthy control (HC) group (P<0.001). (C) The number of PB-gMDSCs and (D) BM-mMDSC% did not differ between any of the groups. (E) PB-mMDSC% of the CML group was higher than that of the BM NC group but did not differ between any other groups. (F) The number of PB-mMDSCs differed significantly between the BM NC, HC, CML, and CHR groups (P<0.001). In boxplots, the horizontal line represents median, and the box encompasses 25th-75th percentile. (G) The survival rate of the group with a high number of PB-gMDSCs was higher than that of the group with a low number of PB-gMDSCs (P=0.021). (H) The group with low PB-mMDSC% showed higher survival than the group with high PB-mMDSC% but there was no statisti­cal significance (P=0.182).
Abbreviations: MDSCs, myeloid-derived suppressor cells; gMDSCs, granulocytic MDSCs; mMDSCs, monocytic MDSCs; BM; bone marrow; PB, peripheral blood; CHR, complete hematologic response; BM NC, BM normal control; HC, healthy controls.
alm-41-5-479-f2.tif
Table 1
MDSC levels and laboratory characteristics of the individuals from the four groups: CML, CHR, HC, and BM NC
BM-gMDSC % PB-gMDSC BM-mMDSC % PB-mMDSC
% cell No/μL % cell No/μL
CML (N = 37) 0.9 (0.3–1.5) 1.3 (0.6–9.7) 1,454 (1,189–2,399) 0.4 (0.3–0.7) 0.3 (0.2–0.6) 234 (63–9,614)
Chronic phase (N = 30) 0.9 (0.4–1.4) 1.5 (0.6–13.8) 1,931 (970–4,080) 0.4 (0.3–0.7) 0.3 (0.2–0.5) 322 (98–1,004)
Accelerated phase (N = 3) 1.0 (0.1–1.8) 0.5 (0.2–0.7) 1,376 (1206–3,370) 0.7 (0.1–1.2) 0.9 (0.2–1.6) 148 (137–5,578)
Blastic phase (N = 4) 1.2 (0.7–6.0) 1.1 (0.9–5.1) 158.4 (80–512) 0.1 (0.1–0.7) 0.3 (0.2–0.5) 1 (1–34)
CHR (N = 40) 26.6 (7.4–37.7) 22.3 (16.5–29.3) 1,203 (720–2,205) 0.3 (0.2–0.4) 0.2 (0.1–0.4) 14 (6–27)
HC (N = 40) - 18.1 (13.2–30.3) 1,209 (777–2210) - 0.3 (0.2–0.5) 20 (12–31)
BM NC (N = 38) 39.7 (33.3–44.9) 26 (19.6–35.4) 1,454 (1189–2,399) 0.2 (0.2–0.6) 0.2 (0.1–0.4) 10 (6–23)
Correlation, r value (P value)
WBC ( × 109/L) -0.420 ( < 0.001**) -0.42 ( < 0.001**) 0.049 (0.547) -0.021 (0.827) -0.007 (0.929) 0.684 ( < 0.001**)
Blast% -0.234 (0.012*) -0.263 (0.001**) 0.084 (0.304) 0.003 (0.972) -0.016 (0.848) 0.253 (0.002**)
Eosinophil% -0.019 (0.839) -0.095 (0.242) 0.188 (0.020*) 0.193 (0.040*) 0.076 (0.349) 0.202 (0.012*)
Basophil% -0.379 ( < 0.001**) -0.33 ( < 0.001**) 0.186 (0.021*) -0.036 (0.705) -0.028 (0.734) 0.252 (0.002**)
Hemoglobin (g/L) 0.368 ( < 0.001**) 0.361 ( < 0.001**) 0.037 (0.653) -0.027 (0.777) 0.041 (0.618) -0.321 ( < 0.001**)
Platelet ( × 109/L) -0.355 ( < 0.001**) -0.268 (0.001**) 0.164 (0.043*) -0.086 (0.365) -0.059 (0.469) 0.255 (0.001**)
BCR-ABL1 level -0.546 ( < 0.001**) -0.482 ( < 0.001**) 0.040 (0.643) -0.003 (0.972) -0.003 (0.969) 0.419 ( < 0.001**)

*P<0.05; **P<0.005; †median (25th-75th percentiles).

Abbreviations: MDSC, myeloid-derived suppressor cell; PB, peripheral blood, BM, bone marrow; gMDSC, granulocytic MDSC; mMDSC, monocytic MDSC; CHR, complete hematologic response; CML, chronic myeloid leukemia; HC, healthy control; BM NC, bone marrow normal control; WBC, white blood cell.

TOOLS
Similar articles