INTRODUCTION
MATERIALS AND METHODS
KEQAS ABCr PT survey
Outlier elimination
Table 1
| Trial | Total N of participating labs | N of response results* | N of outliers† | Bias (%) | Bias (mg/dL) | ||
|---|---|---|---|---|---|---|---|
|
|
|
||||||
| Mean (95% CI) | SD | Mean (95% CI) | SD | ||||
| 2011-A | 54 | 161 | 1 | 10.82 (9.45–12.19) | 12.15 | 0.096 (0.080–0.112) | 0.102 |
| 2011-B | 56 | 166 | 0 | 7.12 (5.77–8.46) | 11.02 | 0.075 (0.058–0.091) | 0.108 |
| 2012-A | 103 | 303 | 2 | 9.33 (8.33–10.33) | 10.79 | 0.082 (0.072–0.092) | 0.090 |
| 2012-B | 108 | 323 | 0 | 6.18 (5.22–7.15) | 9.86 | 0.062 (0.050–0.073) | 0.105 |
| 2013-A | 140 | 420 | 1 | 5.78 (4.93–6.62) | 10.10 | 0.049 (0.036–0.061) | 0.133 |
| 2013-B | 139 | 416 | 0 | 7.63 (6.78–8.48) | 10.81 | 0.066 (0.057–0.074) | 0.091 |
| 2014-A | 176 | 527 | 4 | 4.04 (3.29–4.80) | 11.29 | 0.024 (0.013–0.036) | 0.132 |
| 2014-B | 167 | 501 | 2 | –0.01 (–0.79–0.76) | 7.07 | –0.004 (–0.012–0.004) | 0.091 |
| 2015-A | 175 | 525 | 1 | 1.36 (0.60–2.11) | 6.67 | 0.018 (0.011–0.026) | 0.090 |
| 2015-B | 178 | 534 | 1 | 3.64 (2.89–4.39) | 7.97 | 0.036 (0.028–0.045) | 0.100 |
| 2016-A | 146 | 437 | 3 | 2.37 (1.54–3.20) | 7.69 | 0.02 (0.011–0.029) | 0.098 |
| 2016-B | 150 | 450 | 2 | 4.01 (3.20–4.83) | 10.04 | 0.027 (0.019–0.036) | 0.091 |
| 2017-A | 153 | 459 | 3 | 1.77 (0.96–2.58) | 8.82 | 0.008 (0.000–0.015) | 0.080 |
| 2017-B | 167 | 501 | 3 | 2.05 (1.27–2.82) | 8.95 | 0.014 (0.008–0.02) | 0.068 |
| 2018-A | 197 | 591 | 1 | 2.36 (1.65–3.07) | 8.57 | 0.008 (0.000–0.015) | 0.093 |
| 2018-B | 200 | 600 | 0 | 3.87 (3.17–4.58) | 8.11 | 0.033 (0.027–0.039) | 0.074 |
| 2019-A | 227 | 681 | 2 | 0.45 (–0.21–1.11) | 6.40 | –0.003 (–0.009–0.003) | 0.077 |
| 2019-B | 227 | 681 | 2 | 0.20 (–0.47–0.86) | 7.36 | –0.018 (–0.026––0.009) | 0.111 |
Statistical analysis
RESULTS
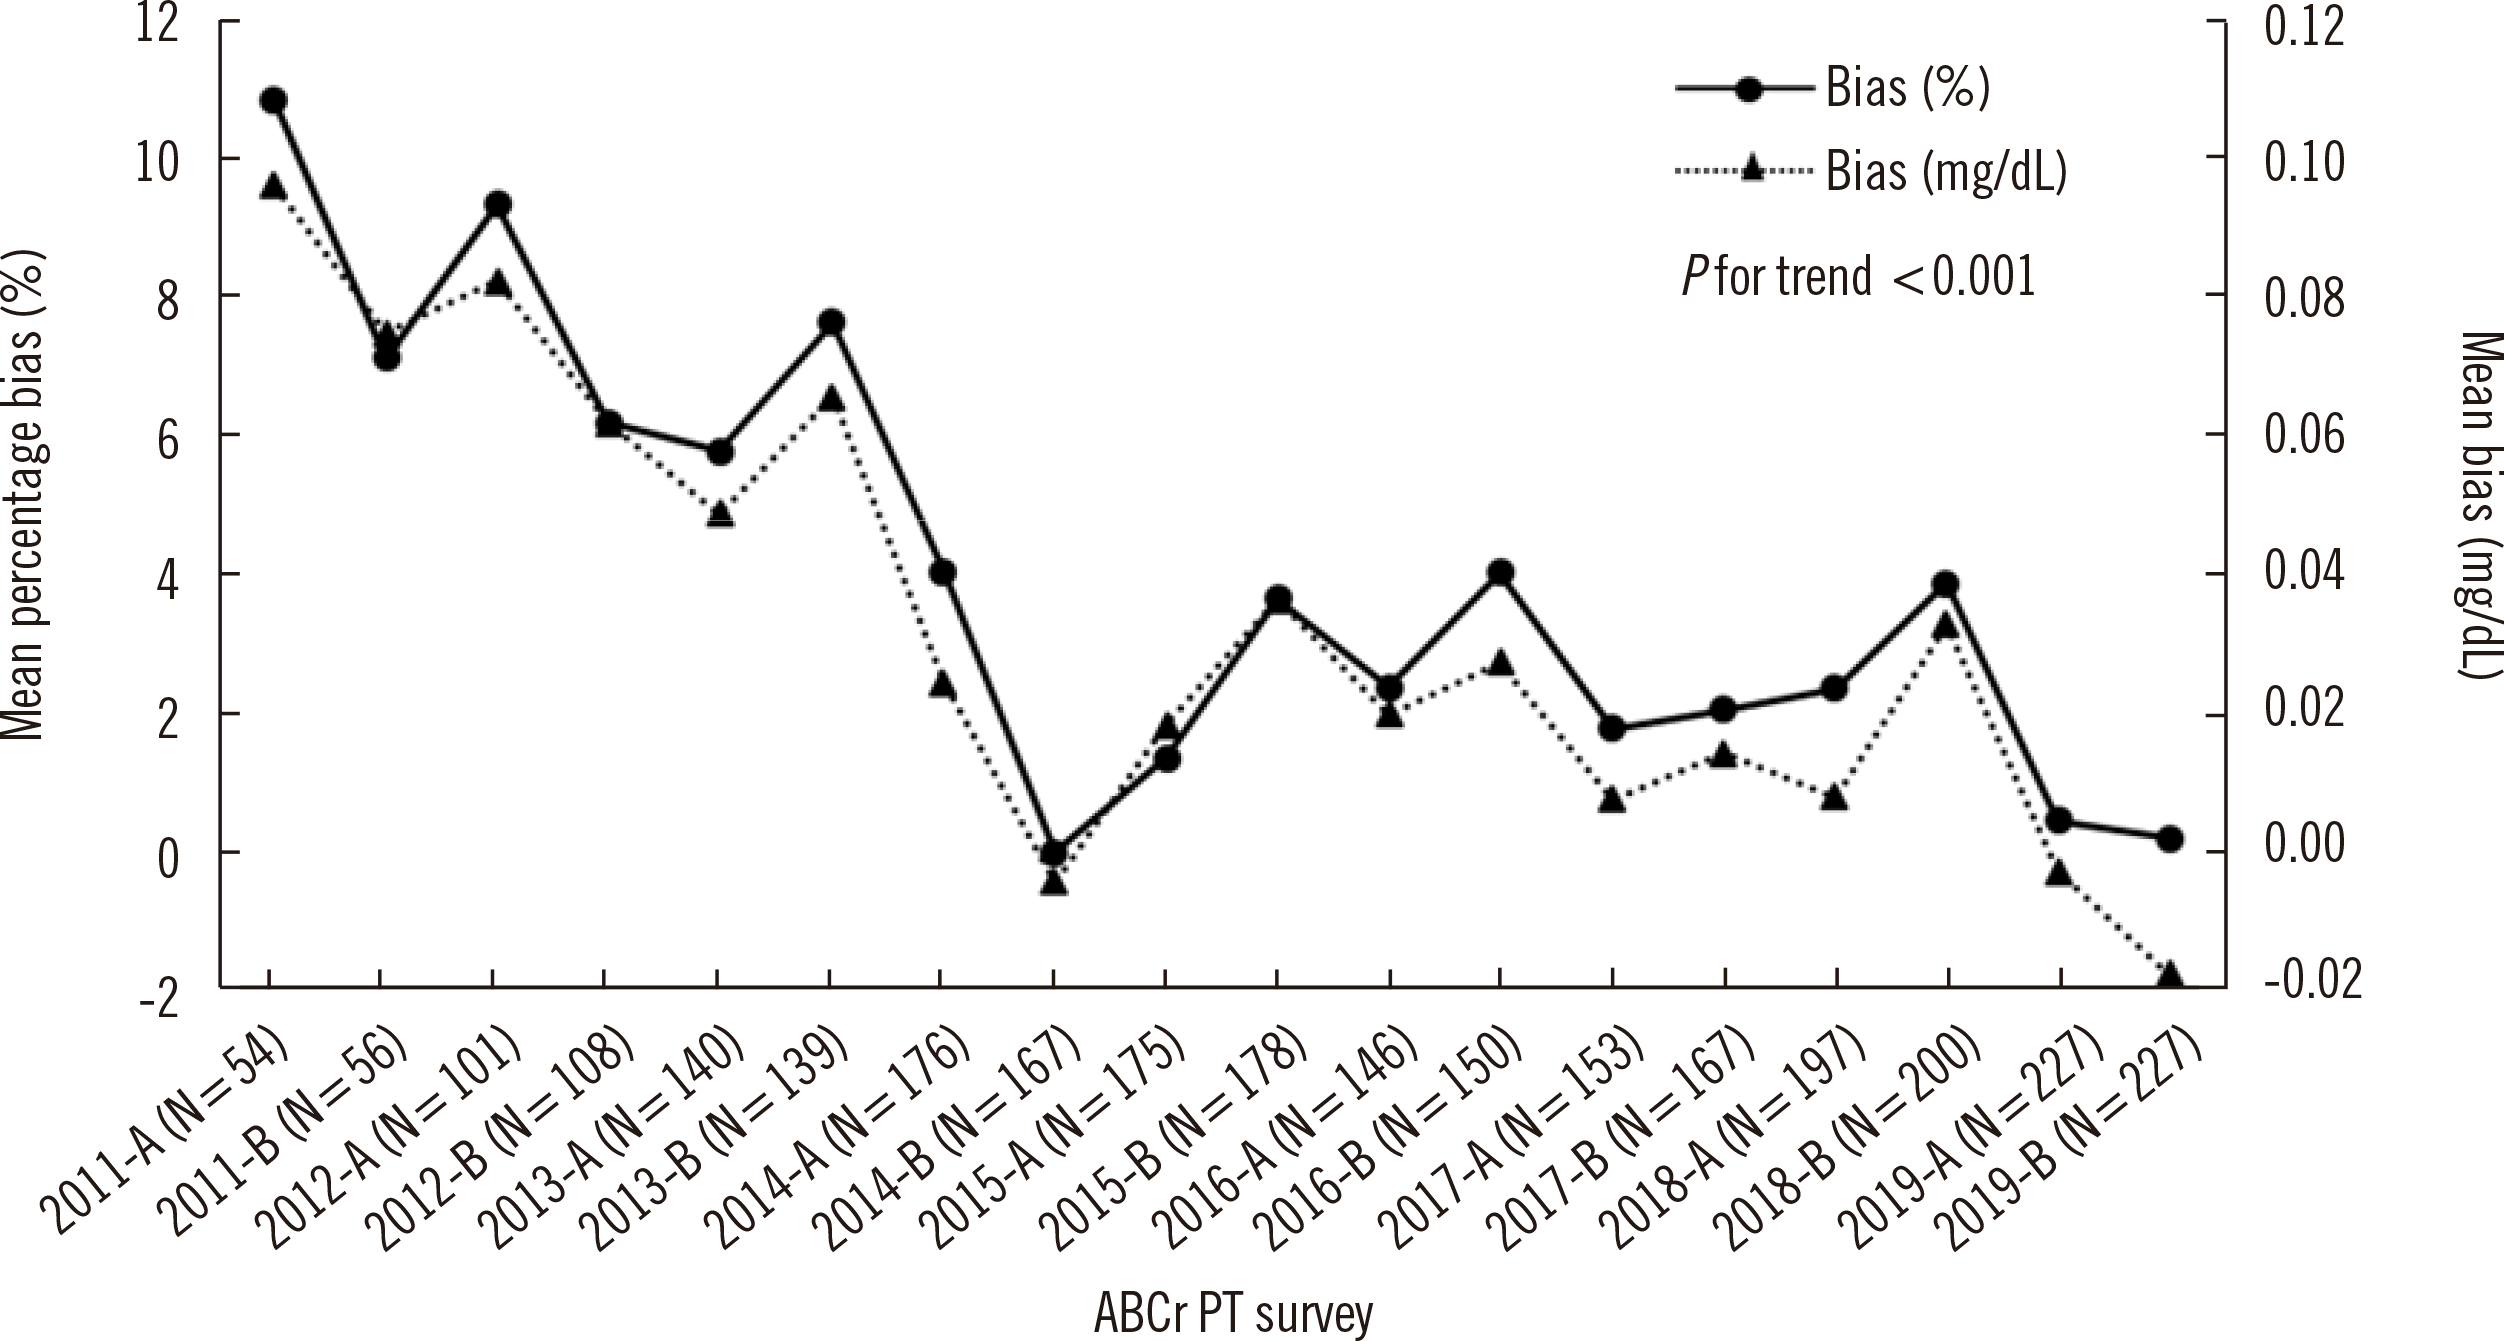
 | Fig. 1Trend in mean percentage bias in the ABCr PT survey by the KEQAS (2011–2019). N represents the number of participating laboratories in the first (A) and second (B) ABCr PT survey of the year.
Abbreviations: ABCr PT, accuracy-based creatinine proficiency testing; KEQAS, Korean Association of External Quality Assessment Service.
|
Table 2
Table 3
| Cumulative trial | N of participating laboratories | Bias (%) | Difference in mean percentage bias compared with the 1st trial* | ||
|---|---|---|---|---|---|
|
|
|
||||
| Mean (95% CI) | SD | Mean (95% CI) | P | ||
| 1st | 328 | 5.51 (4.94–6.08) | 10.87 | Reference | |
| 2nd | 319 | 4.74 (4.16–5.31) | 9.95 | −0.77 (−1.98–0.44) | 0.584 |
| 3rd | 268 | 4.31 (3.68–4.93) | 10.61 | −1.20 (−2.47–0.07) | 0.081 |
| 4th | 258 | 3.45 (2.80–4.09) | 10.24 | −2.06 (−3.35– −0.77) | < 0.001 |
| 5th | 206 | 3.29 (2.56–4.01) | 9.44 | −2.22 (−3.60– −0.84) | < 0.001 |
| 6th | 196 | 2.66 (1.91–3.40) | 9.20 | −2.85 (−4.25– −1.45) | < 0.001 |
| 7th | 172 | 2.60 (1.80–3.39) | 8.68 | −2.91 (−4.37– −1.45) | < 0.001 |
| 8th | 163 | 1.51 (0.70–2.33) | 7.85 | −3.99 (−5.48– −2.50) | < 0.001 |
| 9th | 133 | 2.32 (1.42–3.22) | 7.14 | −3.18 (−4.78– −1.59) | < 0.001 |
| 10th | 128 | 3.08 (2.17–4.00) | 7.78 | −2.42 (−4.04– −0.81) | < 0.001 |
| 11th | 111 | 1.82 (0.84–2.79) | 6.72 | −3.69 (−5.38– −1.99) | < 0.001 |
| 12th | 107 | 2.40 (1.40–3.41) | 8.03 | −3.10 (−4.83– −1.37) | < 0.001 |
| 13th | 88 | 1.86 (0.75–2.96) | 7.42 | −3.65 (−5.51– −1.78) | < 0.001 |
| 14th | 85 | 1.68 (0.55–2.81) | 7.33 | −3.83 (−5.72– −1.93) | < 0.001 |
| 15th | 67 | 1.65 (0.37–2.92) | 6.27 | −3.86 (−5.95– −1.77) | < 0.001 |
| 16th | 60 | 2.16 (0.81–3.50) | 6.61 | −3.35 (−5.53– −1.16) | < 0.001 |
| 17th | 38 | 0.02 (−1.67–1.72) | 5.36 | −5.48 (−8.15– −2.81) | < 0.001 |
| 18th | 32 | 0.24 (−1.58–2.07) | 7.18 | −5.26 (−8.13– −2.40) | < 0.001 |
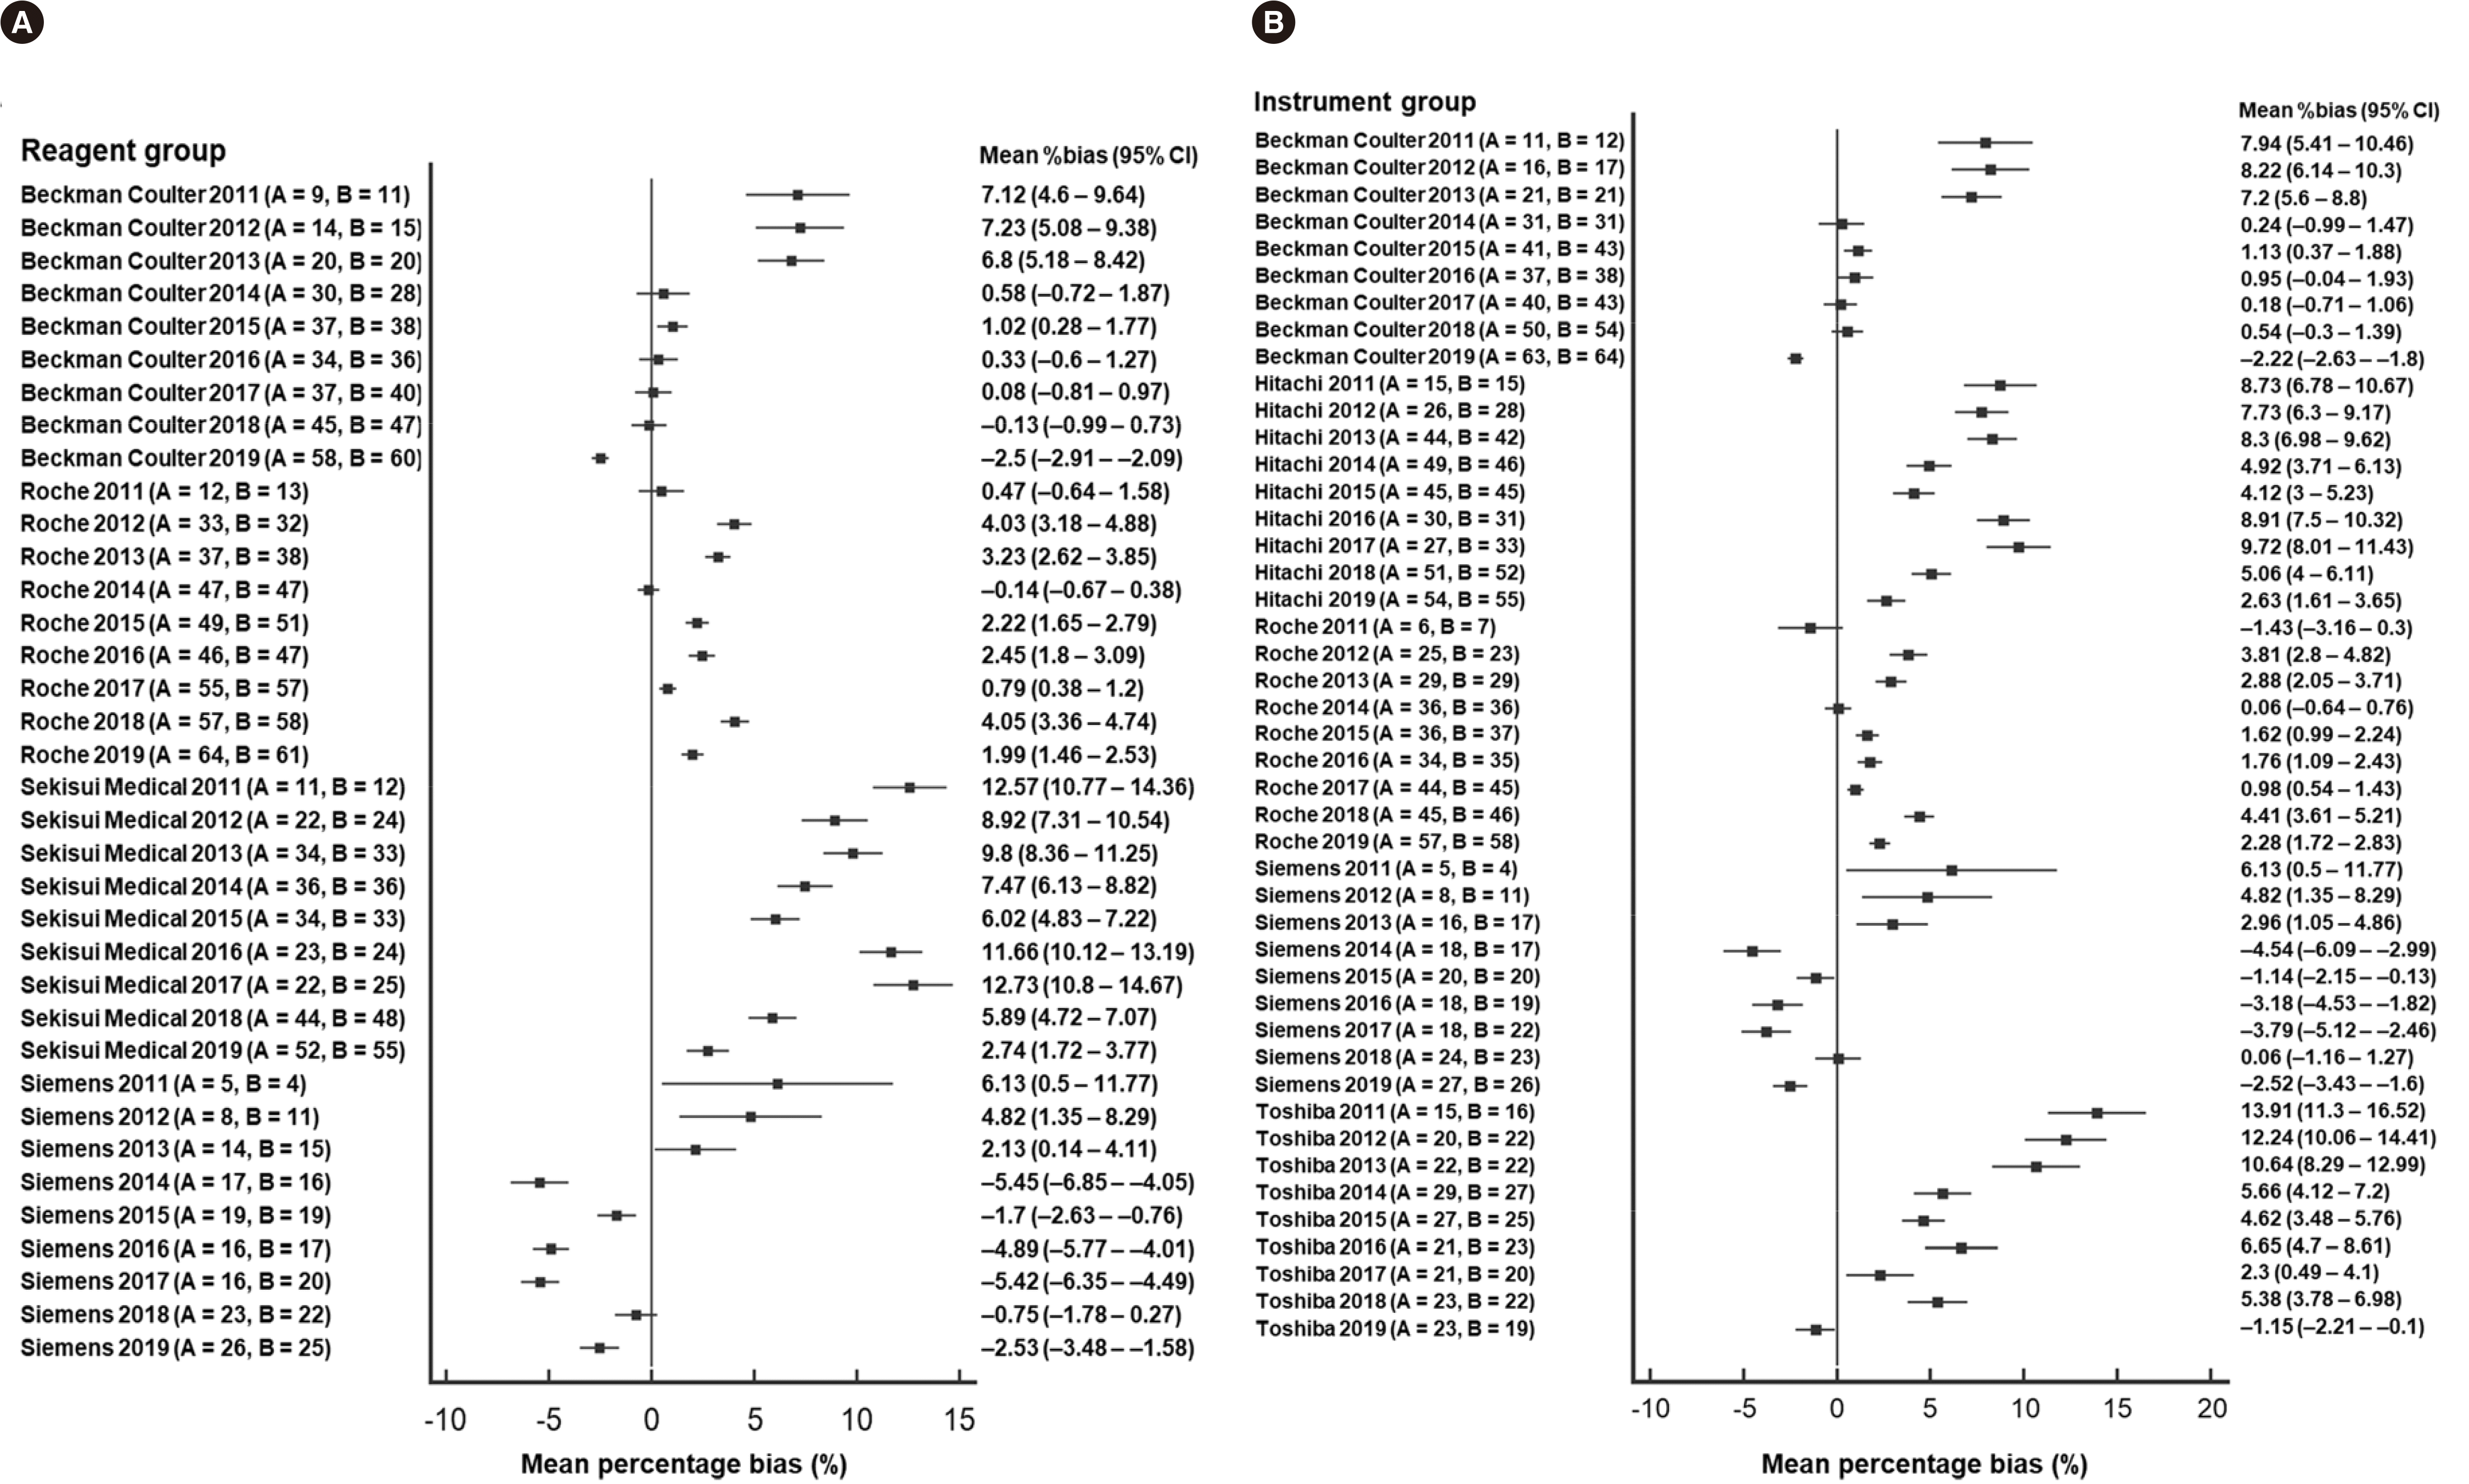
 | Fig. 3Forest plot of mean percentage bias in the ABCr PT survey stratified by year. (A) Reagent manufacturer group. (B) Instrument manufacturer group. A and B in parenthesis are the number of participating laboratories in the first and second ABCr PT survey of the year, respectively.
Abbreviations: ABCr PT, accuracy-based creatinine proficiency testing; CI, confidence interval.
|


 PDF
PDF Citation
 Print
Print


 XML Download