Journal List > Anat Cell Biol > v.54(1) > 1146632

Elijah, Peter, Ekanem, and Edagha: Scapular length estimation from anatomical landmarks: an osteometry and radiographic evaluation using regression equations

Abstract

Estimation of body length has been achieved from the measurements of the scapular with relative accuracy by researches in recent times. This research hypothesized that the landmarks on the scapular and on the x-ray radiographs could be used to predict scapular length and elucidated the landmarks that best estimate the scapular length. A total of 600 scapulae and 600 anterior-posterior x-ray radiographs were used for the study. Positive correlation was observed between the measured variables and the scapular length with the males showing significantly higher mean length compared to females. The length of axillary boarder of the scapula was the best predictor of the scapular length. No significant difference (P>0.05) existed in the mean length derived from the scapular and the x-ray radiographs of scapular. We therefore conclude that measurements from the radiographs of scapular were as reliable in estimating scapular length as those from the scapular bones.

Introduction

The ability to estimate the length of bones from their landmarks is a major breakthrough in the process of stature or body length estimation in grossly mutilated or dismembered remains. Researchers have further been able to estimate individual body length from the length of bones [1-3]. In forensic cases where the individual cannot be identified, the ability to estimate its body length is a step toward identifying the individual in question [4]. Long bones of the body play major role and are most widely used in body length estimation although short and flat bones have also been used in estimation of the body length of unidentified individual [5-7]. The short and flat bones are said to preserve better than long bones in taphonomic processes [8]. Also, where long bones are shattered beyond suitability for anthropometric evaluation, sexual dimorphism [9-12] and body length estimation [6, 13] have been archived using the scapular. The outline of the scapular can be easily traced in the living and on x-ray radiographs, making it important in forensic investigation.
However, the understanding of the morphometry of these bones is of immense importance to the investigators [14-16]. Since stature or body length is influenced by race, sex and age of individual, formulae for body length estimation from bones are therefore population specific [17]. Therefore, researching, testing, and developing new techniques for determining this component of the biological profile is very important particularly in medico-legal cases. This study attempts to use radiographic and anthropometric parameters of the scapular in estimating its length which may be useful in statural estimation among Nigerians.

Materials and Methods

Six hundred healthy preserved scapulae pooled from Anatomical Museums and six hundred X-ray radiographs from hospitals within the six geo-political zones (Northeast, Northwest, North central, Southeast, Southwest and South-south) of Nigeria. The sample size was calculated using Cochran’s formula given by SS=Z2×(P)×(1–P)/C2 Where SS=sample size; Z=1.95 at 95% confidence interval; P=percentage (%) picking a choice (expressed as decimal, 0.5 used for sample size needed); C=confidence interval (expressed as decimal, 0.04 or ±4) [18].
As inclusion criteria, all samples were assessed to eliminate obvious pathological damages or malformations. Only firmly and fully ossified bones were included. Radiograph samples used were only the specimens that showed the entire length of the bone with clear image in the anterior-posterior view and with no visible trauma.
On the bony samples, a digital vernier caliper calibrated to 0.1 mm was used for measuring small dimension; an anthropometric board calibrated to 0.1 cm was used for taking full length measures and an anthropometric tape calibrated to 0.1 cm was used for taking circumferential measures. Bones collected were not sexed but identified and separated into right and left.
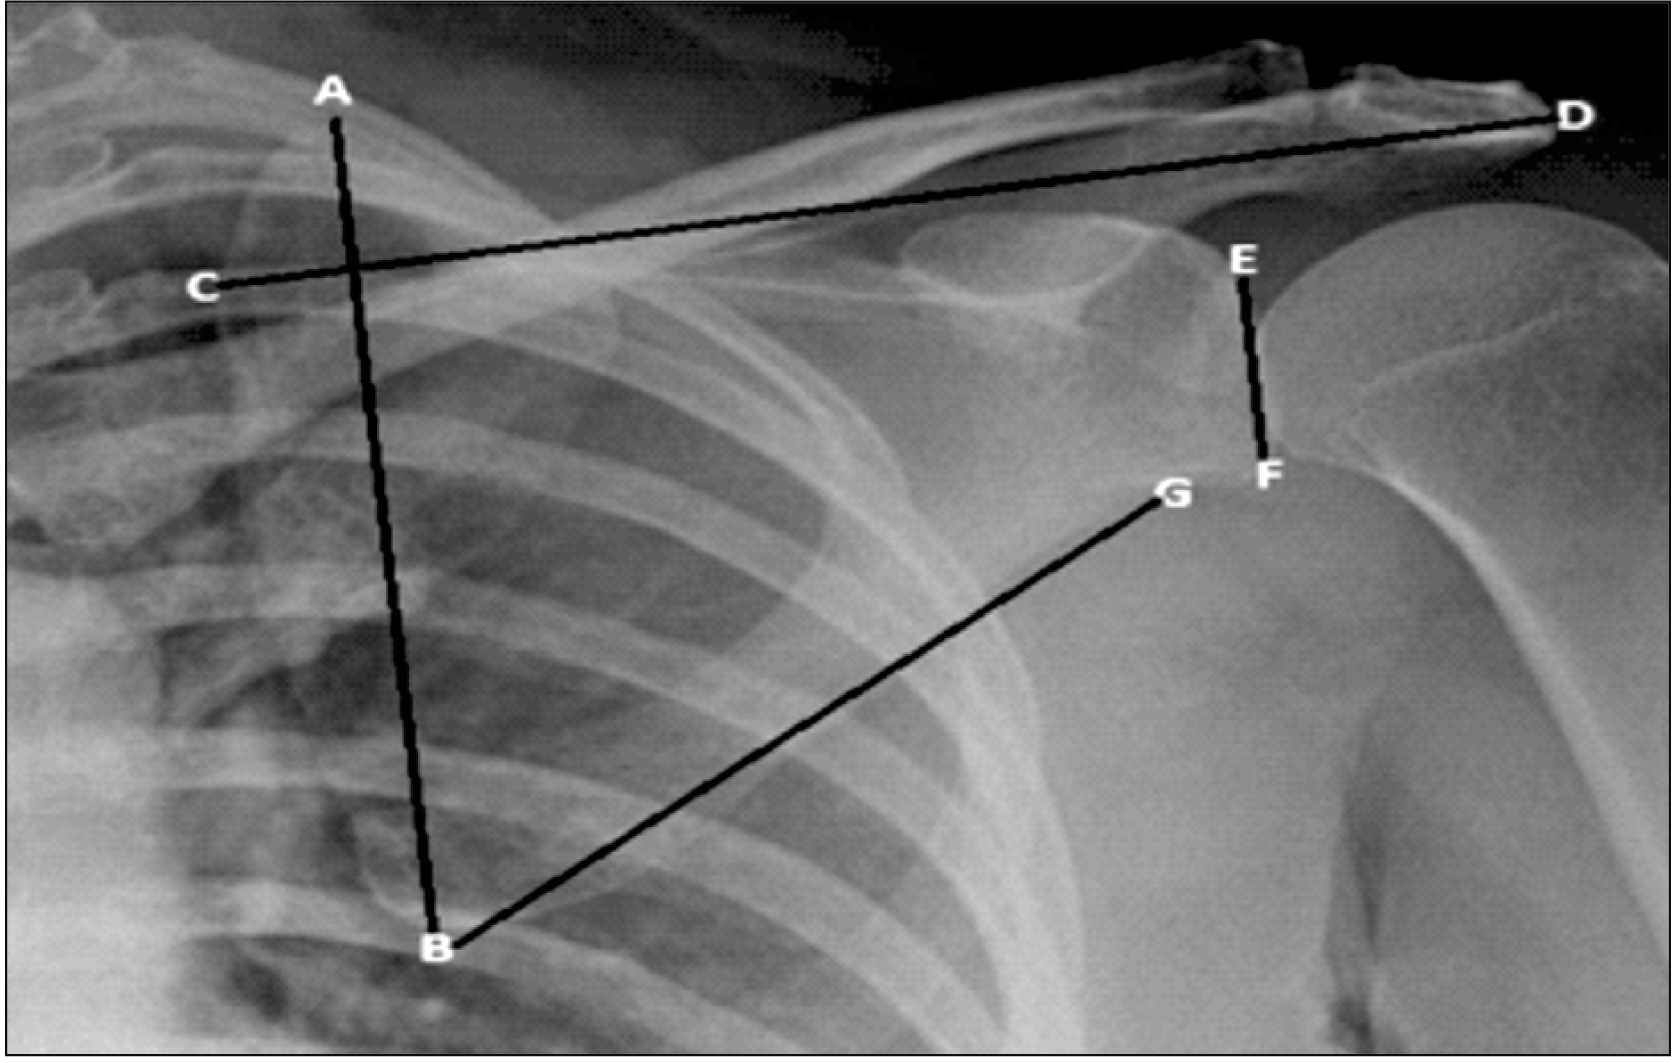
On the x-ray radiographs, a transparent ruler calibrated to 0.1 cm was used for all measurements taken. Radiographs were identified into male or female and the side they belong. All samples were marked to avoid mix up and repetition. Only anterior-posterior radiographs of this bone were used, hence only landmarks that were readable on these radiographs were measured. To eliminate bias, the same measurements were verified from 30 randomly selected samples by two evaluators, the examiner and the recorder using the same unit and instrument. Intra- and inter-observer technical error of measurements (TEMs) were calculated using (TEM=[√∑D2/2N], where D=difference between the measurements, N=number of samples measured) and the coefficient of reliability was also calculated using (R=[1–(TEM)2/SD2] where SD=standard deviation of all measurements) [19, 20]. All samples were taken from adults between the ages of 20–60 years. The landmarks used in the study included:

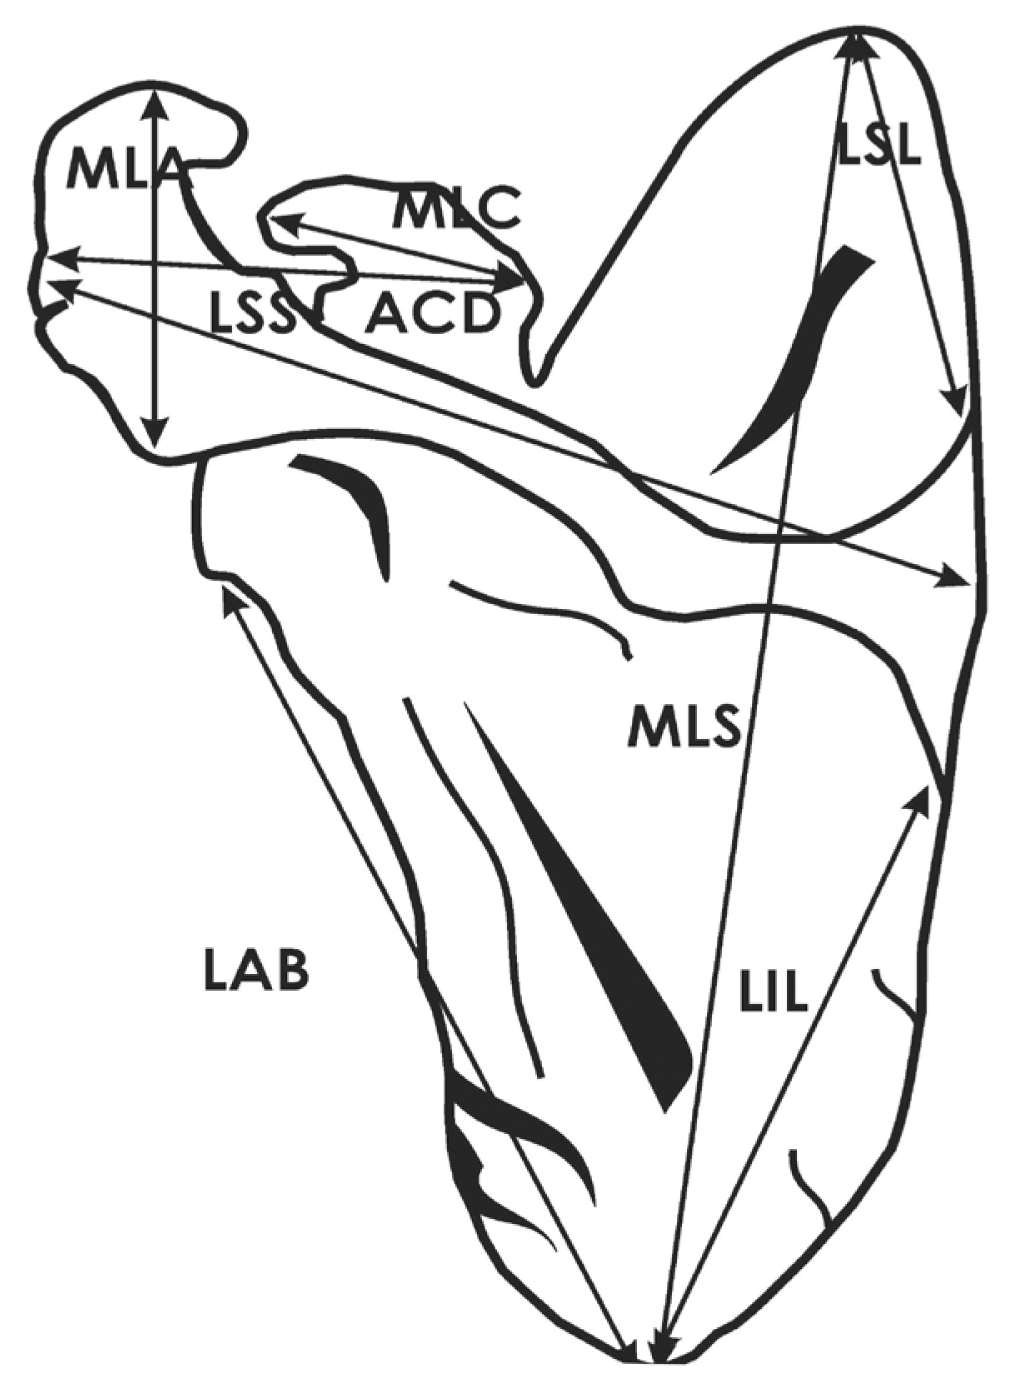
Measurements on the scapulae (Fig. 1)

  1. Maximum length of scapular (MLS): was measured as the distance from the superior angle of the scapular to the inferior angle of the scapular.

  2. Length of scapular spine (LSS): was measured as the distance between the spinal axis at the vertebral border to the most distal point of the acromion process.

  3. Length of supraspinous line (LSL): was measured as the distance between the tip of the superior angle and the spinal axis on the vertebral border.

  4. Length of infraspinous line (LIL): was measured as the distance between the tip of the inferior angle and the spinal axis on the vertebral border.

  5. Acromio-coracoid distance (ACD): was measured as the distance between the most dorsal point on the acromion and the most lateral tip on the coracoid process.

  6. Maximum length of acromion process (MLA): was measured as the distance between the most superior point and the most inferior point on the acromion.

  7. Maximum length of coracoid process (MLC): was measured as the distance between the most lateral tip of the coracoid and the base of the most medial point of the coracoid, often just above the scapular notch.

  8. Maximum length of glenoid fossa (MLG): was measured as the distance between the superior border and the inferior border of the glenoid fossa.

  9. Maximum breadth of glenoid fossa (MBG): was measured as the distance between the ventral border and the dorsal border of the glenoid fossa, usually across the midpoint of the glenoid fossa.

  10. Length of axial border (LAB): was measured as the distance between the most inferior point of the glenoid fossa and the tip of the inferior angle [8, 21, 22].
Measurements on the radiograph of scapular (Fig. 2)

  1. MLS: was measured as the distance from the superior angle of the scapular to the inferior angle of the scapular.

  2. LSS: was measured as the distance between the spinal axis at the vertebral border to the most distal point of the acromion process.

  3. MLG: was measured as the distance between the superior border and the inferior border of the glenoid fossa.

  4. LAB: was measured as the distance between the most inferior point of the glenoid fossa and the tip of the inferior angle.

Statistical analysis

To eliminate bias, the same measurements were verified from 30 randomly selected samples by two evaluators, the examiner and the recorder using the same unit and instrument and TEMs were calculated. The intra- and inter-observer TEM was calculated using (TEM=[√∑D2/2N], where D=difference between the measurements, N=number of samples measured) and the coefficient of reliability was also calculated using (R=[1–(TEM)2/SD2] where SD=standard deviation of all measurements) [10, 17]. The mean, standard deviation, minimum, maximum and standard error were determined. Comparisons between the right and left variables were performed using student’s t-test. Pearson’s correlation coefficient was carried out to assess the relationship between the variables (independent variable, x) and length (ML–dependent variable, y). Regression analysis was undertaken to find the variables that relate to length and for estimating length using equations. Regression equations were derived to construct the length of each bone from the significant variables. Simple regression models at y=mx+c were derived, where ‘c’ is a constant, ‘m’ is the regression coefficient and the asterisk “*” denotes significant values at P<0.05. After excluding highly correlated variables using a stepwise method, multivariate regression equations were derived and the most suitable parameter for predicting length was determined using the highly correlated variables. Analysis was done using IBM SPSS Statistics for Windows, Version 21.0 (IBM Co., Armonk, NY, USA). All measurements were converted to the nearest centimetre.

Ethical approval

Compliance with institutional rules with respect to human experimental research and ethics were strictly adhered to in the course of this study. Since bone samples were selected from cadaveric skeletal collection pooled and stored for research and teaching purposes in the Department of Anatomy from Universities and radiographs from hospitals around Nigeria, written approvals were obtained from the Human Research Ethics Committee with reference number FCT/UATH/HREC/1085.

Results

The TEM for scapula and radiographs of scapula showed coefficient of reliability R>0.95 in all cases, thus the measurements were regarded as reliable (Table 1).
Mean Length of Scapular using Bones: The mean length of the scapular was 14.89±1.36 cm for right and 14.83±1.12 cm for left with a range of 9.70 to 17.60 cm and 10.00 to 17.30 cm respectively. When the right and left scapulae were combined, the mean was found to be 14.86±1.24 cm with a range of 9.70 to 17.60 cm. No significant difference was found in the mean length between the right and left scapulae nor was there any significant difference found when compared to the mean length of the combined scapulae (Table 2).
Pearson’s correlation showed that all the variables on the right, left and the combined scapulae showed significant and positive correlation with the length of scapular (Table 3). Multivariate analysis revealed that the best predictors of scapular length were MLC, MLG and LAB for the right scapula, LIL for the left and when both right and left were combined, LIL and LAB were the best predictors of the scapular length.
Multivariate linear regression equations to identify the variables that best predict the length of scapula were as follows:
Right=–1.448+0.464MLC+0.487MLG+0.740LAB
Left=0.862+0.615LIL
Combined=0.413+0.488LIL+0.451LAB
Mean Length of Scapular using radiographs: Using x-ray radiographs, the mean length of the male scapula from radiographs were 15.33±1.28 cm for right and 15.26±1.02 cm for left. For females, it was 14.57±1.14 cm for right and 14.51±0.96 cm for the left. When the right and left scapulae were combined, the mean length was found to be 15.29±1.16 cm for male and 14.54±1.05 cm for female respectively. No significant difference was found in the mean length between right and left and neither was there any difference found when the right and left were combined although male showed higher mean scapular length compared to the females (Table 4). All the variables correlated with the length of scapular when Pearson’s correlation was applied except MLG of the left side in both male and females (Table 5).
Multivariate linear regression equations to identify the variables that best predicted the length of male scapula using radiographs were as follows:
Right=–0.923+0.559MLG+0.919LAB
Left=1.768+0.508LAB
Combined=0.656+0.625MLG+0.687LAB
Multivariate linear regression equations to identify the variables that best predicted the length of female scapula using radiographs were as follows:
Right=0.532+0.684LAB
Left=3.434+0.480LSS
Combined=2.785+0.492LAB
When all radiographs of scapulae were combined irrespective of side or sex, the mean length was 14.92±1.17 cm with a range from 10.80 to 17.60 cm. Pearson’s correlation shows that all the variables (LSS, MLG, and LAB) correlated with the length of scapular (Table 6) and LAB was found to be the best predictor of scapular length.
Multivariate linear regression equation to identify the variable that best predict the length of scapula irrespective of sides or sex using radiographs was:
L=1.083+0.603LAB

Discussion

This work intends to provide forensic anthropologists and anatomists in general with a means of estimating the length of the scapular through linear regression formulae using the scapula and x-ray radiographs of the scapula among Nigerians. The mean length of different populations and the best predictor of scapular length are shown in Table 7 [8, 22, 23].
No statistical significant difference was found to exist in the mean length derived from the analysis of all the data from x-ray radiographs and the actual bones. Therefore, measurements from the radiographs of scapular were seen to be as reliable in estimating the length as those from the bones. However, Igwe and Akpuaka [23] reported a lower mean length of scapular for males and females in the Southeast Nigerian population (Table 7) [8, 22, 23].
The present study showed no statistical significant difference in the mean length for all variables between the right and left scapulae. However, the males showed higher mean length compared to the females. This finding agrees with that of other studies [8, 22, 23], although the mean length of scapular varies for different population study (Table 7). The differences in the mean length between males and females may be due to geographical variation, environmental and genetic factors which contribute to an individual’s physical characteristic, exposure to differences in pattern of physical activities by males, a variable lifestyle compared to their female counterparts or early attainment of adulthood of the female giving the male additional two or more years for further physical growth and development [24, 25].
In general, LAB can be said to be a very reliable parameter for estimating scapular length as most of the sub-groups indicated from the current study. These findings are in line with the work of Kui et al. [8] who reported that the length of axillary margin was the best parameter for estimating stature in a Chinese population. Campobasso et al. [22] however reported the maximum breadth of scapula and the MBG were the best predictor of scapular length in males while in female, the MLC and the MBG were the best predictor in an Italian population,. This may be as a result of racial difference, nutrition, environmental or adaptive changes in the features of the scapular.
In conclusion, this study concludes that males have higher mean scapular length compared to their female counterparts. The dimensions of the scapular can successfully be used to estimate scapular length by anatomists and forensic anthropologists with relative ease and accuracy. The LAB is the best predictor of scapular length. The formulae here presented are applicable only to adult Nigerian population due to variations as a result of biological and environmental factors.

Notes

Author Contributions

Conceptualization: SOE, AIP, AUE. Data acquisition: SOE. Data analysis or interpretation: SOE. Drafting of the manuscript: SOE, IAE. Critical revision of the manuscript: SOE, AIP, AUE, IAE. Approval of the final version of the manuscript: all authors.

Conflicts of Interest

No potential conflict of interest relevant to this article was reported.

References

1. Kozak J. 1996; Stature reconstruction from long bones. The estimation of the usefulness of some selected methods for skeletal populations from Poland. Var Evol. 5:83–94.
2. Lundy JK, Feldesman MR. 1987; Revised equations for estimating living stature from the long bones of the South African Negro. S Afr J Sci. 83:54–5.
3. Trotter M, Gleser GC. 1952; Estimation of stature from long bones of American Whites and Negroes. Am J Phys Anthropol. 10:463–514. DOI: 10.1002/ajpa.1330100407. PMID: 13007782.
crossref pmid
4. Braz VS. Blau S, Ubelaker DH, editors. 2009. Anthropological estimation of sex. Handbook of Forensic Anthropology and Archaeology. Left Coast Press;Walnut Creek: p. 201–7.
5. Bidmos M, Asala S. 2005; Calcaneal measurement in estimation of stature of South African blacks. Am J Phys Anthropol. 126:335–42. DOI: 10.1002/ajpa.20063. PMID: 15386217.
crossref pmid
6. Giurazza F, Del Vescovo R, Schena E, Cazzato RL, D'Agostino F, Grasso RF, Silvestri S, Zobel BB. 2013; Stature estimation from scapular measurements by CT scan evaluation in an Italian population. Leg Med (Tokyo). 15:202–8. DOI: 10.1016/j.legalmed.2013.01.002. PMID: 23485524.
crossref pmid
7. Meadows L, Jantz RL. 1992; Estimation of stature from metacarpal lengths. J Forensic Sci. 37:147–54. DOI: 10.1520/JFS13222J. PMID: 1545195.
crossref pmid
8. Zhang K, Cui JH, Luo YZ, Fan F, Yang M, Li XH, Zhang W, Deng ZH. 2016; Estimation of stature and sex from scapular measurements by three-dimensional volume-rendering technique using in Chinese. Leg Med (Tokyo). 21:58–63. DOI: 10.1016/j.legalmed.2016.06.004. PMID: 27497335.
crossref
9. Atamturk D, Pelin C, Duyar I. 2019; Estimation of sex from scapular measurements: use of the bone area as a criterion. Euras J Anthropol. 10:39–45.
10. Dabbs GR, Moore-Jansen PH. 2010; A method for estimating sex using metric analysis of the scapula. J Forensic Sci. 55:149–52. DOI: 10.1111/j.1556-4029.2009.01232.x. PMID: 20002272.
crossref pmid
11. Hishmat AM, Michiue T, Sogawa N, Oritani S, Ishikawa T, Fawzy IA, Hashem MA, Maeda H. 2015; Virtual CT morphometry of lower limb long bones for estimation of the sex and stature using postmortem Japanese adult data in forensic identification. Int J Legal Med. 129:1173–82. DOI: 10.1007/s00414-015-1228-9. PMID: 26156452.
crossref pmid
12. Torimitsu S, Makino Y, Saitoh H, Sakuma A, Ishii N, Yajima D, Inokuchi G, Motomura A, Chiba F, Yamaguchi R, Hashimoto M, Hoshioka Y, Iwase H. 2016; Sex estimation based on scapula analysis in a Japanese population using multidetector computed tomography. Forensic Sci Int. 262:285.e1–5. DOI: 10.1016/j.forsciint.2016.02.023. PMID: 26965402.
crossref
13. Torimitsu S, Makino Y, Saitoh H, Sakuma A, Ishii N, Hayakawa M, Inokuchi G, Motomura A, Chiba F, Hoshioka Y, Iwase H. 2015; Stature estimation in Japanese cadavers based on scapular measurements using multidetector computed tomography. Int J Legal Med. 129:211–8. DOI: 10.1007/s00414-014-1054-5. PMID: 25064735.
crossref pmid
14. Chibba K, Bidmos MA. 2007; Using tibia fragments from South Africans of European descent to estimate maximum tibia length and stature. Forensic Sci Int. 169:145–51. DOI: 10.1016/j.forsciint.2006.08.011. PMID: 17027209.
crossref pmid
15. Udhaya K, Sarala Devi KV, idhar J Sr. 2011; Regression equation for estimation of length of humerus from its segments: a South Indian population study. J Clin Diagn Res. 5:783–6.
16. Wright LE, Vásquez MA. 2003; Estimating the length of incomplete long bones: forensic standards from Guatemala. Am J Phys Anthropol. 120:233–51. DOI: 10.1002/ajpa.10119. PMID: 12567377.
crossref pmid
17. Duyar I, Pelin C. 2003; Body height estimation based on tibia length in different stature groups. Am J Phys Anthropol. 122:23–7. DOI: 10.1002/ajpa.10257. PMID: 12923901.
crossref pmid
18. Cochran WG. 1977. Sampling techniques. 3rd ed. John Whiley and Sons;New York:
19. Goto R, Mascie-Taylor CG. 2007; Precision of measurement as a component of human variation. J Physiol Anthropol. 26:253–6. DOI: 10.2114/jpa2.26.253. PMID: 17435374.
crossref
20. Sen J, Kanchan T, Ghosh A, Mondal N, Krishan K. 2014; Estimation of stature from lengths of index and ring fingers in a North-eastern Indian population. J Forensic Leg Med. 22:10–5. DOI: 10.1016/j.jflm.2013.11.010. PMID: 24485413.
crossref pmid
21. Haas J, Buikstra JE, Ubelaker DH. 1994. Standards for data collection from human skeletal remains: proceedings of a seminar at the field museum of natural history. 44th ed. Arkansas archeological survey;Fayetteville:
22. Campobasso CP, Di Vella G, Introna F Jr. 1998; Using scapular measurements in regression formulae for the estimation of stature. Boll Soc Ital Biol Sper. 74:75–82. PMID: 10874984.
pmid
23. Igwe M, Akpuaka FC. 2013; Stature estimation from measurement of scapula of Igbos of South-East Nigeria. J Exp Res. 1:44–6.
24. Aboul-Hagag KE, Mohamed SA, Hilal MA, Mohamed EA. 2011; Determination of sex from hand dimensions and index/ring finger length ratio in upper Egyptians. Egypt J Forensic Sci. 1:80–6. DOI: 10.1016/j.ejfs.2011.03.001.
crossref
25. Soni G, Dhall U, Chhabra S. 2010; Determination of sex from femur: discriminant analysis. J Anat Soc India. 59:216–21. DOI: 10.1016/S0003-2778(10)80029-2.
crossref

Fig. 1
Diagram of the scapula. ACD, acromio-coracoid distance; LAB, length of axial border; LIL, length of infraspinous line; LSL, length of supraspinous line; LSS, length of scapular spine; MLA, maximum length of acromion process; MLC, maximum length of coracoid process; MLS, maximum length of scapular.
acb-54-1-51-f1.tif
Fig. 2
Radiograph image of scapula. AB=MLS, CD=LSS, EF=MLG, and BG=LAB. LAB, length of axial border; LSS, length of scapular spine; MLG, maximum length of glenoid fossa; MLS, maximum length of scapular.
acb-54-1-51-f2.tif
Table 1
Technical error from the measurement of scapula parameters using bones and radiographs
S/N Variable Intra-observer error Inter-observer error


TEM[b] [r] R[b] [r] TEM[b] [r] R[b] [r]
1 MLS 0.322 0.326 0.98 0.98 0.321 0.318 0.98 0.98
2 LSS 0.335 0.283 0.98 0.98 0.335 0.281 0.98 0.98
3 LSL 0.155 - 0.98 - 0.155 - 0.98 -
4 LIL 0.245 - 0.98 - 0.245 - 0.98 -
5 ACD 0.134 - 0.98 - 0.134 - 0.98 -
6 MLA 0.077 - 0.98 - 0.077 - 0.98 -
7 MLC 0.134 - 0.98 - 0.134 - 0.98 -
8 MLG 0.063 0.071 0.99 0.98 0.063 0.071 0.99 0.98
9 MBG 0.045 - 0.98 - 0.045 - 0.98 -
10 LAB 0.190 0.195 0.98 0.98 0.190 0.195 0.98 0.98

S/N, serial number; MLS, maximum length of scapular; LSS, length of scapular spine; LSL, length of supraspinous line; LIL, length of infraspinous line; ACD, acromio-coracoid distance; MLA, maximum length of acromion process; MLC, maximum length of coracoid process; MLG, maximum length of glenoid fossa; MBG, maximum breadth of glenoid fossa; LAB, length of axial border; TEM, technical error of measurement; R, coefficient of reliability; [b], bones; [r], radiograph.

Table 2
Descriptive statistics of the mean and range of the different parameters of scapula
S/N Variable Right (n=300) Left (n=300) Combined (n=600)


Minimum Maximum Mean±SD Minimum Maximum Mean±SD Mean±SD
1 MLS 9.70 17.60 14.89±1.36 10.00 17.30 14.83±1.12 14.86±1.24
2 LSS 7.70 18.80 12.63±1.40 9.30 14.80 12.91±1.09 12.77±1.26
3 LSL 2.30 4.90 3.54±0.82 2.20 5.50 3.33±0.68 3.44±0.76
4 LIL 5.80 11.70 8.64±0.91 5.40 11.80 8.51±0.83 8.57±0.87
5 ACD 3.90 8.00 6.73±0.81 5.30 8.30 6.98±0.67 6.86±0.75
6 MLA 3.10 4.80 3.94±0.41 3.30 5.10 3.88±0.41 3.91±0.41
7 MLC 2.00 5.30 4.25±0.48 1.80 5.70 4.15±0.64 4.20±0.56
8 MLG 2.70 3.90 3.38±0.30 2.70 4.60 3.49±0.35 3.43±0.33
9 MBG 1.20 2.90 2.38±0.27 1.80 3.70 2.53±0.32 2.45±0.30
10 LAB 8.90 15.10 12.56±0.98 9.00 15.20 12.72±1.00 12.64±0.99

S/N, serial number; SD, standard deviation; Unit, cm MLS, maximum length of scapular; LSS, length of scapular spine; LSL, length of supraspinous line; LIL, length of infraspinous line; ACD, acromio-coracoid distance; MLA, maximum length of acromion process; MLC, maximum length of coracoid process; MLG, maximum length of glenoid fossa; MBG, maximum breadth of glenoid fossa; LAB, length of axial border.

Table 3
Univariate analysis of the different parameters correlated with the length of scapula
S/N Variable Right (n=300) Left (n=300) Combined (n=600)


C SE M P-value C SE M P-value C SE M P-value
1 LSS 7.47 0.08 0.59 0.000* 5.45 0.06 0.73 0.000* 6.82 0.05 0.63 0.000*
2 LSL 12.64 0.05 0.63 0.000* 12.56 0.04 0.68 0.000* 12.64 0.03 0.65 0.000*
3 LIL 6.12 0.05 1.02 0.000* 6.47 0.05 0.98 0.000* 6.31 0.04 1.00 0.000*
4 ACD 9.92 0.05 0.94 0.000* 9.03 0.04 0.83 0.000* 9.73 0.03 0.75 0.000*
5 MLA 7.04 0.02 1.99 0.000* 10.05 0.02 1.23 0.000* 8.57 0.02 1.61 0.000*
6 MLC 7.78 0.03 1.67 0.000* 11.24 0.04 0.86 0.000* 10.02 0.02 1.15 0.000*
7 MLG 6.46 0.02 2.49 0.000* 13.34 0.02 0.43 0.021* 10.60 0.01 1.24 0.000*
8 MBG 9.21 0.02 2.39 0.000* 12.16 0.02 1.06 0.000* 11.19 0.01 1.49 0.000*
9 LAB 0.66 0.06 1.13 0.000* 5.79 0.06 0.71 0.000* 3.37 0.04 0.91 0.000*

S/N, serial number; C, regression constant; SE, standard error; M, coefficient of regression Unit, cm; LSS, length of scapular spine; LSL, length of supraspinous line; LIL, length of infraspinous line; ACD, acromio-coracoid distance; MLA, maximum length of acromion process; MLC, maximum length of coracoid process; MLG, maximum length of glenoid fossa; MBG, maximum breadth of glenoid fossa; LAB, length of axial border. *Significant at P<.005.

Table 4
Descriptive statistics of the mean and range of the different parameters of male and female scapula using radiographs
S/N Variable Right Left Combined


Male (n=153) Female (n=147) Male (n=153) Female (n=147) Male (n=153) Female (n=147) Male (n=153) Female (n=147) Male (n=306) Female (n=294)
1 MLS 10.8–17.6 10.9–16.4 15.33±1.28 14.57±1.14 12.5–17.3 10.8–16.5 15.26±1.02 14.51±0.96 15.29±1.16 14.54±1.05
2 LSS 7.8–18.8 7.7–18.8 12.94±1.25 12.40±1.43 10.5–14.8 10.3–14.6 13.25±0.94 12.66±1.09 13.09±1.11 12.53±1.27
3 MLG 2.7–3.9 2.7–3.8 3.46±0.31 3.31±0.25 3.0–4.6 2.7–4.6 3.48±0.32 3.50±0.38 3.47±0.31 3.41±0.34
4 LAB 9.2–15.1 9.2–13.9 12.80±0.94 12.41±0.83 10.1–15.2 9.2–14.8 12.93±0.91 12.57±0.95 12.86±0.93 12.49±0.90

Values are presented as mean±SD. SD, standard deviation; S/N, serial number; Unit, cm; MLS, maximum length of scapular; LSS, length of scapular spine; MLG, maximum length of glenoid fossa; LAB, length of axial border.

Table 5
Univariate analysis of the different parameters correlated with the length of male/ female scapulae using radiographs
S/N Variable C SE M P-value C SE M P-value C SE M P-value
Male right (n=153) Male left (n=153) Combined (n=306)
1 LSS 9.03 0.10 0.49 0.000* 6.10 0.08 0.69 0.000* 8.16 0.06 0.55 0.000*
2 MLG 7.37 0.03 2.30 0.000* 14.10 0.03 0.33 0.203 10.87 0.02 1.28 0.000*
3 LAB 0.97 0.08 1.12 0.000* 6.47 0.07 0.68 0.000* 3.71 0.05 0.90 0.000*
Female right (n=147) Female left (n=147) Combined (n=294)
1 LSS 8.08 0.12 0.52 0.000* 7.25 0.09 0.57 0.000* 7.84 0.07 0.53 0.000*
2 MLG 9.37 0.02 1.57 0.000* 13.36 0.03 0.33 0.120 12.39 0.02 0.63 0.001*
3 LAB 2.55 0.07 0.97 0.000* 7.75 0.08 0.54 0.000* 5.60 0.05 0.72 0.000*

S/N, serial number; C, regression constant; SE, standard error; M, coefficient of regression Unit, cm; LSS, length of scapular spine; MLG, maximum length of glenoid fossa; LAB, length of axial border. *Significant at P<0.05.

Table 6
Descriptive statistics of the mean and range and Univariate analysis of the different parameters of Scapula irrespective of side or sex using radiographs
S/N Variable Minimum (cm) Maximum (cm) Mean±SD (cm) C SE M P-value
1 MLS 10.80 17.60 14.93±1.17 - - - -
2 LSS 7.70 18.80 12.82±1.23 7.470 0.050 0.582 0.000*
3 MLG 2.70 4.60 3.44±0.33 11.368 0.013 0.013 0.000*
4 LAB 9.20 15.20 12.68±0.93 3.998 0.038 0.862 0.000*

S/N, serial number (n=600); SD, standard deviation; C, regression constant; SE, standard error; M, coefficient of regression; MLS, maximum length of scapular; LSS, length of scapular spine; MLG, maximum length of glenoid fossa; LAB, length of axial border. *Significant at P<0.05.

Table 7
Population, mean scapula length and best parameter for predicting length
References Population Mean length (cm) Best parameter
Campobasso et al. (1998) [22] Italian Male=14.62 Males - MB MBG
Female=12.97 Females - MLC MBG
Kui et al. (2016) [8] Chines Male=16.73 LAM
Female=15.77
Igwe and Akpuaka (2013) [23] South-east Nigeria Male=14.00 Nile
Female=13.50
Current study Nigerians Bones
Right=14.89 MLG, LAB
Left=14.83 LIL
Combined=14.86 LIL, LAB
Radiographs
Male right=15.33 MLG, LAB
Left=15.26 LSS
Combined= 15.29 MLG, LAB
Female right=14.57 LAB
Left=14.51 LSS
Combined=14.54 LAB
All radiographs=14.92 LAB

MB, maximum breadth of scapula; MBG, maximum breadth of glenoid fossa; MLC, maximum length of the coracoid; LAM, length of axillary margin; MLG, maximum length of glenoid fossa; LAB, length of axial border; LIL, length of infraspinous line; LSS, length of scapular spine.

TOOLS
Similar articles