Journal List > Blood Res > v.55(S1) > 1146565

Shukla, Tripathi, Verma, and Awasthi: Prognostic value of TNF-α-308 and IFN-γ-874 single nucleotide polymorphisms and their plasma levels in patients with aplastic anemia

Abstract

Background

Aplastic anemia (AA), an unusual hematological disease, is characterized by hypoplasia of the bone marrow and failure to form blood cells of all three lineages resulting in pancytopenia. This study aimed to investigate TNF-α-308 and IFN-γ-874 gene polymorphisms and their respective plasma protein levels in patients with AA and healthy controls.

Methods

Two hundred and forty individuals were included in this study; the case group comprised 120 AA patients, while 120 healthy individuals served as controls. Genotyping was performed using the PCR-restriction length fragment polymorphism method and TNF-α-308 and IFN-γ-874 plasma levels were evaluated using an ELISA kit.

Results

There was a significantly higher prevalence of the IFN-γ-874 genotype in patients with AA than in healthy controls, while the TNF-α-308 genotype was associated with lower risk of developing AA. Furthermore, the levels of both TNF-α-308 and IFN-γ-874 were higher in the plasma of AA patients.

Conclusion

Our findings suggest that the IFN-γ-874 genotype may be a greater risk factor in the causation of AA, whereas the TNF-α-308 genotype has a protective role in the North Indian population.

INTRODUCTION

Aplastic anemia (AA) is an unusual hematological disease defined by hypoplasia of the marrow and failure to form blood cells of all three lineages [1, 2]. The term AA is a misnomer as the disorder causes pancytopenia more than anemia [3]. The incidence of AA varies from 1.4 to 14 cases per million population [4]. The pathophysiology of AA was initially considered to be related to mere exposure to chemicals such as benzene or chloramphenicol. However, recent studies have shown that there are several other factors that cause immune dysregulation leading to AA [5]. The mechanism of immune dysregulation involves T-cell activation and cytokine production [6].
Recent studies have shown that defective functioning of regulatory T-cells leads to increased production of interferon gamma (IFN-γ) and tissue necrosis factor (TNF-α), causing stem cell injury, leading to bone marrow aplasia [7, 8]. Cytokine gene polymorphisms due to single nucleotide polymorphisms (SNPs) involved in AA are TNF-α and IFN-γ-874, the overproduction of which leads to immune destruction of hematopoietic stem cells (HSCs) [9]. An array of cytokines play a major role in the proliferation and differentiation of hematopoietic stem cells [10]. Two major cytokines, IFN-γ and TNF-α, are involved in the hematopoietic suppression and pathogenesis of acquired AA [11]. The human TNF gene is found on chromosome 6p21.3, spans approximately 3 kb, and contains four exons. It is an inflammatory cytokine. The TNF gene contains a single functional SNP, TNF-α-308 G/A, which is one of the most studied SNPs [6]. The human IFN-γ gene is found on chromosome 12q14, is a marker of immune system activity, and may itself be a mediator of bone marrow cell destruction. IFN-γ is a key pro-inflammatory cytokine that has a defensive role in host resistance against cancer and also contributes towards essential disease pathology. The IFN-γ gene contains two common polymorphisms, 874 A/T and 875 C/A, which may have functional products following gene transcription [12].
The current study was undertaken to evaluate cytokine gene polymorphisms in a North Indian population. We examined both cytokine gene polymorphisms (TNF-α-308 and IFN-γ-874) in our patients and in healthy controls to validate the genetic theory. In addition, we assessed the association of variants of these cytokines with clinical parameters, disease severity, and the response of patients with AA to immune suppressive therapy (IST).

MATERIALS AND METHODS

A case control study was carried out with AA patients attending the Clinical Hematology outpatient department (OPD) of King George’s Medical University (KGMU) in Lucknow, Uttar Pradesh, India, from March 2015 to August 2018.

Inclusion/exclusion criteria

Patients who were diagnosed with acquired AA were included in the study after obtaining their written informed consent. Subjects with bone marrow aplasia due to chemotherapy and/or radiotherapy, or bone marrow aplasia attributable to conditions such as PNH, Fanconi anemia, and hypoplastic MDS were excluded from the study. Subjects who were not willing to participate in the study were also excluded.
The diagnosis, classification (severe AA, non-severe AA, and very severe AA), and response assessment of AA were made following standard guidelines (Marsh et al., 2009; Camitta et al., 1975; Bacigalupo et al., 1988) [13].

Data collection

All data were collected using a predesigned questionnaire. Patients and/or their guardians were interviewed for data pertaining to the study, including demographic details and environmental factors. The study was approved by the Institutional Ethics Committee of KGMU.

Sample collection and genotyping

Five mL of peripheral blood was drawn into an ethylenediaminetetraacetic acid (EDTA) vial under aseptic conditions. Of this, 2 mL was used for genomic DNA extraction using Qiagen Kit (Qiagen, Hilden, Germany) and 3 mL was used for ELISA. The protocol followed that in the Qiagen instruction manual. Quality estimation of all extracted DNA samples was performed using 0.8% agarose gel electrophoresis. Genotyping of both SNPs (TNF-α-308 and IFN-γ-874) was performed using the PCR-restriction length fragment polymorphism method [14].
The primers used for the amplification of TNF-α-308 were: forward 5'-AGGCAATAGGTTTTGAGGGCCAT-3'; reverse, 5'-TCCTCCCTGCTCCGATTCCG-3', and primers used for the amplification of IFN-γ-874 were: forward, 5'-GATTTTA TTCTTACAACACAAAATCAAGAC-3'; reverse, 5'-GCAAA GCCACCCCACTATAA-3'.
The PCR reaction was performed using a DNA thermal cycler (Eppendorf Mastercycler Nexus Thermal Cyclers, Hamburg, Germany). PCR amplification was carried out on a final sample volume of 20 mL (3 mL DNA, 10 mL Top Taq PCR Master Mix, 1 mL primer; each forward and reverse, and 5 mL distilled water). The thermal cycler was programmed as follows for the different genes: TNF-α-308 gene polymorphism, PCR conditions were the same except for a change in annealing temperature to 62.3°C for 45 seconds; IFN-γ-874 gene polymorphism, the annealing temperature was 58°C for 45 seconds. The amplified PCR product was then electrophoresed on a 2.0% agarose gel.

Digestion of the amplified product by specific restriction enzymes for each polymorphism

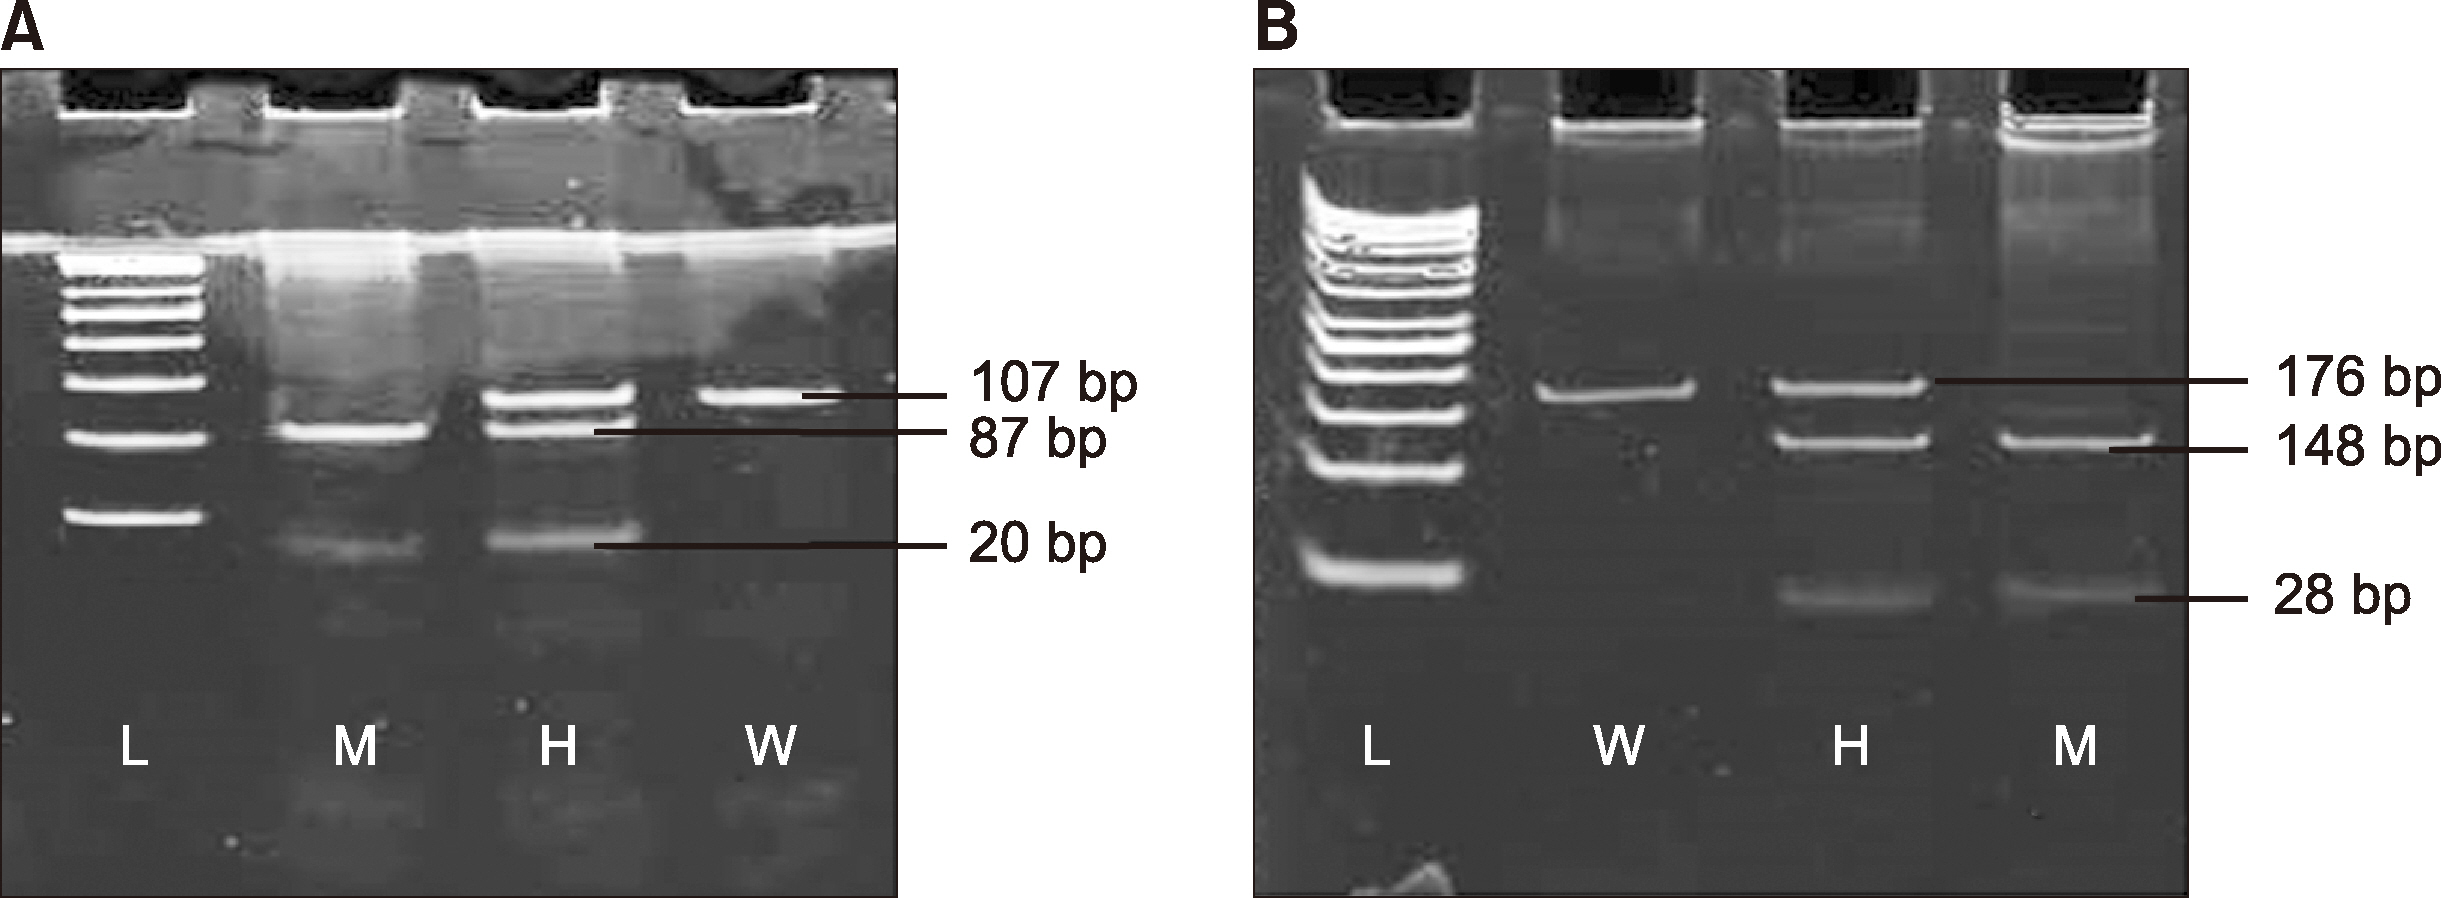
The amplified PCR product (10 mL) mixed with a restriction enzyme (1 mL; New England Biolabs, Hitchin, UK) was used in the reaction. The reaction mixture was incubated for 2 h at 37°C. The digested products underwent gel electrophoresis in the range of 1.5–3%. The separated fragments were then stained with EtBr and visualized along with a ladder using the molecular imager gel doc XR System (Bio-Rad, Hercules, CA, USA). The details of the restriction enzymes and their resulting base pair lengths are shown in Table 1. The gel pictures of TNF-α-308, IFN-γ-874 gene polymorphisms are shown in Fig. 1.

Measurement of plasma TNF-α and IFN-γ levels

Three mL of peripheral blood was drawn into an EDTA-containing vial. For isolation of the plasma, samples were centrifuged for 15 min at 2,500×g. Plasma levels of TNF-α and IFN-γ were evaluated using a commercially available ELISA kit (Abcam, Cambridge, MA, USA). This kit was used to identify cytokines using specific monoclonal antibodies according to the manufacturer’s instructions.

Statistical analysis

All data were double-entered in Microsoft Excel. Statistical analysis was performed using SPSS (version 17.0, SPSS Inc., Chicago, IL, USA). Univariate analysis was performed for categorical variables expressed as percentage and frequencies, and the mean and standard deviation was calculated for continuous variables. The chi-square test was used for categorical variables and the Hardy-Weinberg Equilibrium (HWE) was analyzed for all cases and controls separately. Bivariate logistic regression analysis was used to calculate the odds ratio (OR). Statistical significance was defined as P<0.05. Three genetic models were used to determine the significant association between the genotypes and AA. In the dominant model, the wild-type homozygous genotype was compared with the union of heterozygous and mutant genotypes. In the over-dominant model, the combined values of wild-type homozygous and mutant homozygous were compared with those of the heterozygous genotype. In the recessive model, mutant homozygous was compared with the combined values of heterozygous and wild type homozygous.

RESULTS

Two hundred and forty subjects were enrolled in the study (120 patients 120 and healthy controls). The ratio of male to female AA patients was 70:30. Severity was categorized as: non-severe AA (NSAA), 46.7%; severe AA (SAA), 44.2%; and very severe AA (VSAA), 9.1%. The demographic variables and clinical features of AA patients and healthy controls are summarized in Table 2.

Evaluation of TNF-α-308 and IFN-γ-874 polymorphisms and susceptibility to developing AA

Individuals with the IFN-γ-874 genotype showed significant susceptibility to developing AA, while the TNF-α-308 genotype was found to be protective, with carriers demonstrating a lower risk of developing AA (Table 3). Carriers of the heterozygous (GA) TNF-α-308 genotype showed a lower risk, and carriers of the heterozygous (AT) IFN-γ-874 genotype showed a significantly higher risk of developing AA relative to healthy controls [OR, 0.56; 95% CI, 0.32–0.98; P=0.043; (OR, 1.76; 95% CI, 1.00–3.10; P=0.047, repsecitvley)]. Table 3 depicts the genetic models for a polymorphism (IFN-γ-874) for which a significant association was observed in the over-dominant model (AT vs. AA+TT) (OR, 1.80; 95% CI, 1.05–3.09; P=0.030).

Evaluation of TNF-α-308 and IFN-γ-874 polymorphisms in NSAA, SAA, and VSAA

Notably, no significant association was observed between the TNF-α-308 genotype and severity of AA (Table 4). The frequency of the heterozygous (AT) IFN-γ-874 genotype demonstrated significant association with NSAA vs. control (OR, 2.06; 95% CI, 1.00–4.22; P=0.046). On the other hand, Table 4 shows the possible genetic models among the groups with different AA severity, which showed no significant association with the severity of AA or controls.

Evaluation of TNF-α-308 and IFN-γ-874 polymorphisms in response to IST

No significant association between TNF-α-308 or IFN-γ-874 and response to IST in patients with acquired AA was observed (Table 5). Similarly, in genetic models, a comparison was made between complete and partial responders with non-responders, and none of which were found to be significant (Table 5).

Plasma concentrations of TNF-α-308 and IFN-γ-874 in patients with AA and controls

TNF-α and IFN-γ plasma levels were higher in 70.8% and 77.5% of patients with AA relative to those in controls, respectively. The highest levels were observed in VSAA patients, with a mean of 76.35±1.95 pg/mL for TNF-α and 81.23±2.01 pg/mL for IFN-γ. Significantly higher TNF-α and IFN-γ concentrations were also observed in SAA patients, with a mean of 25.71±1.81 pg/mL for TNF-α and 28.29±1.89 pg/mL for IFN-γ. No significant difference was observed in NSAA patients (Fig. 2).

DISCUSSION

The pathogenesis of AA involves changes in cell susceptibility, damage to HSCs, and development of an abnormal hematopoietic environment, which might result in bone marrow failure [7]. Dysfunction of cytokines and T-cell subsets might be key reasons for the development of AA [15-17]. The mechanisms involved in AA primarily comprise a cell-mediated killing and discharge of T-helper cytokines, such as IFN-γ and TNF-α, with an inhibitory effect on NK cells [18, 19]. To evaluate the association of cytokine gene polymorphisms with susceptibility, severity, and response to IST, we studied the IFN-γ-874 and TNF-α-308 polymorphisms and found that IFN-γ-874 may be involved in the development of AA. The IFN-γ-874 gene was found to be strongly associated with susceptibility to developing AA and disease severity, which is in agreement with earlier research on the subject [20, 21]. TNF-α-308 positively correlated with AA in our population; this result is not in agreement with earlier findings available on the subject [22]. This inconsistency might be due to the smaller sample size, selection criteria, ethnicity, and geographical variation of study subjects.
Several studies on the role of polymorphisms in AA have been carried out, but this is the first study from North India on the subject. As predicted, the IFN-γ-874 gene polymorphism showed similar results as reported in the literature [21]. No association was recorded in both the inflammatory cytokines after IST between AA and with those of control. Our results are in disagreement with previous reports that showed an association after IST [23, 24].
A significant number of AA patients had increased levels of TNF-α and IFN-γ in their blood plasma, and these levels were significantly higher in patients in the severe and very severe groups than in the control group. This is the first study performed in India showing elevated TNF-α and IFN-γ levels in the blood of AA patients.
AA is a rare blood disorder, and this study is important as it is the first study from north India. Limitations of the study include the small sample size, selection criteria, ethnicity, and geographical variation of the population involved in the study.
In conclusion, our results suggest that polymorphism in the IFN-γ-874 gene is associated with the development of AA, but there is no such association for TNF-α-308. Furthermore, these results conclusively indicate that polymorphisms affecting cytokine gene polymorphisms will be helpful in the understanding of AA. Additional studies are required with a larger sample size to validate that cytokine gene polymorphism and its strong association with AA and response to IST.

ACKNOWLEDGMENTS

The authors are grateful to the participants enrolled in the study, staff members of the department for their extended help in hematological services, and especially thank the Indian Council of Medical Research without whose financial contribution it would not have been possible to carry out the study.

Notes

*This study was supported by a grant from the Indian Council of Medical Research.

Authors’ Disclosures of Potential Conflicts of Interest

No potential conflicts of interest relevant to this article were reported.

REFERENCES

1. Dezern AE, Brodsky RA. 2011; Clinical management of aplastic anemia. Expert Rev Hematol. 4:221–30. DOI: 10.1586/ehm.11.11. PMID: 21495931. PMCID: PMC3138728.
crossref
2. Issaragrisil S, Kaufman DW, Anderson T, et al. 2006; The epidemiology of aplastic anemia in Thailand. Blood. 107:1299–307. DOI: 10.1182/blood-2005-01-0161. PMID: 16254144. PMCID: PMC1895423.
crossref
3. Cuglievan B, DePombo A, De Angulo G. 2016; Aplastic anemia: the correct nomenclature matters. Haematologica. 101:e391. DOI: 10.3324/haematol.2016.146522. PMID: 27582572. PMCID: PMC5060039.
crossref
4. Malhotra P, Gella V, Guru Murthy GS, Varma N, Varma S. 2016; High incidence of aplastic anemia is linked with lower socioeconomic status of Indian population. J Public Health (Oxf). 38:223–8. DOI: 10.1093/pubmed/fdv027. PMID: 25755247.
crossref
5. Shallis RM, Ahmad R, Zeidan AM. 2018; Aplastic anemia: etiology, molecular pathogenesis, and emerging concepts. Eur J Haematol. 101:711–20. DOI: 10.1111/ejh.13153. PMID: 30055055.
crossref
6. Romagnani S. 2004; The increased prevalence of allergy and the hygiene hypothesis: missing immune deviation, reduced immune suppression, or both? Immunology. 112:352–63. DOI: 10.1111/j.1365-2567.2004.01925.x. PMID: 15196202. PMCID: PMC1782506.
crossref
7. Medinger M, Drexler B, Lengerke C, Passweg J. 2018; Pathogenesis of acquired aplastic anemia and the role of the bone marrow microenvironment. Front Oncol. 8:587. DOI: 10.3389/fonc.2018.00587. PMID: 30568919. PMCID: PMC6290278.
crossref
8. Luzzatto L, Risitano AM. 2018; Advances in understanding the pathogenesis of acquired aplastic anaemia. Br J Haematol. 182:758–76. DOI: 10.1111/bjh.15443. PMID: 29974931.
crossref
9. Kastrinaki MC, Pavlaki K, Batsali AK, et al. 2013; Mesenchymal stem cells in immune-mediated bone marrow failure syndromes. Clin Dev Immunol. 2013:265608. DOI: 10.1155/2013/265608. PMID: 24386000. PMCID: PMC3872391.
crossref
10. Zhang CC, Lodish HF. 2008; Cytokines regulating hematopoietic stem cell function. Curr Opin Hematol. 15:307–11. DOI: 10.1097/MOH.0b013e3283007db5. PMID: 18536567. PMCID: PMC2677548.
crossref
11. Sun W, Wu Z, Lin Z, et al. 2018; Macrophage TNF-α licenses donor T cells in murine bone marrow failure and can be implicated in human aplastic anemia. Blood. 132:2730–43. DOI: 10.1182/blood-2018-05-844928. PMID: 30361263. PMCID: PMC6307988.
crossref
12. Araujo Z, Palacios A, Biomon R, et al. 2017; Concordance between IFNγ gene +874 A/T polymorphism and interferon-γ expression in a TB-endemic indigenous setting. Rev Soc Bras Med Trop. 50:199–207. DOI: 10.1590/0037-8682-0398-2016. PMID: 28562756.
crossref
13. Marsh JC, Ball SE, Cavenagh J, et al. 2009; Guidelines for the diagnosis and management of aplastic anaemia. Br J Haematol. 147:43–70. DOI: 10.1111/j.1365-2141.2009.07842.x. PMID: 19673883.
crossref
14. Yadav DK, Tripathi AK, Gupta D, et al. 2017; Interleukin-1B (IL-1B-31 and IL-1B-511) and interleukin-1 receptor antagonist (IL-1Ra) gene polymorphisms in primary immune thrombocytopenia. Blood Res. 52:264–9. DOI: 10.5045/br.2017.52.4.264. PMID: 29333402. PMCID: PMC5762736.
15. Xiao Y, Zhao S, Li B. 2017; Aplastic anemia is related to alterations in T cell receptor signaling. Stem Cell Investig. 4:85. DOI: 10.21037/sci.2017.09.07. PMID: 29167806. PMCID: PMC5676186.
crossref
16. Zheng M, Liu C, Fu R, et al. 2015; Abnormal immunomodulatory ability on memory T cells in humans with severe aplastic anemia. Int J Clin Exp Pathol. 8:3659–69. PMID: 26097547. PMCID: PMC4466934.
17. Yu Z, Huang Z, Dai X, Wu X, Huang J. 2014; Th1/Th2 imbalance in the pathogenesis of chronic aplastic anemia. J Hard Tissue Biol. 23:455–60. DOI: 10.2485/jhtb.23.455.
crossref
18. Găman A, Găman G, Bold A. 2009; Acquired aplastic anemia: correlation between etiology, pathophysiology, bone marrow histology and prognosis factors. Rom J Morphol Embryol. 50:669–74. PMID: 19942964.
19. Mavroudi I, Papadaki HA. 2012; Genetic associations in acquired immune-mediated bone marrow failure syndromes: insights in aplastic anemia and chronic idiopathic neutropenia. Clin Dev Immunol. 2012:123789. DOI: 10.1155/2012/123789. PMID: 22956967. PMCID: PMC3432560.
crossref
20. Zhang JY, Chang H, Meng WT. 2008; The polymorphism of interferon gamma gene CA short tandem repeat is associated with aplastic anemia. Sichuan Da Xue Xue Bao Yi Xue Ban. 39:23–5. PMID: 18390192.
21. Deng S, Lin S, Shen J, Zeng Y. 2020; The relationship between interferon gamma (IFN-γ) single nucleotide polymorphism +874(T/A) and occurrence risk of aplastic anemia: a meta-analysis. Hematology. 25:85–90. DOI: 10.1080/16078454.2019.1631508. PMID: 32063160.
22. Zayed RA, Abdel-Hamid SM, El-Lithy H. 2016; The association of cytokine genes polymorphisms and susceptibility to aplastic anemia in Egyptian patients. Hematology. 21:106–12. DOI: 10.1179/1607845415Y.0000000038. PMID: 26214243.
crossref
23. Bestach Y, Sieza Y, Attie M, et al. 2015; Polymorphisms in TNF and IFNG are associated with clinical characteristics of aplastic anemia in Argentinean population. Leuk Lymphoma. 56:1793–8. DOI: 10.3109/10428194.2014.966707. PMID: 25248876.
24. Chang H, Zeng F, Zhang JY, et al. 2010; Association of the interferon-gamma single nucleotide polymorphism +874(T/A) with response to immunosuppressive therapy in patients with severe aplastic anemia. Blood Cells Mol Dis. 45:313–6. DOI: 10.1016/j.bcmd.2010.09.003. PMID: 20934357.
crossref

Fig. 1
(A) TNF-α-308 (G/A) poly-morphism; GG: wild homozygous (107 bp), GA: heterozygous (107 bp, 87 bp, and 20 bp), AA: mutant (87 bp and 20 bp), L: molecular weight ladder (50 bp ladder). (B) IFN-γ-874 (A/T) polymorphism; AA: wild homozygous (176 bp), AT: heterozygous (176 bp, 148 bp, and 28 bp), TT: mutant (148 bp and 28 bp), L: molecular weight ladder (50bp ladder).
BR-55-193-f1
Fig. 2
Plasma levels of IFN-γ in patients vs. healthy controls (A). Plasma levels of TNF-α in patients vs. healthy controls (B).
BR-55-193-f2
Table 1
Genotyping information of TNF-α-308 and IFN-γ- 874 single nucleotide polymorphisms.
Gene SNP name Primer sequence (5′–3′) Restriction enzyme Recognition sequence Wild type fragment length Variant (mutant) type fragment length Heterozygous type fragment length
TNF-α-308 F:5′-AGGCAATAGGTTTTGAGGGCCAT-3′ NCo1 5′-C|CATGG-3′ 107 bp (GG) 87 bp and 20 bp (AA) 107 bp, 87 bp, and 20 bp (GA)
R:5′-TCCTCCCTGCTCCGATTCCG-3′ 5′-GGTAC|C-3′
IFN-γ-874 F:5′-GATTTTATTCTTACAACACAAAATCAAGAC-3′ Hinf1 5′-G|ANTC-3′ 176 bp (AA) 148 bp and 28 bp (TT) 176 bp, 148 bp, and 28 bp (AT)
R:5′-GCAAAGCCACCCCACTATAA-3′ 5′-CTNA|G-3′

Abbreviation: bp, base pair.

Table 2
Demographic details of patients with acquired aplastic anemia and healthy control subjects.
Characteristics Patients (N=120) Controls (N=120)
Age, mean yr±SD 29.13±16.4 27.92±8.9
Sex
Male (%) 83 (69.2) 62 (51.7)
Female (%) 37 (30.8) 58 (48.3)
Patients classification on the basis disease severity
Severity
Severe (%) 53 (44.2) 0 (0)
Non-severe (%) 56 (46.7) 0 (0)
Very severe (%) 11 (9.1) 0 (0)
Patients categorization on the basis of response to immunosuppressive therapy
Response to immunosuppressive therapy
Responder (complete+partial) (%) 63 (52.5) 0 (0)
Non-responder (%) 57 (47.5) 0 (0)
Table 3
Genotype and allele frequencies of the TNF-α-308 and IFN-γ-874 cytokine gene among patients with acquired aplastic anemia and healthy controls and their association with acquired aplastic anemia.
Gene polymorphism Patients (%), N=120 Controls (%), N=120 P OR (95% CI)
TNF-α-308 (G/A) genotype
GG (wild) 70 (58.3%) 85 (70.8%) - Reference
AA (mutant) 6 (5%) 5 (6%) 0.546 0.68 (0.20–2.34)
GA (hetero) 44 (36.7%) 30 (36) 0.043a) 0.56 (0.32–0.98)
Allele frequency
G 184 (0.77) 200 (0.83) - Reference
A 56 (0.23) 40 (0.17) 0.067 0.65 (0.41–1.03)
Dominant 70 (58.3%) 85 (70.8%) - Reference
GG vs. GA+AA 50 (41.7%) 35 (29.2%) 0.042a) 0.57 (0.33–0.98)
Over-dominant 76 (63.3%) 90 (75%) - Reference
GA vs. GG+AA 44 (36.7%) 30 (25%) 0.050 0.57 (0.33–1.00)
Recessive 114 (95%) 115 (95.8%) - Reference
AA vs. GG+GA 6 (5%) 5 (4.2%) 0.757 0.82 (0.24–2.78)
IFN-γ-874 (A/T) genotype
AA (wild) 66 (55.0%) 55 (45.83%) - Reference
TT (mutant) 20 (16.67%) 15 (12.5%) 0.785 0.90 (0.42–1.92)
AT (hetero) 34 (28.33%) 50 (41.67%) 0.047a) 1.76 (1.00–3.10)
Allele frequency
A 166 (0.70) 160 (0.67) - Reference
T 74 (0.30) 80 (0.33) 0.557 1.12 (0.76–1.64)
Dominant 66 (55.0%) 55 (45.8%) - Reference
AA vs. AT+TT 54 (45.0%) 65 (54.2%) 0.155 1.44 (0.86–2.40)
Over-dominant 86 (71.6%) 70 (58.3%) - Reference
AT vs. AA+TT 34 (28.4%) 50 (41.7%) 0.030a) 1.80 (1.05–3.09)
Recessive 100 (83.3%) 105 (87.5%) - Reference
TT vs. AA+AT 20 (16.7%) 15 (12.5) 0.360 0.71 (0.34–1.47)

a)Statistically significant susceptible genotype.

Abbreviations: CI, confidence interval; OR, odds ratio.

Table 4
Genotype distribution of the TNF-α-308 and IFN-γ-874 gene polymorphisms among patients with non-severe, severe, and very severe aplastic anemia vs. controls.
Genotype Severe (N=53) Non-severe (N=56) Very-severe
(N=11)
Control (N=120) Severe patients
and controls
Non-severe patients
and controls
Very-severe
and controls


P OR (95% CI) P OR (95% CI) P OR (95% CI)
TNF-α-308 (G/A)
GG (wild) 30 (56.60%) 36 (64.28%) 4 (36.36%) 85 (70.83%) - Reference - Reference - Reference
AA (mutant) 3 (5.66%) 2 (3.57%) 1 (9.09%) 5 (4.16%) 0.441 0.58 (0.13–2.61) 0.999 1.05 (0.19–5.71) 0.282 0.23 (0.02–2.51)
GA (hetero) 20 (37.73%) 18 (32.14%) 6 (54.54%) 30 (25.0%) 0.073 0.52 (0.26–1.06) 0.330 0.70 (0.34–1.42) 0.032 0.23 (0.06–0.89)
Dominant 30 (56.60%) 36 (64.28%) 4 (36.36%) 85 (70.83%) - Reference - Reference - Reference
GG vs. GA+AA 23 (43.39%) 20 (35.71%) 7 (63.63%) 35 (29.16%) 0.067 0.53 (0.27–1.05) 0.382 0.74 (0.37–1.45) 0.037 0.23 (0.06–0.85)
Over-dominant 33 (62.26%) 38 (67.85%) 5 (45.45%) 90 (75.0%) - Reference - Reference - Reference
GG+AA vs. GA 20 (37.73%) 18 (32.14%) 6 (54.54%) 30 (25.0%) 0.088 0.55 (0.27–1.09) 0.321 0.70 (0.35–1.41) 0.035 0.27 (0.07–0.97)
Recessive 50 (94.33%) 54 (96.42%) 10 (90.90%) 115 (95.83%) - Reference - Reference - Reference
GG+GA vs. AA 3 (5.66%) 2 (3.57%) 1 (9.09%) 5 (4.16%) 0.701 0.72 (0.16–3.15) 0.999 1.17 (0.22–6.24) 0.415 0.43 (0.04–4.09)
IFN-γ-874 (A/T)
AA (wild) 27 (50.94%) 34 (60.71%) 5 (45.45%) 55 (45.83%) - Reference - Reference - Reference
TT (mutant) 10 (18.86%) 7 (12.5%) 3 (27.27%) 15 (12.5%) 0.515 0.73 (0.29–1.85) 0.578 1.32 (0.49–3.58) 0.376 0.45 (0.09–2.12)
AT (hetero) 16 (30.18%) 15 (26.78%) 3 (27.27%) 50 (41.67%) 0.247 1.53 (0.74–3.17) 0.046a) 2.06 (1.00–4.22) 0.721 1.51 (0.34–6.67)
Dominant 27 (50.94%) 34 (60.71%) 5 (45.45%) 55 (45.83%) - Reference - Reference - Reference
AA vs. AT+TT 26 (49.05%) 22 (39.28%) 6 (54.54%) 65 (54.16%) 0.534 1.22 (0.64–2.34) 0.065 1.82 (0.95–3.48) 0.980 0.98 (0.28–3.40)
Over-dominant 37 (69.81%) 41 (73.21%) 8 (72.72%) 70 (58.33%) - Reference - Reference - Reference
AT vs. AA+TT 16 (30.18%) 15 (26.78%) 3 (27.27%) 50 (41.66%) 0.151 1.65 (0.82–3.29) 0.056 1.95 (0.97–3.90) 0.523 1.90 (0.48–7.54)
Recessive 43 (81.13%) 49 (87.5%) 8 (72.72%) 105 (87.5%) - Reference - Reference - Reference
TT vs. AA+AT 10 (18.86%) 7 (12.5%) 3 (27.27%) 15 (12.5%) 0.272 0.61 (0.25–1.47) 0.999 1.00 (0.38–2.61) 0.176 0.38 (0.09–1.59)

a)Statistically significant susceptible genotype.

Abbreviations: CI, confidence interval; OR, odds ratio.

Table 5
TNF-α-308 and IFN-γ-874 genotype distribution in responders (complete+partial responders) and non-responders.
Gene polymorphism Complete+partial responder (N=63) Non-responder (N=57) P OR (95% CI)
TNF-α-308 genotype
GG (wild) 35 (55.6%) 35 (61.4%) - Reference
AA (mutant) 4 (6.3%) 2 (3.5%) 0.675 0.50 (0.08–2.91)
GA (hetero) 24 (38.0%) 20 (35.0%) 0.636 0.83 (0.39–1.77)
Dominant 35 (55.6%) 35 (61.4%) - Reference
GG vs. GA+AA 28 (44.5%) 22 (38.6%) 0.516 0.78 (0.37–1.62)
Over-dominant 39 (61.9%) 37 (64.9%) - Reference
GG+AA vs. GA 24 (38.0%) 20 (35.0%) 0.732 0.87 (0.41–1.85)
Recessive 59 (93.6%) 55 (96.4%) - Reference
GG+GA vs. AA 4 (6.34%) 2 (3.5%) 0.681 0.53 (0.09–3.04)
IFN-γ-874 Genotype
AA (wild) 31 (49.2%) 35 (61.4%) - Reference
AT (hetero) 20 (31.7%) 14 (24.5%) 0.261 0.62 (0.26–1.43)
TT (mutant) 12 (19.1%) 8 (14.1%) 0.307 0.59 (0.21–1.63)
Dominant 31 (49.2%) 35 (61.4%) - Reference
AA vs. AT+TT 32 (50.8%) 22 (38.6%) 0.179 0.60 (0.29–1.26)
Over-dominant 43 (68.2%) 43 (75.4%) - Reference
AA+TT vs. AT 20 (31.8%) 14 (24.6%) 0.383 0.70 (0.31–1.56)
Recessive 51 (80.9%) 49 (85.9%) - Reference
AA+AT vs. TT 12 (19.1%) 8 (14.1%) 0.461 0.69 (0.26–1.84)

Abbreviations: CI, confidence interval; OR, odds ratio.

TOOLS
Similar articles