

 PDF
PDF Citation
 Print
Print


INTRODUCTION
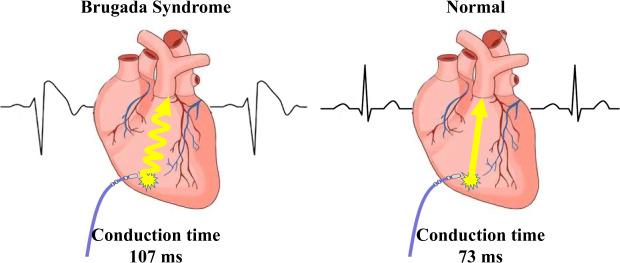
The exact mechanism of Brugada syndrome (BrS) is still unclear, with different researchers favoring either the repolarization or the depolarization hypothesis. According to the latter, one key mechanism is the right ventricle (RV) conduction delay, and several studies have attempted to evaluate ventricular activation time. For example, Van Malderen et al.1 demonstrated RV mechanical delays in 34 patients with BrS. Furthermore, the prolonged longitudinal electrical delay of the RV has only been verified in a small number of patients with BrS.2 In most previous studies, sample size has been limited and the patients' underlying disease was heterogeneous. The purpose of the present study is to demonstrate RV longitudinal electrical conduction delays in patients with BrS.
METHODS
Study population
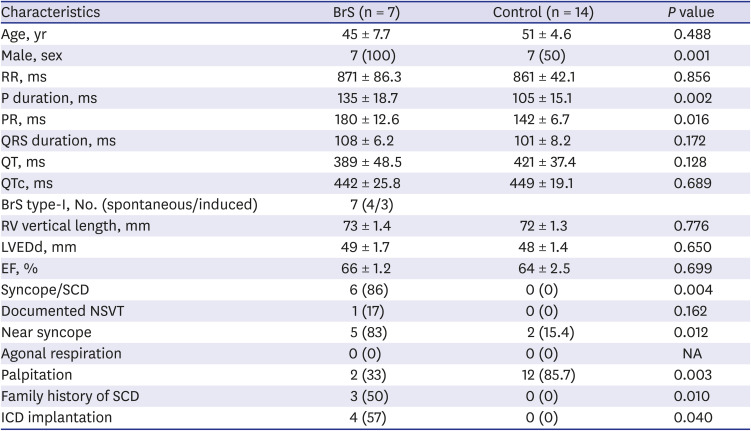
This retrospective, single-center study was performed in both controls (n = 14) and patients with BrS (n = 7). BrS was diagnosed according to the 2015 ESC guidelines.3 We classified the BrS electrocardiogram (ECG) type at the time of diagnosis. In the controls, electrophysiology studies (EPSs) were performed to identify palpitations or presyncope. Controls were required to have a normal ECG, a normal echocardiography, and a negative ventricular tachycardia induction test. The patient characteristics are described in Table 1.
Table 1
Group characteristics
Data are expressed as mean ± standard error or number of patients.
QTc = QT interval corrected by Bazett formula, BrS = Brugada syndrome, LVEDd = left ventricular end diastolic diameter, EF = ejection fraction, SCD = sudden cardiac death, NSVT = non-sustained ventricular tachycardia, ICD = implantable cardioverter defibrillator, NA = not applicable.
Measurement of conduction time
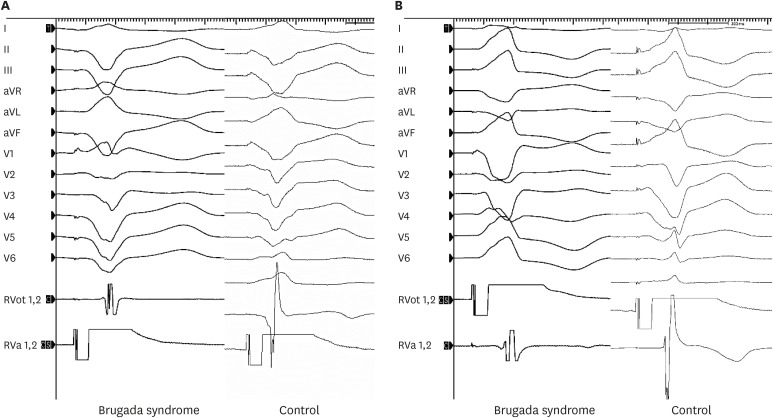
The EPS was performed in a state of normal electrolytes and no chronotropic agent at the baseline. Electrical mapping of the RV endocardium was performed during RV endocardial stimulation using two quadripolar mapping catheters (Tango™; 5F, Boston Scientific, Marlborough, MA, USA) (Fig. 1). One catheter was placed in the RV outflow tract (RVOT) and the other in the RV apex (RVA). These catheter locations are the sites most often used in conventional EPSs (Fig. 1). The stimulation was performed at twice the diastolic threshold using a drive train of eight stimuli (S1) at basic cycle lengths of 600, 500, and 400 ms in the RVOT and RVA. The conduction time was defined as the interval from stimulation to intrinsic activation deflection in the endocardial bipolar RV electrograms, measured using the Prucka-Cardiolab (GE Medical Systems, Chicago, IL, USA) (Fig. 2). All electrograms were measured by three independent observers, each of whom measured the values twice; the mean values of these measurements were used to compose the raw data. The RVOT-to-RVA and RVA-to-RVOT conduction times were measured at the 8th S1 stimulus. The measurements were performed before and 10 minutes after isoproterenol infusion (2 µg/min). Electrograms of poor quality and those obscured by extrasystoles were excluded. When the driving cycle length was slower than the resting cycle length, the stimulation was omitted. The difference in conduction time depending on the wave-front direction was calculated as the RVA-to-RVOT time minus the RVOT-to-RVA time.
Fig. 1
Electrical mapping of the RV endocardium was performed during RV endocardial stimulation using two quadripolar mapping catheters. The RVA catheter is located at the RVA. The RVOT catheter is placed along the long axis of the RVOT. Pacing and mapping were performed from the distal electrode pair. (A) Right anterior oblique view. (B) Left anterior oblique view.
RV = right ventricle, RVA = right ventricular apex, RVOT = right ventricular outflow tract.
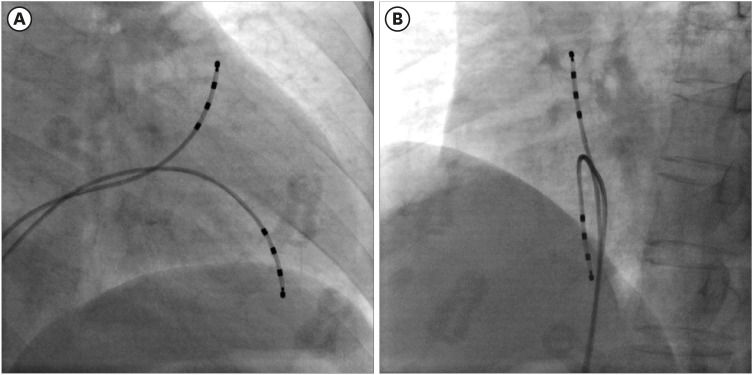
Fig. 2
The stimulation was performed at twice the diastolic threshold using a drive train of eight stimuli at basic cycle lengths of 600, 500, and 400 ms in the RVOT and RVA. (A) RVA-to-RVOT conduction time. (B) RVOT-to-RVA conduction time. The conduction time was defined as the interval from the stimulation to the intrinsic activation deflection in the endocardial bipolar electrogram.
aVR = augmented vector right, aVL = augmented vector left, aVF = augmented vector foot, RVA = right ventricular apex, RVOT = right ventricular outflow tract.
Statistical analysis
Statistical analyses were performed using SPSS 25.0 software (SPSS, Inc., Chicago, IL, USA). Shapiro–Wilk analysis was performed to verify normal distribution, and variables were compared using Mann-Whitney rank-sum test. Continuous variables are presented as mean ± standard error. We used a two-tailed analysis, with clinical significance defined as P values < 0.05.
Ethics statement
The present study protocol was reviewed and approved by the ethics committee at Chonnam National University Hospital, Gwangju, Korea (CNUH-2020-033). All patients that fulfilled these criteria agreed to use the retrospective clinical and electrophysiological data for the purpose of study. Written informed consents were provided by all participants.
RESULTS
The absolute value of skewness and kurtosis of all variables were not larger than 1.5. Also, the P value of Shapiro-Wilk normality test was larger than 0.05. The clinical presentations of the patients are described in Table 1. The ECG shapes and conduction time values of individual patients with BrS are described in Table 2. All patients with BrS had type-I pattern, according to the ECG results. Age did not differ significantly between groups (BrS vs. control, 45 ± 7.7 vs. 51 ± 4.6, P = 0.488). The patients with BrS had a longer P-wave duration (135 ± 18.7 ms vs. 105 ± 15.1 ms, P = 0.002) and a longer PR interval (180 ± 12.6 ms vs. 142 ± 6.7 ms, P = 0.016). There was no significant difference in QRS width (108 ± 6.2 ms vs. 101 ± 8.2 ms, P = 0.172) nor left ventricular ejection fraction (66 ± 1.2% vs. 64 ± 2.5%, P = 0.699). Implantable cardioverter defibrillator (ICD) was implanted in 4 patients in whom spontaneous or induced ventricular fibrillation (VF) were identified. Three patients refused ICD. In a state of sinus rhythm, the RVOT tended slower than RVA in the BrS group, but no significance (time from RVOT to RVA, −3.6 ± 20.74 ms vs. 5.7 ± 12.77 ms, P = 0.115).
Table 2
The characteristics of individual patient with Brugada syndrome
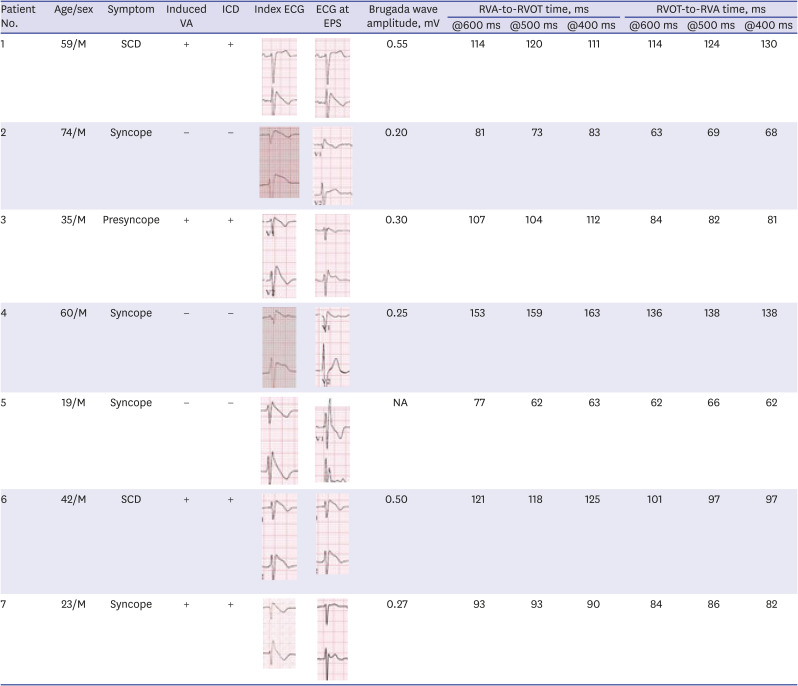


The RVA-to-RVOT (upward) conduction time was longer in the patients with BrS than the controls (Table 3, Fig. 3). The ICD-implanted patients with BrS had longer upward conduction time than the controls (stimulation at 600 ms, 109 ± 6.0 ms vs. 73 ± 3.4 ms, P = 0.001; stimulation at 500 ms, 109 ± 6.3 ms vs. 74 ± 4.2 ms, P = 0.003; stimulation at 400 ms, 110 ± 7.2 ms vs. 73 ± 5.1 ms, P = 0.006). The RVOT-to-RVA (downward) conduction time was longer in the patients with BrS than the controls except in stimulation at 600 ms (Table 3, Fig. 3). The ICD-implanted patients with BrS had longer downward conduction time than the controls (stimulation at 600 ms, 96 ± 7.3 ms vs. 71 ± 3.6 ms, P = 0.006; stimulation at 500 ms, 97 ± 9.5 ms vs. 62 ± 4.1 ms, P = 0.001; stimulation at 400 ms, 98 ± 11.4 ms vs. 64 ± 4.6 ms, P = 0.010). The patients with BrS had a larger difference in the conduction time (RVA-to-RVOT minus RVOT-to-RVA) than controls during stimulation at 600 ms (BrS vs. control, 15 ± 2.9 ms vs. 0.4 ± 1.5 ms, P = 0.003). The longitudinal conduction time did not differ significantly when isoproterenol was administered (Table 3). In the BrS group, the conduction time and BrS ST-segment amplitudes at the EPS are plotted in Fig. 4.
Table 3
Right ventricular longitudinal conduction time
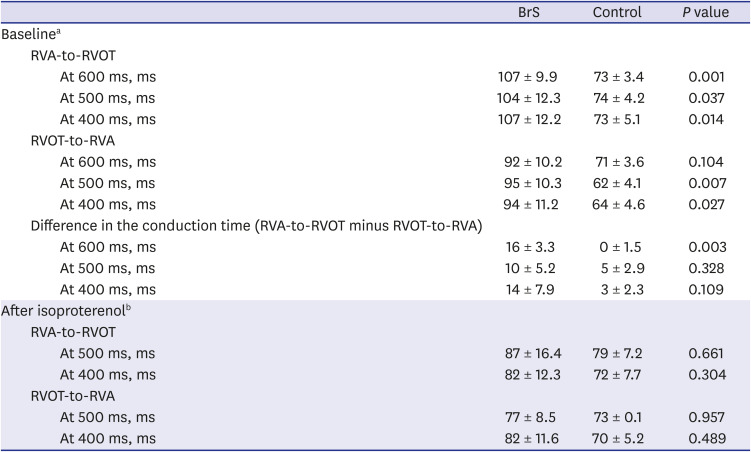
Fig. 3
Conduction time in BrS and control. (A) RVA-to-RVOT (upward) conduction time. (B) RVOT-to-RVA (downward) conduction time. The RVA-to-RVOT (upward) conduction time in patients with BrS was significantly longer than in the control. The patients with ICD implantation were presented with dotted line and the patients without ICD implantation were presented with solid line.
RVA = right ventricular apex, RVOT = right ventricular outflow tract, BrS = Brugada syndrome, ICD = implantable cardioverter defibrillator, S1 = stimuli.
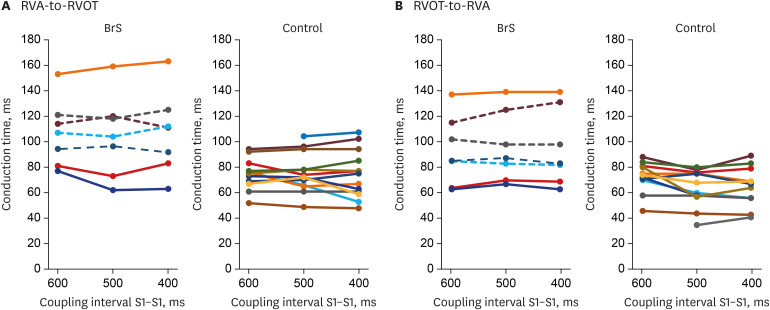
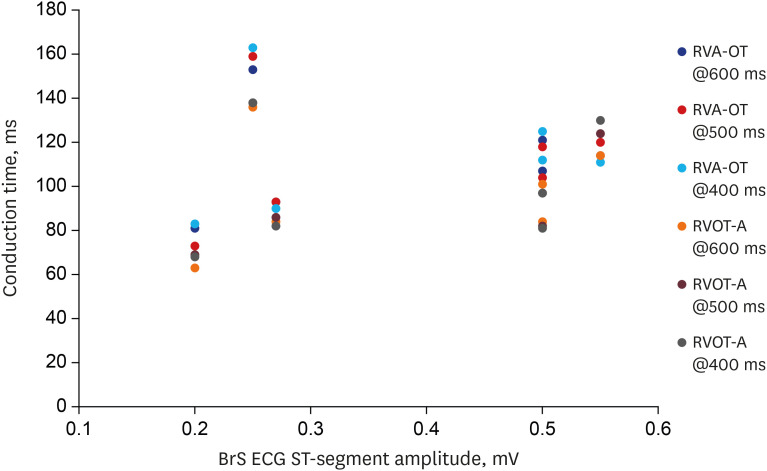
Fig. 4
Plotting of the conduction time and BrS ST-segment amplitudes at the electrophysiology study. It shows an almost linear correlation except for one outlier.
BrS = Brugada syndrome, RVA-OT = right ventricular apex to outflow tract, RVOT-A = right ventricular outflow tract to apex, ECG = electrocardiogram.
DISCUSSION
BrS is characterized by a coved-type pattern of the J wave in ECG lead V1 or V2. It is associated with sudden cardiac death resulting from fatal ventricular arrhythmias. For more than two decades, researchers have presented conflicting evidence regarding the mechanism of BrS.
The repolarization hypothesis of BrS could be explained in terms of ionic and cellular mechanisms. BrS is associated with mutations in more than 12 different genes, namely SCN5A (Nav1.5), CACNA1C (Cav1.2), CACNB2b (Cavβ2b), CACNA2D1 (Cavα2δ), GPD1L, SCN1B (β1-subunit of the Na+ channel), KCNE3 (MiRP2), SCN3B (β3-subunit of the Na+ channel), KCNJ8, and KCND3.456789101112 In this genetic environment, a loss-of-function mutation in the INa and ICa, or a gain-of-function mutation in the Ito or IK-ATP, may create vulnerable action potential (AP) substrates in the ventricular myocardium,13 increasing the net outward current in phase 1. This manifests as a coved-type ST elevation pattern due to the transmural voltage gradients. When transmural dispersion of repolarization occurs, so-called phase-2 re-entry is induced by a heterogeneous regional loss-of-dome AP in the epicardium. This theory is known as the repolarization hypothesis.
The depolarization hypothesis could be explained with a difference in conduction times. Loss-of-function mutations of an SCN5A reduce sodium current which is the main depolarization current. So, Vmax of the membrane AP and membrane excitability are reduced. Thus, conduction delays are induced. The conduction delay between the RVA and RVOT generates the BrS coved-type ECG. QRS width is one indicator of conduction delay. In the present study, QRS was not significantly wider in the patients with BrS than in controls, although it did show a tendency toward greater width. One study by Hayashi et al.14 supports these QRS findings, reporting that patients with BrS who had inducible VF had a wider paced-QRS than patients with BrS who did not have inducible VF. Unlike QRS, the patients with BrS showed a longer P-wave duration and a longer PR interval in the present study. Interestingly, longer P-wave duration and longer PR and HV intervals were identified in SCN5A mutation carriers by some studies.1516 Therefore, we think that BrS might not be a disease confined only to the ventricle. In terms of depolarization theory, a key mechanism of BrS is heterogeneity in the regional conduction velocity of the ventricular myocardium.17 Wilde et al.18 explained that, in patients with BrS, RVOT conduction is delayed and the AP gradient between the RVA and RVOT creates Brugada-pattern ECG. This RV activation delay was verified by echocardiography,1 the conduction time in an explanted heart, and computer simulation. Postema et al.2 reported that patients (n = 10) with type-I BrS displayed RV electrical conduction delay when compared to those with non-type-I BrS or controls. In the present study, all patients had type-I BrS (n = 7). The RVA-to-RVOT conduction time was longer in the patients with BrS. Especially, BrS with an ICD appeared to have much longer conduction time at all stimulating rate (Fig. 3). We believe it suggests more vulnerable patients with BrS have longer RV conduction time. Also, we think that the conduction times have a wide range because the high-risk patients who have long conduction times and low-risk patients are blended. The dynamic change of Brugada pattern ECG is one of the characteristics of BrS. At the time of EPS in the present study, only 2 patients showed type-I Brugada pattern ECG (Table 2). It might have affected the conduction times. If all of them showed type-I Brugada patterns at the EPS, the conduction delay might have been more prominent. Indeed, when the conduction time and BrS ST-segment amplitudes at the EPS are plotted, it shows an almost linear correlation except for one outlier (patient #4) (Fig. 4). At the time of EPS, all patients were diagnosed already. So, we did not use sodium channel blocker, ajmaline or flecainide.
Generally, during sinus rhythm, activation of RVOT is faster than that of RVA. In the present study, the RVA-to-RVOT conduction time was longer in patients with BrS than in controls. This finding is compatible with studies in SCN5A transgenic mice,19 in which a conduction delay was identified. The conduction delays in the RVA-to-RVOT direction seemed to be caused by slow cell-to-cell conduction via ventricular myocytes, not via a specialized cardiac conduction system such as Purkinje fibers. In the present study, the upward conduction time was longer than the downward conduction time. This is consistent with the finding of more severe delays during RVA stimulation, which does not involve a specialized conduction system, than during sinus rhythm, which does involve such a system. With RVOT stimulation, the direction of impulse propagation is similar to sinus rhythm. Thus, we reasoned that upward conduction likely uses more anisotropic cell-to-cell electrical transmission. According to the depolarization hypothesis,18 cell-to-cell conduction from the RVA to the RVOT plays a key role in creating a closed-loop circuit between the RVA and RVOT. Conduction delay in the RV results in late activation of the RVOT. The AP of the RVOT is delayed with respect to other APs in the RV. The membrane potential at the RVA is more positive than at the RVOT, so it plays a role by driving intercellular current to the RVOT, which acts as a sink.
However, it is not clear what causes this augmented cell-to-cell conduction delay. According to the definition of BrS, the patients with BrS have to have structurally normal RVs, although histological and magnetic resonance imaging studies have reported microstructural changes like some fibrosis and reduced connexin expression.20 So, it may be that the cell-to-cell conduction delay result from a reduced sodium current without macrostructural abnormality.19212223 Eventually, such a microstructural change may cause a current-to-load mismatch, impairing cell-to-cell coupling and perhaps resulting in conduction delay between the RVA and RVOT, simultaneously or additionally, mutation leading to reduced sodium current may contribute to conduction delays. In the present study, we admit that the delay in upward longitudinal conduction reflects the depolarization hypothesis. However, about 200-ms difference in the conduction time is necessary to produce a BrS coved-type pattern ECG.18 The difference was only about 100 ms in the present study.
Notably, the longitudinal conduction time did not differ significantly after isoproterenol administration in the present study. According to Pierpont et al.,24 adrenergic innervation is higher in the basal ventricle, and isoproterenol augments ICa current. We believe that this is why the conduction time did not differ after isoproterenol administration in the present study. This is consistent with the well-known ameliorative effect of β-adrenergic activity in BrS.25
The main finding of the present study suggested that the BrS phenotype could be attributed to a depolarization abnormality. However, the depolarization hypothesis is insufficient to explain all experimental evidence and rate dependency.1826 Conversely, the repolarization hypothesis is insufficient to explain the little clinical demonstration and the low incidence of arrhythmias.18 Therefore, it remains unclear how much depolarization or repolarization abnormalities contribute to the BrS phenotype. Hence, it cannot be claimed that only one of the hypotheses plays the major role in the BrS mechanism. The major limitation of this study is too few patients enrolled. Even though we did our best to make it statistically-reasonable, lots of effort to clarify the mechanism in more patients will be needed.
 XML Download