

 PDF
PDF Citation
 Print
Print


INTRODUCTION
The current coronavirus disease 2019 (COVID-19) pandemic reminds us of the previous influenza pandemics of 1918 H1N1 Spanish, 1957 H3N2 Hong Kong, and 2009 H1N1 influenzas. In 1918, a new influenza virus emerged with the conditions of World War I. The vulnerability of healthy young adults and lack of vaccines or reliable treatments created a major public health crisis, causing at least 50,000,000 deaths worldwide.1
Since the inactivated influenza vaccine was licensed in 1945, it has been produced annually to target the influenza viruses that will circulate that particular year.12 Although there is variability in matching vaccine to virus between seasons, a recent report shows that the influenza vaccine can reduce the risk of illness by 19 to 60% when most circulating viruses are matched.3 However, even though influenza vaccines are available, 5 to 15% of the world's population is infected with the influenza virus annually. At least 3,000,000–5,000,000 people are severely affected by seasonal influenza each year, which leads to 290,000-650,000 deaths.4
As the world strives to formulate a COVID-19 vaccine, this research questions influenza vaccine effectiveness (VE) by monitoring its effect on children. In many countries, influenza activity and VE are reported each year as interim analyses to better understand the epidemic and prepare for the next season.56
In Korea, the government started the national immunization program (NIP) for influenza, covering adults aged 65 years and older in 2005. This program was expanded to include infants aged 6 to 12 months in 2016, 6 to 59 months in 2017, and children aged 6 months to 12 years for the 2018–2019 season.78 However, there is little data regarding VE in the structured annual report for the Korean population, and no annual VE data after influenza NIP was expanded.
During the influenza season, children with an influenza-like illness often visit the emergency department (ED); most are discharged after being examined with on-site influenza antigen testing. Although influenza epidemics can result in patient overload at EDs, children visiting the ED provide a solid study population. We analyzed influenza VE among patients visiting the ED of a tertiary hospital with consideration of various underlying medical conditions. This is the study to evaluate influenza VE in children after NIP expanded to cover children from 6 months to 12 years old.
METHODS
Study design and participants
Patients tested for influenza antigens from October 1st, 2018 to May 31st, 2019 at the pediatric emergency room of Samsung Medical Center were included in this test-negative design study to evaluate VE.9 Patients younger than six months old as of September 1st, 2018 were excluded. We also excluded patients with unclear or missing influenza vaccination histories. Sex, age, influenza vaccination history, known underlying medical conditions, and influenza antigen test results were collected via chart review. We used underlying medical conditions to group patients as previously healthy, those with hematology-oncology (HO) disease, or those with other underlying diseases.
Influenza vaccination in 2018–2019 season
Influenza vaccination history was collected from electronic medical records that are written based on parents' reports during the ED visits. For the 2018–2019 season, NIP provided free influenza vaccinations to high-risk persons, including children from 6 months to 12 years old. For this season, viruses included in the trivalent influenza vaccines were an A/Michigan/45/2015 (H1N1)pdm09-like virus, an A/Singapore/INFIMH-16-0019/2016 (H3N2)-like virus, and a B/Colorado/06/2017-like virus (Victoria lineage). There was an additional influenza B vaccine, with a B/Phuket/3073/2013-like virus (Yamagata lineage) in quadrivalent influenza vaccines.101112
Influenza antigen test
In this study, children visiting the ED with influenza-like symptoms, such as fever, chills, muscle or body aches, headaches, and any respiratory symptoms were tested for influenza antigens. Considering their immunocompromised condition, HO patients received antigen testing for any fever. Specimens were obtained with a nasopharyngeal swab and sent to the hospital's laboratory for testing. Analysis was carried out with the BD VeritorTM system for rapid detection of flu A+B using the CLIA waived device and kit (Becton, Dickinson and Company, Franklin Lakes, NJ, USA). In patients with multiple visits, the test was considered influenza-positive if any of the multiple visits was positive.
Statistics
The VE was evaluated by calculating and comparing the influenza infection rates for the vaccinated and the unvaccinated groups.
To confirm the effects on influenza antigen positivity and hospitalization we fitted logistic regression models and obtained adjusted odds ratios (OR) with 95% confidence intervals (CIs). Predictors such as age, sex, presence of underlying disease, and influenza vaccination history were used in the univariable or multivariate analyses, and multicollinearity was checked by variance inflation factor values in the model. Subgroup analysis was based on age group and the presence of underlying disease.
The adjusted OR for influenza test positivity between vaccinated and unvaccinated patients was estimated using logistic regression models after adjustment for sex, age group, underlying disease group, and vaccination history. The VE estimates with 95% CIs were calculated using the following formula: (1 – [adjusted] OR) × 100%.913 The χ2 test was used to compare influenza A and B infection between the earlier and latter halves of the study period.
All statistical analyses were carried out using R (version 3.6.1; R Development Core Team, www.r-project.org) and SAS (version 9.4; SAS Institute, Cary, NC, USA). All P values were two-sided; values < 0.05 indicated statistical significance.
RESULTS
Patients
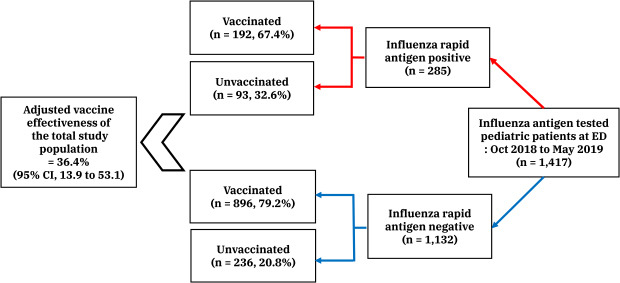
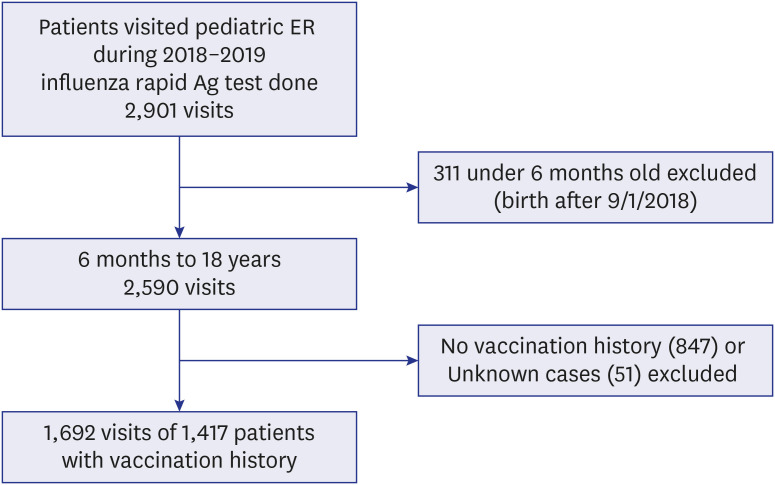
A total of 2,901 visits with influenza rapid antigen test results from between October 1st, 2018 and May 31st, 2019 were reviewed. Some 1,692 visits of 1,417 patients were included for analysis, after excluding 311 visits of patients who were born after September 1st, 2018 and 898 visits of patients without vaccination histories (Fig. 1).
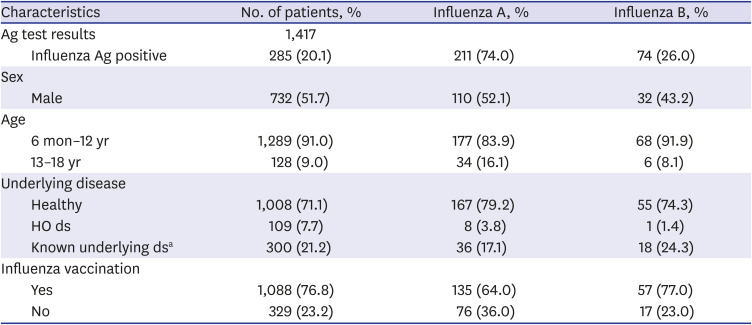
Among the 1,417 patients with test results, 285 patients (20.1%) were positive (influenza A, n = 211, 74.0%; influenza B, n = 74, 26.0%). No patients were infected with both influenza A and B during the study period. Medical conditions were categorized into three groups: previously healthy (n = 1,008, 71.1%); HO disease (n = 109, 7.7%); and known underlying diseases other than HO (n = 300, 21.2%). Details of these medical conditions are provided in Table 1.
Table 1
Patient demographics
Ag = antigen, ds = disease, HO = hematology-oncologic.
aPatients with underlying diseases other than HO; neurology (n = 53), nephrology/urology (n = 45), cardiology (n = 43), neonatology (n = 36), pulmonology (n = 34), gastroenterology (n = 23), genetic disorder (n = 20), endocrinology (n = 12), allergy (n = 10), primary immunodeficiency (n = 10), congenital anomaly other than heart disease (n = 5), skin disease (n = 2), latent tuberculosis (n = 2), Kikuchi's disease (n = 2), psychiatric disease (n = 1), chronic abscess (n = 1), chronic otitis media (n = 1).
Vaccination rate and VE
Influenza vaccination rate was lower in influenza-positive cases than in negative cases (67.4% vs. 79.2%, respectively, P < 0.001).
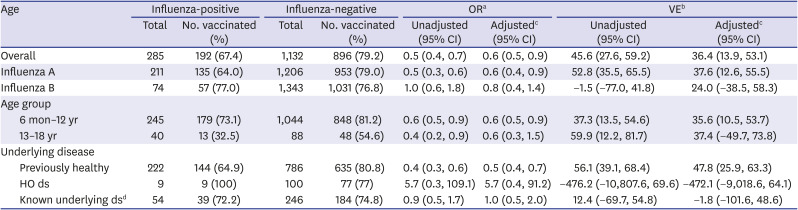
The VE in all patients was 36.4% (95% CI, 13.9 to 53.1). The VE for influenza A was 37.6% (95% CI, 12.6 to 55.5) and the VE for influenza B was 24.0% (−38.5 to 58.3). Estimated VEs for the age group 6 months to 12 years and the age group 13 to 18 years were 35.6% (95% CI, 10.5 to 53.7) and 37.4% (95% CI, −49.7 to 73.8), respectively. The VE for previously healthy children was 47.8% (95% CI, 25.9 to 63.3) compared to −1.8% (95% CI, −101.6 to 48.6) in patients with known underlying diseases (Table 2).
Table 2
Influenza vaccine effectiveness in age groups newly covered by the national immunization program
Variables associated with influenza infection
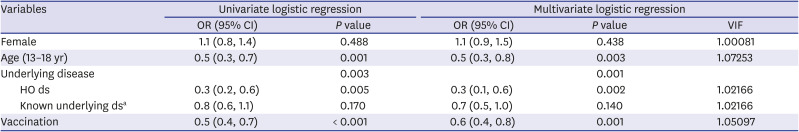
In a multivariate logistic regression model, patients who received influenza vaccination had lower rates of influenza virus infection (OR, 0.6; 95% CI, 0.4 to 0.8; P = 0.001), with significant confounding factors being age group 13-18 years (OR, 0.5; 95% CI, 0.3 to 0.8; P = 0.003) and underlying HO disease (OR, 0.3; 95% CI, 0.1 to 0.6; P = 0.002) (Table 3).
Table 3
Multivariate logistic regression model of factors affecting influenza antigen positivity
Seasonality in different countries
Fig. 2 shows the changes in the influenza virus test-positive rates for the 2018–2019 season from our study. Influenza virus-positive cases peaked in December 2018 with a test-positive rate of 34.0% (range, 3.5 to 34.0% during study period). This season had two peaks, with the first peak of influenza A in December 2018 and the second peak of influenza B in April 2019. Influenza A (n = 177, 97.3%) was dominant in the first half of season, with more influenza B infection in the season's latter half (n = 69, 67.0%) (P < 0.001).
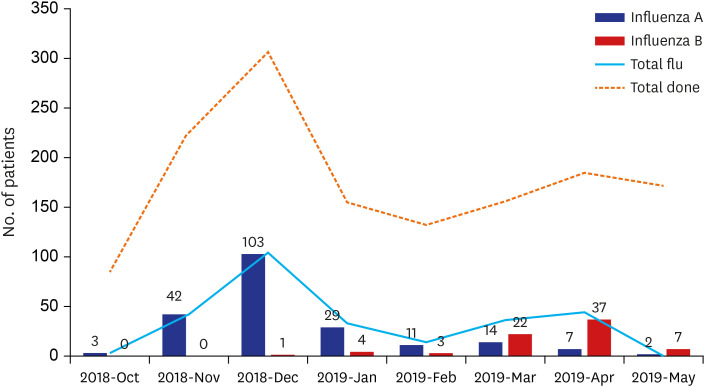
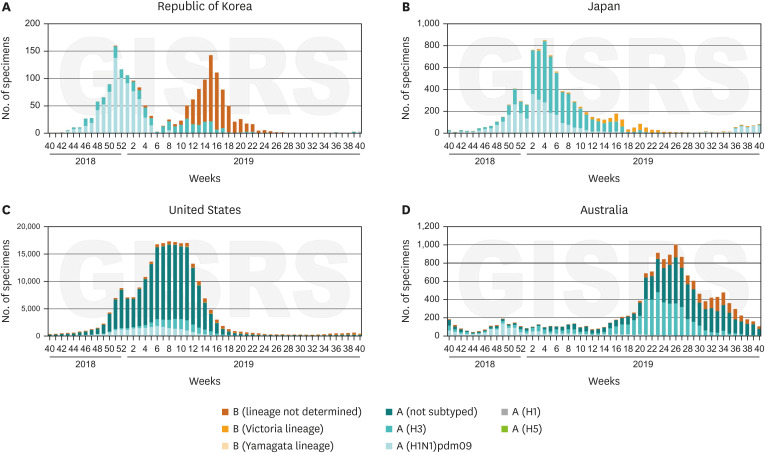
Fig. 3 shows influenza virus subtype distribution in Korea, Japan, and the United States during the 2018–2019 season, and in Australia during the 2019 season based on published data from WHO FluNet-CHARTS.14 Interestingly, only the one major peak caused by influenza A was observed in the other countries, while Korean national data showed two peaks of influenza A and influenza B.
DISCUSSION
This study was conducted after the NIP was expanded to provide free influenza vaccinations for 6-month to 12-year-old children in Korea. We analyzed the vaccination rates and the VE in children tested for influenza antigens at the ED.
The vaccination rate for the total study population was 76.8%, which is similar to the 73.5% reported by Korea Centers for Disease Control and Prevention (KCDC).15 In this study, the study population was divided into two age groups: 6 months to 12 years old (NIP group) and 13 to 18 years old (non-NIP group). The vaccination rate for the NIP group (79.7%) was higher than that for non-NIP group (47.7%). Among the NIP group, vaccination rates were lower in older sub-groups (6–35 months, 84.2%; 36–59 months, 76.6%; 60–83 months, 81.5%; 7–9 years, 74.8%; and 10–12 years, 67.7%) This is also similar to the KCDC data (6–35 months, 88.1%; 36–59 months, 81.2%; 60–83 months, 77.2%; 7–9 years, 70.1%; and 10–12 years, 58.3%).1516 In the United States, the vaccination rates for the 2018–2019 season were 73% for ages 6 months to 4 years, and 59% for ages 5 to 17 years.5 The differences in the vaccination rates might result from different vaccination policies. National vaccination policy in the United States covers children from 6 months to 5 years of age.17 In Australia, only children from 6 months to 5 years of age with the underlying disease receive free influenza vaccination, and there is no government-provided influenza vaccination at all in Japan.1819 Expanding NIP to cover children up to 12 years of age portrays KCDC's plan to increase vaccination rates in the pediatric populations.
The VE in all patients was 36.4% (95% CI, 13.9 to 53.1), and the VE for previously healthy children was 47.8% (95% CI, 25.9 to 63.3) and -1.8% (95% CI, −101.6 to 48.6) in patients with known underlying diseases. The VE in the previously healthy group was consistent with the National VE data of general pediatric population; the adjusted VE 48.5% (95% CI, −141.5% to 89.0%).20 The VE in the NIP group was statistically significant, with a value of 35.6% (95% CI, 10.5 to 53.7). However, in the non-NIP group, it was not statistically significant, with a value of 37.4% (95% CI, −49.7 to 73.8).
In our study, the VE was estimated using a test-negative study design. Patients were tested for influenza antigens; those confirmed with influenza infection were categorized as cases and those with negative results as controls.921 The VE was calculated using a regression model with the OR for vaccination in cases versus controls. The VE was then adjusted for age group and underlying medical conditions. The adjusted VE for the NIP group was 35.6%, and in previously healthy children was 47.8%. The VE adjusted for older age or patients with underlying disease was not statically significant. In the same season, adjusted VE for the age group 6 months to 8 years was 48% (37 to 58) and the age group 9 to 17 years was 7% (−20 to 28) from the U.S. Flu VE Network (23 November 2018 through 3 May 2019).22 This was lower than the reported VE of 61% (44 to 73) for the age group 6 months to 17 years from an interim report (November 23, 2018 to February 2, 2019).5 There was limited data on the VE for the pediatric population in Europe. By the report of the European Centre for Disease Prevention and Control, the proportion of influenza A was 95% in the early 2018–2019 season (October 2018 to January 2019), and the VE for influenza A was reported to be 67% (80 to 94) in the age group 2 to 17 years in a primary care setting in UK.6
The distribution of influenza A and B viruses can vary depending on the season and the region. Fig. 2 shows the number of antigen-positive results among the tested patients during the study period. The graph was similar to the national surveillance data from KCDC, which although had an early peak for influenza A followed by that for influenza B.23 This is quite different from the results in the United States, Japan, and Australia, which all had only a single peak of mixed influenza A and B infections during the same season (Fig. 3).1424 The influenza A virus predominated in the United States, accounting for 95%–96% of influenza-positive samples, and A (H1N1) was 57%.24 In Korea, the virus distribution differed with 41.9% of A (H1N1), 20.9% of A (H3N2), 36.8% of B (Victoria), and 0.4% of B (Yamagata).25
In 2018–2019 season, most A (H1N1) strain was well inhibited by the seasonal vaccine, while the genotype 3C.3a of A (H3N2) consists of about 30% strains could not be matched with vaccine strain.24 In Korea, influenza A (H1N1) strain matched 100% with the vaccine strain, while the influenza A (H3N2) matched only 72.2%. Influenza B (Victoria) which was the predominant strain in Korea, matched 32.6% with the vaccine strain.25 Because of the strain mismatch for influenza A/H3N2 and Influenza B/Victoria in the vaccine, the VEs were different. It also depended on the dominant influenza strain of a particular country.2425
In this study, 7.7% of patients with HO disease and 21.2% with other underlying disease were included. Positive antigen rates were 22.0% in previously healthy patients, 8.3% in patients with HO disease, and 18.0% in those with other underlying diseases. There was no difference in vaccination rates, at 77.3%, 78.9%, and 74.3% in previously healthy, HO disease, and other underlying disease groups, respectively. In a previous study, HO patients were expected to show lower VE and higher infection rates than immunocompetent individuals.2627 However, we observed lower antigen-positive rates in patients with HO disease, which could have resulted due to several factors. With the test-negative study design, patients with fever of other origins might have been included in the analysis resulting in lower infection rate than previous studies. In addition, higher awareness of personal hygiene and social distancing might have had a protective effect from influenza infection in both vaccinated and unvaccinated patients. Further studies with expanded cohorts are needed.
This study has a few limitations due to its retrospective nature. The study population was selected according to the availability of antigen test results, rather than any predefined indications. Hence, data for patients with underlying disease who have a higher risk of fevers of other origins (e.g. neutropenic that of fever in cancer patients) might be skewed. In addition, vaccination history, including the date and type, was lacking as it was based on the parents' reports rather than a medical vaccination record. A diligently recorded vaccination report should allow accurate estimation of the VE of patients at the pediatric ED. Further, we consider the ED population to provide a reliable and varied sample of patients, as they include those with a range of medical conditions exhibiting different severities of disease. Considering the global differences in the VE, we acknowledged the importance of gathering the national data for the annual VE in the Korean populations.
In conclusion, we report moderate effectiveness of influenza vaccination in previously healthy children from 6 months to 12 years of age for the 2018–2019 season.
 XML Download