

 PDF
PDF Citation
 Print
Print


INTRODUCTION
Recent clinical studies have shown a dramatic reduction of heart failure (HF) hospitalization and cardiovascular death in patients with type 2 diabetes treated by sodium/glucose co-transporter 2 (SGLT2) inhibitors.1)2)3) These results led clinical investigators to test whether such effects were consistent in non-diabetic patients with HF.4)5) Shortly after the publication of the EMPA-REG (Empagliflozin Cardiovascular Outcome Event Trial in Type 2 Diabetes Mellitus Patients) trial, mechanisms behind the beneficial effect of the drug was mainly explained as a secondary effect of natriuresis and glucosuria,6) because SGLT2 is known to be present mainly in the kidney, not in a human heart.7) In the kidney, SGLT2 was observed in the proximal tubule, where approximately 90% of the glucose is reabsorbed from the urine; the other 10% is through the sodium/glucose cotransporter 1 (SGLT1) located in the distal part of the proximal tubule. SGLT2 inhibitors (SGLT2i) monotherapy is associated with approximately 50 g/day of glucose loss, which corresponds to 200 kcal/day.8) Indeed, the administration of SGLT2i added to the standard glucose-lowering therapy (metformin, insulin, and sulfonylureas) modestly reduced (~0.4%) glycated hemoglobin plasma levels and was associated with small decreases in body weight, plasma insulin, and blood pressure.2)9) However, such minor changes may not be enough to mediate such a large improvement of clinical outcomes. Thus, direct actions of SGLT2i on cardiomyocytes (CMCs), vascular cells and cardiac fibroblasts have been investigated. Changes in ionic homeostasis or mitochondrial function in myocyte, increasing AMPK activity, improvement of cell viability under high glucose condition or vasodilation in vascular cells, and SGLT-independent mechanisms are suggested.10) We suspect that such data may only be explained if SGLT2 is present in the heart. Herein, we sought to investigate 1) in vivo expression of SGLT2 in a non-diabetic myocardial infarction (MI) mouse model and 2) the metabolic effect of SGLT2i on the myocardium using 1H nuclear magnetic resonance (NMR) imaging.
METHODS
Experimental protocol
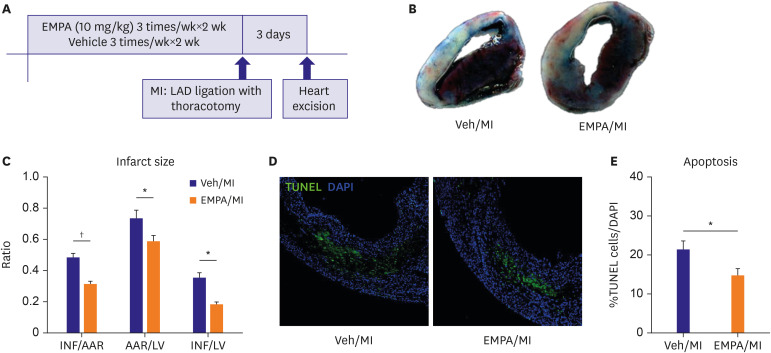
For the SGLT2i treatment group (EMPA group), non-diabetic wild type male mice were administered by oral gavage of SGLT2i, EMPA 10 mg/kg solved in distilled water 1 cc, 3 times/week for 2 weeks. An equal amount of distilled water was administered in the vehicle group. MI model was made by ligation of the left anterior descending (LAD) artery after left-sided thoracotomy. Three days after ligation, the mice's hearts were excised after injection of Evans blue. The same procedure was done for the vehicle group. Harvested heart except left ventricular (LV) apex was embedded in paraffin. And LV apex was immediately snap-frozen in liquid nitrogen and stored at −80°C until NMR analysis (Figure 1A). All animal studies were in accordance with the Guide for the Care and Use of Laboratory Animals published by the National Institutes of Health (Publication No. 85-23, revised 1996).
Figure 1
Pre-treatment of SGLT2i/EMPA reduced infarct size and apoptotic cells in non-diabetic MI model. (A) Experiment protocol. (B, C) Day 3 hearts were stained with 2,3,5-triphenyltetrazolium chloride for measurement of INF. Representative images and quantitative analysis of infarct size. (D, E) Apoptosis was evaluated by TUNEL staining (green) and DAPI staining (blue) with day 3 hearts. Representative images including infarct and infarct border zone and quantitative analysis of apoptotic cells (Scale bars: 50 μm).
AAR = area at risk; DAPI = 4′,6-diamidino-2-phenylindole; EMPA = empagliflozin; INF = infarct area; LAD = left anterior descending; LV = left ventricular; MI = myocardial infarction; TUNEL = terminal deoxynucleotidyl transferase-mediated dUTP nick endlabeling; Veh = vehicle.
*p<0.05, †p<0.001 between the 2 groups connected by line.
Mouse model of myocardial infarction
C57/BL6 wild type mice (male, 6–8 weeks old, 22–25 g) were purchased from Orient Co. Ltd. (Seongnam, Korea). Animal treatment and maintenance were performed in accordance with the Principles of Laboratory Animal Care, and animal experiments were performed using protocols approved by the Pusan National University Institutional Animal Use and Care Committee. Model Mice were anesthetized with an intraperitoneal injection of 400 mg/kg 2,2,2-tribromoethanol (Avertin; Sigma-Aldrich Corp., St. Louis, MO, USA). Through left-sided thoracotomy, the heart was exposed and LAD was ligated using 7-0 poly-propylene sutures and a dissecting microscope (n=7 for vehicle group, n=5 for EMPA pretreated group). For the sham operation, the ligature was placed in an identical location but not tied tightly (n=3). The chest wall was closed after draining out all bloody fluid.
Histological and immunofluorescence assessments
For the preparation of paraffin-embedded sections, 0.15 mL of 0.1 M cadmium chloride was injected through the catheter to arrest the heart in diastole via abdominal aorta. The thorax was opened and perfused through the right carotid artery with phosphate-buffered saline containing 4% paraformaldehyde. The whole heart was excised, embedded in paraffin and cut into sections. Hearts were harvested at 0, 6, 24, 72 hours, and 28 days after MI injury. Heart tissue sections were stained with anti-cardiac troponin T (ab8295, ABCAM) antibody, SGLT2 (ab37296, ABCAM) antibody, and 4′,6-diamidino-2-phenylindole (DAPI). Positively stained cells were assessed in four sections, five HPFs per section. Fluorescence signals were detected using a confocal laser-scanning microscope (FV 1000, Olympus Center Valley, PA, USA) and analyzed using the FV10-ASW software (Olympus). Densitometric analysis of immunofluorescence (IF) was performed with ImageJ Software (NIH Image, imagej.nih.gov).
Apoptosis measurement
Apoptosis was evaluated in terminal deoxynucleotidyl transferase-mediated dUTP nick endlabeling (TUNEL) (ApoAlert™ DNA Fragmentation Assay Kit, 630108, Clontech) stained sections of heart tissue, followed by staining with DAPI. The apoptotic cells were quantified as the percentage of TUNEL-positive nuclei among total nuclei in high-power fields (HPFs). Positively stained cells were assessed in four sections, five HPFs per section.
Quantitation of infarct area
Three days after ligation, 300 μL of 2% Evans blue (Sigma-Aldrich Corp.) was injected into the mouse vein to demarcate the area at risk (AAR), and the mouse heart was excised after five minutes. To ensure uniform thickness and position of the tissue sections, hearts were placed in a mouse coronal heart matrix (Zivic Instruments, Pittsburgh, PA, USA) and cut into 2 mm-cross sections using a razor blade, and the same part of each section was compared. The sections were stained for 10 minutes at 37°C in wells containing 2% triphenyltetrazolium chloride (TTC) solution and scanned for digitization. AAR or infarct area (INF) was quantified via computerized planimetry (ImageJ: NIH Image, imagej.nih.gov) and presented as a percentage of the entire LV or AAR.
Western-blot analysis
MI induced heart tissues (24 and 72 hours after MI) were homogenized using Bead Ruptor 12 Homogenizer (OMNI Inc., Kennesaw, GA, USA). The heart tissue homogenates were resuspended in a lysis buffer (50 mM Tris-HCl pH 7.5, 150 mM NaCl, 1% Triton X-100, 1% sodium deoxycholate, 0.1% sodium dodecyl sulphate, 2 mM ethylenediaminetetraacetic acid) containing protease inhibitor cocktail (ThermoScientific, #1862209) and phosphatase inhibitor cocktail (GenDEPOT, P3200-001). Equal amounts of protein were separated via 8–10% sodium dodecyl sulphate-polyacrylamide gel electrophoresis and then transferred to polyvinylidene fluoride membranes. The membranes were blocked with 5% non-fat milk or 5% bovine serum albumin at room temperature. Primary antibodies used in this study were as follows: anti-SGLT1 antibody (Abcam, ab14686), anti-SGLT2 (Abcam, ab37296), anti-Hypoxia-inducible Factor-1α (HIF-1α) (SantaCruz, sc-10790), anti-transforming growth factor-β1 (TGF-β1) (Abcam, ab92486), anti-phospho-Smad2 (p-SMAD) (Cell Signaling, #3104), anti-Smad2 (Cell Signaling, #3103), anti-phospho-Smad2/3 (Cell Signaling, #8828), anti-Smad2/3 (Cell Signaling, #8685), and anti-glyceraldehyde 3-phosphate dehydrogenase (GAPDH) (Cell Signaling, #2118S). As a secondary antibody, anti-mouse immunoglobulin G (IgG) horseradish peroxidase (HRP) (TransGen Biotech, HS201-01) or anti-rabbit IgG HRP (TransGen Biotech, HS101-01) was used. Immunoreactive proteins were visualized using the enhanced chemiluminescence detection system (Amersham, GE Healthcare, Chicago, IL, USA).
Metabolite analysis with high-resolution magic angle spinning 1H nuclear magnetic resonance (HR-MAS NMR) spectroscopy
The heart sample (72 hours after MI) was weighted 20 mg and transferred to a 4-mm HR-MAS 1H NMR sample tube (Agilent Technologies, Santa Clara, CA, USA). 25 µL of D2O containing 2 mM 3-(trimethylsilyl) propionic-2,2,3,3-d4 acid sodium salt (TSP-d4) was added to the tube. Samples were measured using HR-MAS NMR spectroscopy. All the NMR spectra were acquired at a 600.167 MHz Agilent spectrometer equipped with a 4-mm gHX NanoProbe (Agilent Technologies). CPMG (Carr-Purcell-Meiboom-Gill) pulse sequence was used because of the suppression of water and high molecular mass compounds. The acquisition time was 3.0 seconds, relaxation delay was 1 second and 128 transients were collected. The total acquisition time for each sample was 13 minutes. All spectra were processed and quantitatively analyzed using Chenomx NMR Suite 7.1 professional with the Chenomx 600 MHz library database (Chenomx Inc., Edmonton, Canada).
Statistical analysis
Results of multiple observations are presented as mean±standard error of the mean. Data were analyzed using the Student's t-test to compare between two groups. For analysis of multivariate data, group differences were assessed using one-way or two-way analysis of variance, followed by Scheffe's post hoc test. Additional experimental methods are included in the supporting information. Quantified metabolites were univariate statistical analysis, multivariate statistical analysis, and Biomarker analysis were conducted using MetaboAnalyst (https://www.metaboanalyst.ca). Data were normalized by a pooled sample from the group and data scaling was conducted with Pareto-scaling.
RESULTS
Pre-treatment of SGLT2i (EMPA) reduced infarct size and apoptotic cells in non-diabetic myocardial Infarction model
Day 3 hearts were stained with 2,3,5-triphenyltetrazolium chloride for measurement of INF. Apoptosis was evaluated by TUNEL and DAPI staining with day 3 hearts. The INF/AAR of Veh /MI and the EMPA/MI groups were 48.4±7.0% vs 31.3±4.8%, respectively. INF/AAR, AAR/LV and INF/LV were significantly decreased (p<0.001, p=0.036, p=0.002 respectively) in EMPA group (Figure 1B and C). TUNEL assay with day 3 hearts showed reduced apoptotic CMCs in EMPA pre-treated mice (%TUENL/DAPI, 21±2% vs 15±2%, p=0.037) (Figure 1D and E). These data show that improved cell survival in the EMPA pre-treatment group after MI.
EMPA pre-treatment alleviated expression of SGLT2 on infarct zone on day 3 heart
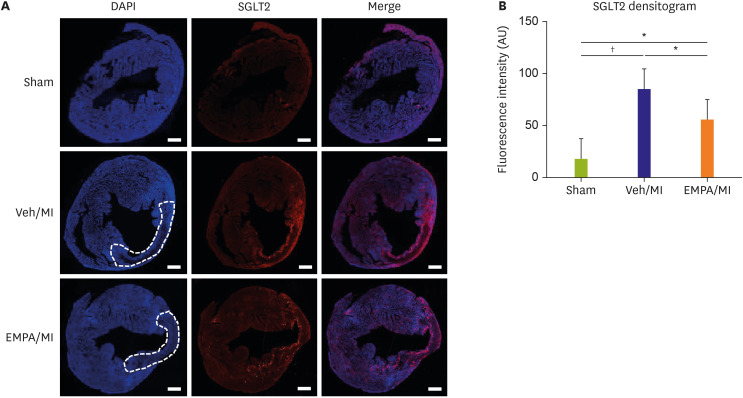
Confocal microscopy of day 3 showed SGLT2 staining on the ischemic area (thinned myocardium, dotted line in Figure 2A), regardless of EMPA pretreatment. There was a meaningful increase in fluorescence intensity of SGLT2 in the densitogram between sham and vehicle group, sham and EMPA group. Interestingly, EMPA group showed significantly decreased intensity compared with the vehicle group (p=0.034), suggesting that EMPA pretreatment alleviated expression of SGLT2 on infarct zone (Figure 2B).
Figure 2
Expression of SGLT2 on mouse heart in infarcted area. (A) Representative images of immunofluorescence stain of SGLT2 on mouse heart 72 hours after MI. The infarcted zones are demarcated with dotted line. SGLT2 stained prominently on infarcted area regardless of EMPA treatment. (B) Quantitative analysis of SGLT2 fluorescence densitogram. Both vehicle and EMPA group showed significant increase in SGLT2 intensity. However, no difference between vehicle and EMPA group was noted (Scale bars: 500 μm).
DAPI = 4′,6-diamidino-2-phenylindole; EMPA = empagliflozin; MI = myocardial infarction; SGLT2 = sodium/glucose cotransporter 2; Veh = vehicle.
*p<0.05, †p<0.001 between the 2 groups connected by line.
Transient expression of SGLT2 on ischemic mouse heart and suppressed SGLT2 expression on the infarcted heart in EMPA treated group
Previous results strongly suggested that SGLT2 could be transiently upregulated in the ischemic area of mice hearts. We then investigated a sequential experiment to check the time point that SGLT2 appears on the infarcted heart. Pre-treatment procedures with EMPA was the same as the experimental protocol described above. However, the harvesting of mice hearts took in different time points: 0 hour, 6 hours, 24 hours, 72 hours, and 28 days after MI surgery. Interestingly, we could find the SGLT2 expression in the 24 hours sample of the vehicle group, not in the EMPA group (p=0.011, Figure 3A, 1 Day, and Figure 3B). The fluorescence intensity of SGLT2 expression increased until 72 hr and disappeared on day 28 (Figure 3A and B). There was no significant difference in fluorescence intensity at 6 hr and 28 day between the 2 groups (p=0.071 and p=0.355 respectively). Not only the IF stain but also the western blot results showed the existence of SGLT2 on ischemic mice hearts at 72 hr. (Figure 4A, B, and C) SGLT1 showed no significant difference between all three groups. SGLT2 was elevated in the vehicle group compared with sham group (p=0.001). However, when pretreated with EMPA, SGLT2 protein level significantly decreased (p=0.037) under ischemic condition, although the level was still higher than the sham group (p=0.048). Collectively, these findings suggest that myocardial ischemia itself may upregulate SGLT2 expression, and EMPA could attenuate the SGLT2 upregulation. In several previous studies, HIF-1α, TGF-β1, p-SMAD were suggested as regulators of SGLT2.11)12)13) We did additional western blot analyses to confirm the regulation pathway of SGLT2 (Figure 4C). The EMPA pre-treated group showed reduced HIF-1α and TGF-β1 expression especially at 72 hr after MI. p-SMAD 3 also showed decreasing trends in the expression of SGLT2 in EMPA group, although the total amount of expression was higher at 24 hr.
Figure 3
Transient expression of SGLT2 on ischemic mouse heart and suppressed SGLT2 expression on infarcted heart in EMPA treated group. (A) Representative images of time sequence after myocardial infarction. DAPI stains in blue, troponin T stains in green, SGLT2 stains in red. At 6 hours after MI, both group showed no SGLT2 stain. On day 1, in vehicle group, SGLT2 stain in infarcted area was noted, but not in EMPA group. On day 3, both group showed SGLT2 stain mainly on endo- and epicardial area of infarct zone. On day 28, both group showed little SGLT2 stain in infarct zone. (B) SGLT2 densitogram during time sequence showing inter-group difference of fluorescence intensity. EMPA group showing slower rate of increase of SGLT2 intensity and lower peak value than vehicle group (Scale bars: 50 μm).
DAPI = 4′,6-diamidino-2-phenylindole; EMPA = empagliflozin; MI = myocardial infarction; SGLT2 = sodium/glucose cotransporter 2; Veh = vehicle.
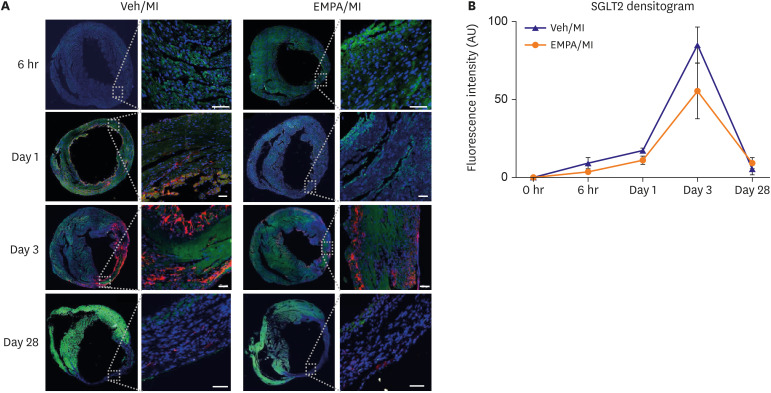
Figure 4
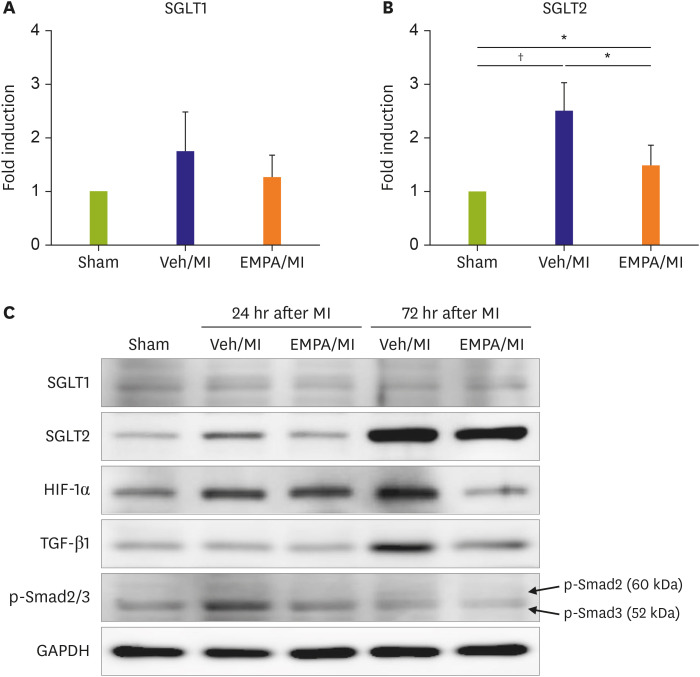
Post-MI 24 and 72 hours western blot showing the existence of SGLT2 on ischemic mice hearts and the effects of EMPA pre-treatment. Fold induction of SGLT1 (A) and SGLT2 (B) of each group from western blot analysis. SGLT1 showed no significant difference between all three groups. However SGLT2 was significantly elevated in the vehicle group compared with sham group (p=0.001). However when EMPA was pre-treated, SGLT2 protein level significantly decreased (p=0.037) in the ischemia condition, although the level is still higher than the sham group (p=0.048). (C) Additional western blot analysis of HIF-1α, TGF-β1 and phosphorylated SMAD2/3 at 24 hours and 72 hours after MI are also shown. The samples from different time sequence loaded in the same gel.
EMPA = empagliflozin; GAPDH = glyceraldehyde 3-phosphate dehydrogenase; HIF-1α = Hypoxia-inducible Factor-1α; MI = myocardial infarction; p-SMAD = phosphorylated SMAD; SGLT1 = sodium/glucose cotransporter 1; SGLT2 = sodium/glucose cotransporter 2; TGF-β1 = transforming growth factor-β1; Veh = vehicle.
*p<0.05, †p<0.01 between the 2 groups connected by line.
Post myocardial infarction metabolite analysis with 1H NMR
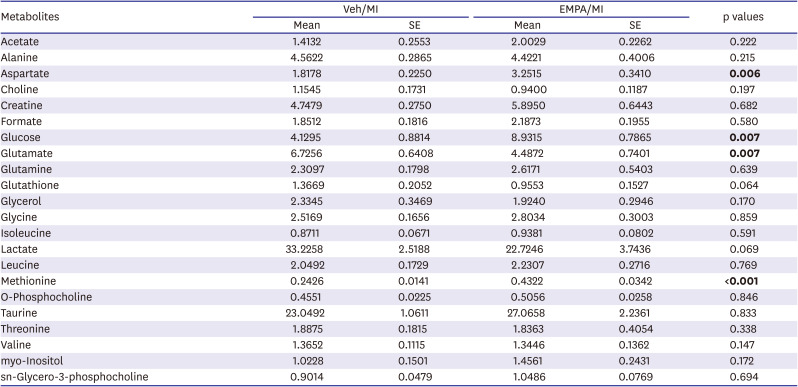
In the univariate analysis, among the marker metabolite examined for comparison of two groups, aspartate, glucose, and methionine were significantly higher in relative concentration in EMPA group. The relative concentration of glutamate was significantly lower in EMPA group (Figure 5A and Table 1). Principal components analysis (PCA) was used to determine the ability to differentiate metabolic profiles between EMPA and vehicle groups. PCA score plot showed clear differences in the ischemic heart tissue metabolome between groups, with the data points clustered into 2 distinct groups (Figure 5B), neatly separating the vehicle and EMPA samples. Variable importance in projection (VIP) scores were calculated from partial least-squares discriminant analysis (PLS-DA). The VIP score plot showed that glucose, glutamate, methionine, aspartate, lactate, and glutathione contributed to the clustering of two groups with VIP score >1.0 (Figure 5C). A recent study suggested that ketone bioavailability and cardiac ketone utilization are increased by EMPA,14) so we also checked the ketone bodies with 1H NMR, but they were not detected.
Figure 5
Metabolite analysis with 1H NMR. (A) The result of metabolite analysis by 1H NMR. (B) PCA score plot well differentiating metabolic profiles between EMPA and vehicle groups. Green for EMPA group and red for Vehicle group. (C) VIP score analysis.
EMPA = empagliflozin; MI = myocardial infarction; NMR = nuclear magnetic resonance; PCA = principal components analysis; Veh = vehicle; VIP = variable importance in projection.
*p<0.05.
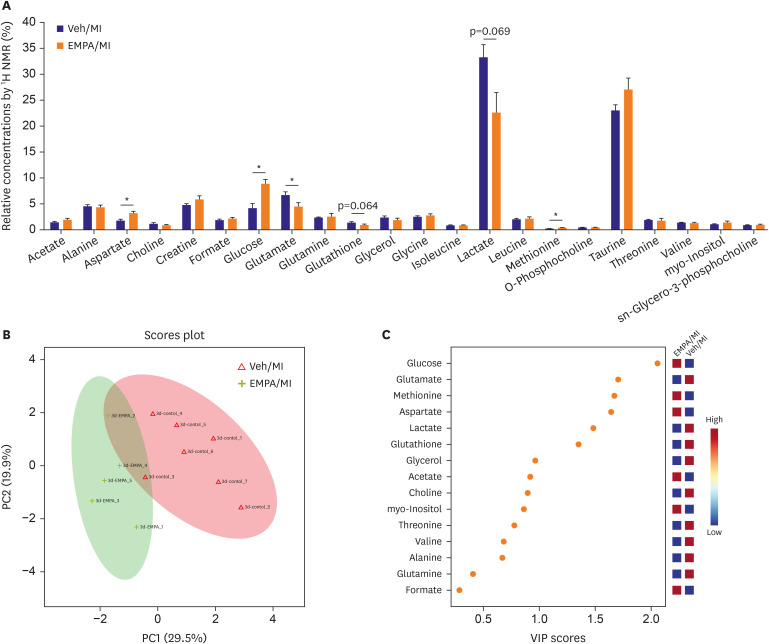
Table 1
The relative concentrations of marker metabolites acquired by high-resolution magic angle spinning 1H nuclear magnetic resonance spectroscopy
DISCUSSION
Our findings, summarized as follows, provides new insight on the direct action of SGLT2i on MI. 1) EMPA pretreatment reduces infarct size and apoptosis in in vivo mouse MI model. 2) SGLT2 expresses on heart localized in the ischemic area about 24 hours after MI. EMPA pretreatment delays and attenuates the expression of SGLT2. However, on day 28, both groups showed no SGLT2 in the heart tissue. This is a novel finding as far as knowledge. 3) With 1H NMR analysis, EMPA pretreatment was associated with less glucose consumption and lactate production compared with the vehicle group. However, more consumption of glutamate was noted, suggesting metabolic substrate shifting.
Through this discussion, the term ‘heart tissue’ may refer to not only cardiomyocytes (CMCs) but rather a broader spectrum of cells, encompassing vascular structures, interstitium, and circulatory inflammatory cells.
Although previous data showed that SGLT2 was not detected in CMSs,7)15)16)17) we hypothesized that SGLT2 may be present in the heart for several reasons. First, SGLT levels can vary under different circumstances. For example, SGLT1 levels are known to increase with specific insults, such as high glucose, ischemia, or hypertrophy.18)19)20)21)22)23) Secondly, the SGLT2 level may vary over time after MI. Previous studies demonstrating the absence of SGLT2 in the heart utilized a Langendorff ex vivo MI model or studied human hearts with ischemic cardiomyopathy.19)23) Ex vivo experiments using Langendorff hearts have a short time window for experiments, which may not be sufficient for up- or down-regulation of proteins. Hearts with ischemic cardiomyopathy investigated in other studies may also represent a chronically insulted heart, which may correspond to our experiment that examined the SGLT2 on day 28. Our study results were consistent with our initial assumptions. SGLT2 expression on heart was gradually increased with time course after MI and nearly disappeared in the chronic state. Also, SGLT2 expression was localized in the ischemic area, and EMPA pretreatment delayed and attenuated the expression of SGLT2. These are novel findings and may potentially suggest the disease or remodeling-modifying effect of SGLT2 inhibitors in MI heart.
We also investigated the regulation of SGLT2, to confirm the suppression of SGLT2 in the EMPA pretreated group (Figure 4C or E). Several regulators of SGLT2 have been demonstrated to be affected by SGLT2i. Panchapakesan and colleagues reported regulation of SGLT2 by TGF-β1 via p-SMAD3 in human proximal renal tubular epithelial cells.13) In the hypoxic conditions, HIF-1α was also reported as a regulator of SGLT2, although there are conflicting results whether HIF-1α upregulates.11) or downregulates SGLT2.12) We subsequently performed a western blot analysis on such proteins (Figure 4C). The expression of HIF-1α, TGF-β1, and p-SMAD3 were elevated after MI, and decreased after EMPA treatment consistent with changes of the SGLT2 protein level. These results suggest that EMPA affect the expression level of SGLT2 through modulating the aforementioned regulators. The exact mechanism and which cells (CMC, endothelial cell, circulatory inflammatory cells, etc.) are involved in the process is yet to be understood.
The blocking of glucose uptake into the cells is the fundamental function of SGLT2i, EMPA. Under conditions of mild, persistent hyperketonemia, such as those that prevail during treatment with SGLT2i, the heart tissue utilizes energy sources other than glucose. This phenomenon was called as the “thrifty substrate hypothesis” by other investigators.24) We could also find the possibility of changes of metabolites after EMPA treatment. As demonstrated in Figure 5A and Table 1, there are some differences in metabolites in heart tissue between the two groups. In the EMPA pretreated group, in particular, the concentration of glucose was higher while glutamate was lower. This might suggest a change in metabolism of the ischemic heart tissue after EMPA treatment; less glucose consumption and more glutamate usage as metabolites. Collectively, in the EMPA pretreated group, metabolic substrates could ‘shift’ from glucose and glycolysis to substrates that do not produce acidic byproducts and require less oxygen, especially in severe myocardial ischemia, in order to maximize cell survival. The human heart derives 95% of its energy from mitochondrial oxidative phosphorylation, which under normal conditions is fueled by fatty acids (up to 70%), glucose (up to 30%), lactate, and, to a lesser degree, ketones and amino acids.25) In total ischemia as the current ischemic ligation model (complete global cessation of LAD flow and absence of oxygen), the fatty acids cannot be broken down into acetyl-CoA.26) Glucose and glycolysis become the primary means of producing adenosine triphosphate, but this yields far less energy per molecule and produces two protons per molecule for every glucose consumed.25) This energy deficit and acidification inhibit glycolysis, leading to anaerobic heart conditions, and switching to non-glycolytic fuels, such as amino acids.27) Especially glutamate and glutamine are notable due to their rapid conversion to α-ketoglutarate, which not only maintains the levels of Krebs cycle intermediates but also provides cellular energy through substrate-level phosphorylation during the conversion to succinate. This is an oxygen-free metabolic conversion, with no acidic or reactive by-products.28) In our study, clear differences in certain metabolites between groups on day 3 post-MI are interesting findings. In NMR analysis, the vehicle group showed a significantly lower concentration of glucose, which implicates more consumption. Moreover, a significant decrease of glutamate and numerical decrease of lactate (p=0.069) in EMPA group were noted, suggesting that more utilization of glutamate as a metabolic substrate (Table 1) after EMPA pretreatment.
This study has several limitations. We did not identify the specific cells which express SGLT2. Consider the transient nature or SGLT2 expression, it could be inflammatory cells including fibroblasts, or endothelial cells, not CMCs themselves. Further studies are required to investigate whether the native heart cells or the recruited inflammatory immune cells express SGLT2. Additionally, our results clearly showed that the expression of SGLT2 was strongest at 3 days after MI, although when SGLT2 levels peak is unclear because we were not able to check time points between day 3 and day 28. Lastly, we were not able to quantify ketone bodies in samples, which may be accounted for by low sensitivity or NMR spectroscopy.
In conclusion, our study result suggests that SGLT2 is transiently express in the mice heart by some noxious stimulants such as ischemia, similar to SGLT1 upregulated in specific circumstances. These changes could let the SGLT2 inhibitors have a direct effect on metabolism, and finally attenuate the infarction size in the non-diabetic mice heart. Our study, therefore, provides new insights into the potential ‘direct’ cardiovascular benefits of SGLT2i in nondiabetic ischemic heart patients, although specific cell types expressing SGLT2 is not known. Further studies to investigate the exact mechanism and cell types express SGLT2 in the post-MI heart is warranted.
 XML Download