

 PDF
PDF Citation
 Print
Print


INTRODUCTION
Malignant gliomas (MG) are the most common primary intracranial malignant tumor and are associated with severe mortality and morbidity rates. The incidence of glioma in the United States was estimated at approximately 6 per 100,000 with a 5-year survival rate of 27%.1 Although treatment options have improved with a better understanding of the molecular biology of these tumors, MG remains incurable with largely unknown etiology.2
The overall incidence of tumors of the brain has increased over the last 30 years but has recently begun a gradual decline. Despite this statistic, the incidence of MG continues to increase.3 Population-based data on the diagnosis of primary brain and other central nervous system (CNS) tumors are maintained by the National Cancer Data System in the United States. These data revealed that the frequency of gliomas is highest in Caucasian Americans, with lower rates in African Americans; the lowest frequency was reported in Asians or Pacific Islanders. Furthermore, men were more frequently diagnosed than women, and elderly individuals were more likely to be diagnosed than younger adults.4
Epidemiological studies on the characteristics of MG in Asia are limited, especially in South Korea. Therefore, we conducted an epidemiological analysis using a nationwide population-based insurance database. In this study, we investigated the incidence, prevalence, and survival of MG based on population-based Korean National Health Insurance Database (NHID) data.
METHODS
Data source and study population
This study used data from the NHID provided for research by the National Health Insurance Service (NHIS), which is a single central government-led insurance system that includes almost the entire Korean population. The NHID data have information on social demographics of the insured, income-based insurance contributions, clinical diagnosis, medical treatment records including medications and surgical procedures, health care conditions, and rates of cancer diagnosis and rare incurable diseases. All medical institutions in South Korea operate under a mandatory government contract system. All prescription, ordering, and diagnostic codes are collected in the NHID. Use of such data is expected to derive more accurate epidemiological results of the entire population of about 50 million in South Korea. This study included NHID data from January 1, 2007 to December 31, 2017.
Definition of MG
The National Statistical Office has released the Korea Classification of Disease (KCD) based on the International Classification of Disease (ICD) in an attempt to analyze, interpret, and organize systemic records of diseases and causes of death. During our research period, malignant neoplasms of the brain were classified as C71 code in KCD 5–7 according to ICD-10. The C71 code covers all MGs including diffuse astrocytoma, anaplastic astrocytoma, ependymoma, anaplastic ependymoma, oligodendroglioma, anaplastic oligodendroglioma, and glioblastoma multiforme. Since all patients with a C71 code in Korea received additional cost reduction service for rare and incurable diseases from the NHIS under the Benefit Extension Policy (BEP), we defined MG as a C71 code with registered in BEP to increase the accuracy of the study. The patients under BEP were identified using V193 code.
To further verify the accuracy of our method to define MG, we retrospectively reviewed the electronic medical records at Seoul St. Mary's Hospital, a tertiary referral hospital in Korea. After recruiting patients who visited this hospital between 2014 and 2018, we analyzed individual medical records for those who fit our definition of MG. We found 220 patients who were radiologically or pathologically confirmed to have MG (Supplementary Table 1).
Incidence, prevalence, and characteristics of patients with MG
From January 1, 2007 to December 31, 2017, newly registered patients with MG in the standard Korean population were identified using NHID. Incidence cases were defined as newly diagnosed patients who fit our definition of MG. Prevalence cases were defined as any patient who visited the study hospital for MG at least once in the noted year.
We analyzed the relationships between MG and socioeconomic status (SES), incidence, and treatment rate. Since higher insurance contribution is expected to correspond to higher socioeconomic level, ‘income’ was classified based on insurance contribution level. According to the insurance payment status, the first quartile represented ‘low income,’ the fourth quartile represented ‘high income,’ and the remaining two were considered ‘middle income.’ ‘Region’ was categorized by ‘Metropolitan’ where administrative districts are into ‘gu,’ ‘City’ which is the administrative division of ‘dong’ and ‘Rural’ which is the administrative division of ‘eup’ or ‘myeon.’
In addition, we analyzed the percentage of patients who had used temozolomide (TMZ) and the number of patients who underwent surgery. Use of TMZ and/or undergoing an operation were counted at the time of the event during the follow-up period. Operations were identified by insurance payment code S4634–4637 (craniotomy for excision of brain tumor) and/or S4756 (CNS stereotactic operation) and appropriate subcodes.
Statistical analyses
Data are shown as mean ± standard deviations for continuous variables and as proportions for categorical variables. Differences between continuous variables were compared using one-way analysis of variance test, and differences between categorical variables were compared using the χ2 test. The incidence rates of MG were analyzed and described as number of events per 100,000 person-years. The cumulative incidences rates of MG were compared between groups using the Kaplan-Meier method and the log-rank test. Cox proportional hazards models were used to analyze the adjusted risk of MG based on age, sex, region, and income status; the results are expressed as hazard ratio (HR) with 95% confidence interval (CI). A P-value less than 0.05 was considered statistically significant. SAS version 9.4 (SAS Institute, Cary, NC, USA) and R version 3.2.3 (The R Foundation for Statistical Computing, Vienna, Austria) were used for statistical analysis.
RESULTS
Characteristics of newly reported patients with MG in Korea
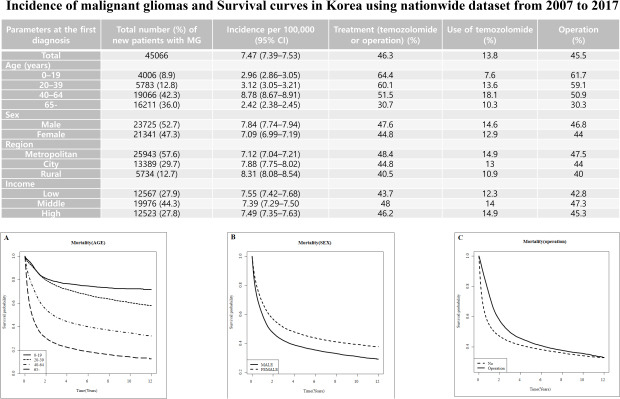
The total number of newly reported patients with MG was 45,066 over 11 years, with an age-adjusted incidence of 7.47 per 100,000 people. At the time of diagnosis, the mean age was approximately 54 years. The male to female ratio was 1.11. The proportion of patients diagnosed with MG at the age of 40–64 years was 42.3%, and 36.0% of patients were diagnosed at older than 64 years. The proportions of patients diagnosed with MG in metropolitan, city, and rural regions were 57.6%, 29.7%, and 12.7%, respectively. The proportion of patients with middle income (44.3%) was higher than those with low (27.9%) or high income (27.8%). Among the total patient cohort, 45.5% underwent surgery for tumor removal and/or biopsy, 13.8% received chemotherapy using TMZ, and 46.3% received surgery and/or TMZ chemotherapy. Among older patients, proportion who underwent surgery and/or TMZ chemotherapy decreased. The proportion of patients who received surgery and/or TMZ chemotherapy was higher in the metropolitan regions. Patients who had middle and high income levels showed a stronger tendency to undergo surgery and/or chemotherapy for MG compared with low-income patients. There was little difference in this proportion according to sex (Table 1).
Table 1
Characteristics and incidence rate of newly reported patients with MG (2007–2017)
The annual incidence and prevalence rates according to age, sex, region, and economic status are summarized in Supplementary Table 2.
Mortality and survival probability
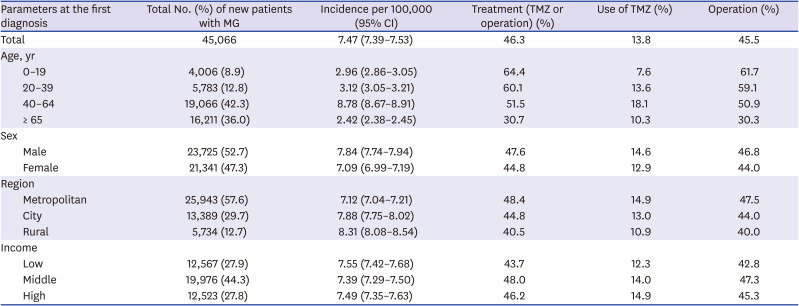
Among the 45,066 patients with MG, 25,294 died between 2007 and 2017. The duration was 1,334,432.5 person-years, and the mortality rate was 188.15 per 1,000 people. The mortality was higher in elderly patients. Compared with sex-adjusted 20–39 years, age younger than 19 had a HR of 0.72 (95% CI, 0.72–0.78; P < 0.001), age 40–64 years had HR of 2.38 (95% CI, 2.26–2.50; P < 0.001), and age over 65 years had HR of 4.85 (95% CI, 4.62–5.10; P < 0.001). The mortality rate of female patients was approximately 70% lower than that of male patients (95% CI, 0.67–0.71; P < 0.001). The mortality rate was slightly higher for patients with low income (HR, 1.08; 95% CI, 1.05–1.12; P < 0.001) and slightly lower for patients with high income (HR, 0.91; 95% CI, 0.88–0.93; P < 0.001). No statistical significance was shown when the relationship with mortality was analyzed by region (Table 2).
Table 2
Incidence rates and risk of MGs according to age, sex, region, and income status (2007–2017)
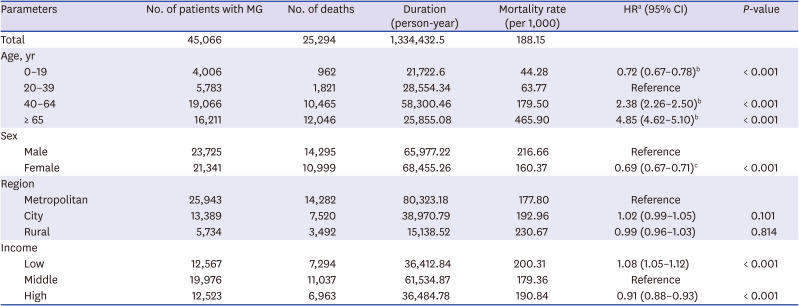
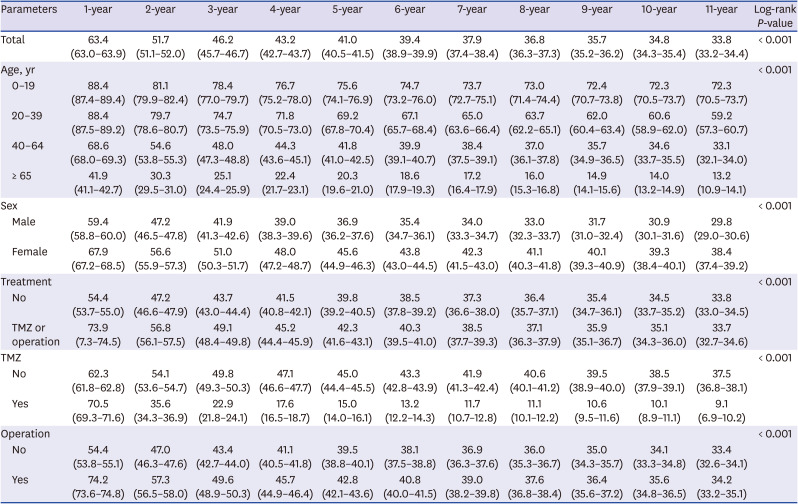
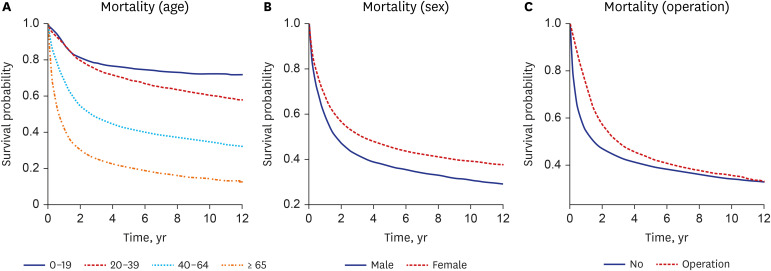
Survival probability was analyzed among total subjects. The results showed that 1-, 3-, 5-, and 10-year survival rates of 63.4%, 46.2%, 39.4%, and 34.8%, respectively (Table 3). We found that a significant difference in survival rate was noted by age. Notely, the 5-year survival rate in the young age group (< 19 years) was 75.6%, while that among the old age group (≥ 65 years) was 20.3%. The lower was the age, the higher was the survival rate over the entire period. During the overall period, female patients had a higher survival rate than male patients. When survival rates were analyzed according to treatment modality, survival rate in the operation group was superior to that in the non-operation group (Fig. 1).
Table 3
Serial survival rates according to epidemiological characteristics and treatment method
DISCUSSION
In this study, we reported the incidence, prevalence, survival rate, and survival time of patients with MG using a national population-based database in Korea. The results of this study reflect the characteristics and therapeutic propensity of all patients with MG in Korea, specifically analyzing sociodemographic data according to the C71 and KCD-7 codes.
The database of the national hospital-based cancer registry (Korean Central Cancer Registry [KCCR]), launched by the Korean Ministry of Health and Welfare in 1980, is particularly useful for showing the trend of cancer occurrence in Korea. The KCCR and the Brain Tumors Registration Committee of the Korean Brain Tumor Society together reported incidence rate of MG tumors in 2005 and 2010 of about 2.1 and 3.0 per 100,000 person-years, respectively. However, our study showed an incidence rate of 7.47 over a period of 10 years and of 7.97 in 2010, which was two times higher than in previous studies.56 The difference in results are due to our use of nationwide data from the NHIS versus the previous limited data from approximately 400 hospitals, in which a fair number of patients were likely omitted.57
As shown in Table 4, the estimated incidence of MG (per 100,000) ranged from 2.48 to 7.3 in epidemiological studies on glioma. There are differences in data sources, study design, and diagnostic criteria among the studies. The incidence of MG in population-based registration projects in other countries was 4.9–7.3, which is higher than the 4.7–5.6 of hospital-based registration or prospective studies.58910111213141516 Incidence rates of MG in our study was 7.47 per 100,00, which seemed consistent with the results of other studies in western countries (Table 4). In contrast, a previous and only study focusing CNS tumors of Koreans reported that the incidence rates of MG were 2.48 per 100,000. Because our definition of MG using ICD code from NHID data was not operational, further prospective and well-designed studies are needed to validate of our study definition. This discrepancy between KCCR data and our study should be considered in interpretation of our findings.
Table 4
Comparison of incidence rate of patients with glioma among countries
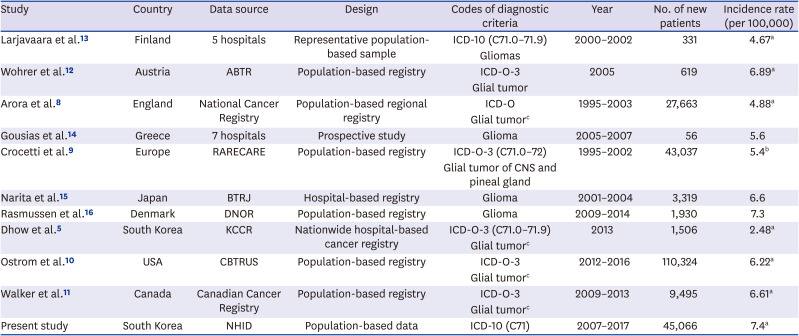
| Study | Country | Data source | Design | Codes of diagnostic criteria | Year | No. of new patients | Incidence rate (per 100,000) |
|---|---|---|---|---|---|---|---|
| Larjavaara et al.13 | Finland | 5 hospitals | Representative population-based sample | ICD-10 (C71.0–71.9) | 2000–2002 | 331 | 4.67a |
| Gliomas | |||||||
| Wohrer et al.12 | Austria | ABTR | Population-based registry | ICD-O-3 | 2005 | 619 | 6.89a |
| Glial tumor | |||||||
| Arora et al.8 | England | National Cancer Registry | Population-based regional registry | ICD-O | 1995–2003 | 27,663 | 4.88a |
| Glial tumorc | |||||||
| Gousias et al.14 | Greece | 7 hospitals | Prospective study | Glioma | 2005–2007 | 56 | 5.6 |
| Crocetti et al.9 | Europe | RARECARE | Population-based registry | ICD-O-3 (C71.0–72) | 1995–2002 | 43,037 | 5.4b |
| Glial tumor of CNS and pineal gland | |||||||
| Narita et al.15 | Japan | BTRJ | Hospital-based registry | Glioma | 2001–2004 | 3,319 | 6.6 |
| Rasmussen et al.16 | Denmark | DNOR | Population-based registry | Glioma | 2009–2014 | 1,930 | 7.3 |
| Dhow et al.5 | South Korea | KCCR | Nationwide hospital-based cancer registry | ICD-O-3 (C71.0–71.9) | 2013 | 1,506 | 2.48a |
| Glial tumorc | |||||||
| Ostrom et al.10 | USA | CBTRUS | Population-based registry | ICD-O-3 | 2012–2016 | 110,324 | 6.22a |
| Glial tumorc | |||||||
| Walker et al.11 | Canada | Canadian Cancer Registry | Population-based registry | ICD-O-3 | 2009–2013 | 9,495 | 6.61a |
| Glial tumorc | |||||||
| Present study | South Korea | NHID | Population-based data | ICD-10 (C71) | 2007–2017 | 45,066 | 7.4a |
ASR = age-standardized rate, CR = crude rate, ABTR = Austrian Brain Tumor Registry, RARECARE = Surveillance of Rare Cancers in Europe, BTRJ = Brain Tumor Registry of Japan, DNOR = Danish Neuro-Oncology Registry, KCCR = Korean Central Cancer Registry, CBTRUS = Central Brain Tumor Registry of the US, NHID = National Health Insurance Database, ICD = International Classification of Disease.
aASR; bCR; cGlial tumor: astrocytic tumors, oligodendroglial tumors, mixed gliomas, ependymal tumors, glial tumors of uncertain origin, and neuronal and mixed neuronal-glial tumors.
The current study of the MG cases diagnosed in South Korea over 11 years showed little difference in incidence rate between the high SES group and the low SES group. However, previous studies in the United States and Europe estimated statistically significant relative risks of glioma ranging from 1.1 to 1.2 when comparing high and low SES groups.171819 One study that analyzed race/ethnicity subtypes showed significantly lower incidence rates in Asia-Pacific countries of high SES compared with those of low SES.19 High SES is associated with better access to treatment including surgery, chemotherapy, radiation, and other adjunctive options, which are associated with better survival rates.2021 In the present study, patients with low SES had less opportunity to undergo TMZ and operation and a higher risk of death compared with patients with high SES.
Younger tumor patients generally show different characteristics compared with older patients.22 Our study showed that the five-year survival rate significantly decreased according to age (0–19 years, 20–39 years, 40–64 years, and over 65: at 75.6%, 69.2%, 41.8%, and 20.3%, respectively). This is similar to the result of a recent study by Central Brain Tumor Registry of the US on primary malignant brain and other CNS tumors between 2012 and 2016, with survival rates of 75.5% in patients under 19 years, 65.1% at 20–44 years, and 20.8% in patients over 65 years.10 Previous studies about cancer incidence and survival rate in adolescents and young adults have been reported.232425 In particular, Moon et al.26 reported that the survival rate of young patients in Korea improved from 58.9% in 1993–1995 to 84.8% in 2006–2010, and survival rates for astrocytoma and other gliomas in 2006–2010 were 54.3%–71.2%. These results are similar to our findings.
In addition, we found that men had a higher prevalence of MG, and women had a 5-year survival rate of 45.6%, which was significantly higher than the 36.9% in men. According to other population-based studies, the incidence of gliomas varies significantly by sex, with a 30%–50% higher incidence in males.4 Recent studies have demonstrated sex differences in glioma, and sex-specific analysis not only revealed the genetic source of sexual dimorphism risk, but that it is possible to increase the detectability of loci where effect size or direction may vary by sex.2728 Surgical resection of gliomas improved prognosis, and multimodal treatment with chemotherapy has been widely used to increase the survival rate of glioblastoma and recurred gliomas.29 In the present study, patients operated had a slightly higher survival rate over the entire period.
This study is the first report showing the incidence, prevalence, and the survival rate of MG according to SES using a population-based database in Korea. However, there are some limitations to this study. The first is that NHID is intended to process insurance claims and not for research purposes or design, so it is difficult to ensure accurate clinical information for all subjects. In addition, individual clinical data that would be useful to validate the survival rate and treatment results, such as symptom onset, family history, past medical history, neurological manifestation or laboratory test, and social history, was not included in NHID, unlike in hospital-based databases. The second is that data was not separated from key parameters, which impact mortality, such as histopathological diagnosis, tumor markers (MGMT, IDH1/2 mutation and others), extent of surgery, and type of treatment. The third is that the KCD code C71 used in the present study was classified according to ICD-10. However, it was not determined based on histopathology but instead separated based on anatomical location, making it difficult to properly reflect the propensity of each particular tumor. Furthermore, it is also possible that an error occurred during the registration process for insurance claims. Additionally, radiation therapy can be used for glioma treatment in addition to surgery and chemotherapy. However, as this study included only the classical methods of medication and operation, the impact of radiotherapy and outcome of radiation therapy were not addressed. Further research in this field is needed. Fourth, this study could not exclude deaths from other causes unrelated to MG, such as cardiovascular disease and traumatic accident. In last, although we validated the accuracy of our methodology to identify gliomas by retrospectively reviewing electronic medical records at a tertiary referral hospital in Korea, the results might not be generalizable to other hospitals.
In conclusion, our study reported that an actual incidence of MG in Korea was 7.47 per 100,000 people based on a population-based database including nearly the entire population. We also found that female sex and higher SES significantly reduced the mortality rate in MG. Furthermore, younger age groups and patients treated with operation showed significantly higher survival rates.
 XML Download