

 PDF
PDF Citation
 Print
Print


INTRODUCTION
Osteocalcin is a non-collagenous protein synthesized and secreted into the blood by osteoblasts and has been routinely used as a serum marker of osteoblastic bone formation.12 Osteocalcin undergoes post-translational carboxylation of its glutamic acid residues to form γ-carboxyl glutamic acid, via a vitamin K-dependent reaction.23 Therefore, the circulating osteocalcin protein level consists of both carboxylated and undercarboxylated osteocalcin. Functionally, osteocalcin is a bone-derived hormone that critically regulates energy metabolism. Indeed, knockout mice lacking osteocalcin exhibited hyperglycemia, reduced serum insulin, increased fat mass and decreased energy expenditure, compared with wild type controls.3 Additionally, administration of recombinant osteocalcin protein to mice significantly reduced the fat mass, decreased the fasting glucose levels, and elevated insulin concentration compared with mice injected with vehicle alone.4 These functions of osteocalcin are fulfilled by undercarboxylated osteocalcin that promotes the proliferation of pancreatic β-cells via G protein-coupled receptor C6A (GPRC6A) and increases insulin secretion in mice.56
Based on these observations, osteocalcin may play a similar role in humans and depending on its levels, contribute to adverse metabolic outcomes including metabolic syndrome (MetS). Although the undercarboxylated form of osteocalcin enhanced pancreatic β-cell proliferation and insulin secretion in human pancreatic islets in vitro,7 the significance of these effects on glucose metabolism in vivo in humans remains unknown.8910111213 On the other hand, in several clinical studies, serum osteocalcin was correlated with insulin resistance and appeared to be involved in the development of obesity and diabetes mellitus.101314 Accumulating evidence points to an association between serum osteocalcin levels and development of MetS in men as well as in postmenopausal women.151617181920212223 However, although serum osteocalcin levels are influenced by menopausal status as well as ethnicity, gender, and age,2425 few studies have been conducted to specifically compare premenopausal and postmenopausal women in terms of the association between osteocalcin and MetS. Because the menopausal transition alters bone and energy metabolism, it seems plausible that osteocalcin may exhibit a different relationship with metabolic dysregulation in premenopausal women compared with postmenopausal women. Therefore, we specifically investigated this association in premenopausal and postmenopausal Korean women.
METHODS
Study participants
A total of 68,128 women over 18 years of age were enrolled for this study at the Health Promotion Center in Changwon, Korea, from July 2011 to December 2016. All women visited our center for general health screening and were interviewed and examined by clinicians. Exclusion criteria were: a history of malignancy; coronary artery disease; stroke; treatment for osteoporosis with any medication; use of medications known to influence bone density, such as vitamin D, estrogen, corticosteroids, thyroid hormone; use of anti-hyperlipidemic agents; history of bilateral oophorectomy; renal failure; liver disease, or thyroid dysfunction; abnormal liver, thyroid, or kidney function; and treatment with anticoagulants, anticonvulsants, or multivitamins including vitamin K. Additionally, we excluded persons with incomplete data or missing information regarding menopausal history. If a woman visited more than once, only the last visit was included in the analysis. After the application of the exclusion criteria, a total of 5,896 women aged 19 to 85, comprising a premenopausal group (n = 3,951) and a postmenopausal group (n = 1,945), were selected. Menopause was defined as the absence of natural menstruation for at least 12 months without any other medical cause for amenorrhea, or a serum follicle stimulating hormone (FSH) concentration > 40 mIU/mL.1726 For subgroup analysis considering menopausal transition, participants whose FSH values were measured were divided into three group based on FSH levels: premenopausal (FSH ≤ 10 mIU/mL), perimenpausal (10 < FSH < 40 mIU/mL), and postmenopausal (FSH ≥ 40 mIU/mL).26
Clinical and anthropometric evaluation
All enrolled subjects completed a standardized questionnaire that included questions pertaining to medical history including present and past illnesses as well as their menstruation history. Height and weight were measured and body mass index (BMI) was calculated as weight (kg) divided by height squared (m2), using an automatic stadiometer (BSM 370; Biospace Co., Ltd., Seoul, Korea). Waist circumference (WC) was measured midway between the lowest rib and the iliac crest in the standing position. Systolic and diastolic blood pressures (SBP and DBP) were measured in the sitting position after 10-minute seated rest, using an automatic sphygmomanometer (EASY X 800; Jawon Medical Co., Ltd, Seoul, Korea).
Biochemical analyses
Biochemical analyses were performed on blood samples obtained after overnight fasting. Fasting plasma glucose (FPG) level was measured via a glucose hexokinase in vitro diagnostic assay (Glucose HK gen.3; Roche Diagnostics, Mannheim, Germany) using the Roche-Hitachi Cobas 8000 c702 analyzer (Roche Diagnostics). Hemoglobin A1c (HbA1c) levels were analyzed via high-performance liquid chromatography (HPLC) using the Tosoh HLC-723 G8 analyzer (Tosoh Co., Tokyo, Japan). Total cholesterol (TC), high-density lipoprotein cholesterol (HDL-C), low-density lipoprotein cholesterol (LDL-C), triglyceride (TG), serum high sensitivity-C-reactive protein (hs-CRP), and alkaline phosphatase (ALP) levels were measured using enzymatic procedures with Cobas reagents and were analyzed using the Cobas 8000 c702 analyzer (Roche Diagnostics). Serum concentrations of osteocalcin were determined using an electrochemiluminescence immunoassay (Roche Diagnostics). Insulin resistance was estimated via the homeostatic model assessment for insulin resistance (HOMA-IR) index27:
Definition of MetS
The diagnosis of MetS was based on the presence of three or more following criteria: 1) WC ≥ 80 cm (in accordance with the International Obesity Task Force criteria for the Asian-Pacific population); 2) SBP and/or DBP ≥ 130/85 mmHg or use of anti-hypertensive medications; 3) FPG ≥ 100 mg/dL or use of anti-diabetic medications; 4) Serum TG levels ≥ 150 mg/dL; and 5) HDL-C levels < 50 mg/dL, in agreement with the definition established by the modified National Cholesterol Education Program-Adult Treatment Panel III (NCEP-ATP III).2829
Statistical analyses
All calculations were performed using Stata 14.0 (Stata Corporation, College Station, TX, USA). All P values were calculated using two-tailed tests, and statistical significance was considered established at values where P < 0.05. Continuous data were expressed as mean ± standard deviation (SD) and categorical variables were reported as number or percentage (%). Study population characteristics were stratified according to the presence or absence of MetS and were analyzed using independent t-tests for continuous variables and Pearson χ2 tests for categorical variables. Serum osteocalcin levels according to the number of MetS components were evaluated using multiple linear regression analysis and expressed as mean ± standard error (SE). The most important explanatory variables for serum osteocalcin were determined using multiple regression analyses. FPG and BMI were excluded from the analysis of independent variables to avoid multicollinearity (variance inflation factor [VIF] > 10). Binary logistic regression analysis was performed to evaluate the odds ratios (ORs) for the presence of MetS according to serum osteocalcin concentration quartiles. Three adjusted models were used for the analyses. Model 1 was adjusted for age. Model 2 was further adjusted for factors significantly associated with osteocalcin in the multiple regression analyses and known as osteocalcin-associated factors except for MetS components: ALP, uric acid (UA), hs-CRP, and BMI. Model 3 was additionally adjusted for menopausal status. The three models were compared using their Akaike information criterion (AIC) and Bayesian information criterion (BIC) to assess whether the additional explanatory variables improved the model fit.
RESULTS
Characteristics of the subjects
Baseline characteristics of study subjects are listed in Table 1. Overall prevalence of MetS was 11.3%, with 8.1% of premenopausal women and 17.6% of postmenopausal women meeting the definition.2829 Postmenopausal women tended to be older with significantly higher values for SBP, DBP, BMI, WC, FPG, HbA1c, TC, TG, LDL-C, ALP, UA, and serum osteocalcin and significantly lower levels of HDL-C than premenopausal women. Serum osteocalcin levels were higher in postmenopausal women after adjustment for age, BMI, ALP, UA, and hs-CRP (Fig. 1A), which was consistent with previously reported data.1624 All parameters, except hs-CRP and serum osteocalcin in postmenopausal women, differed significantly between participants with and without MetS in both the groups.
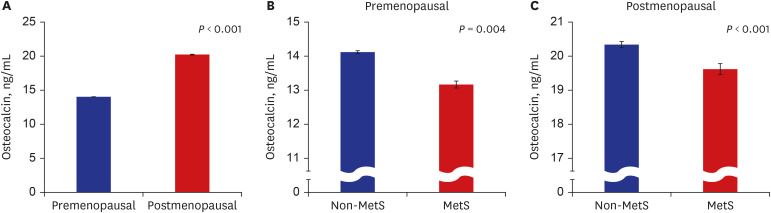
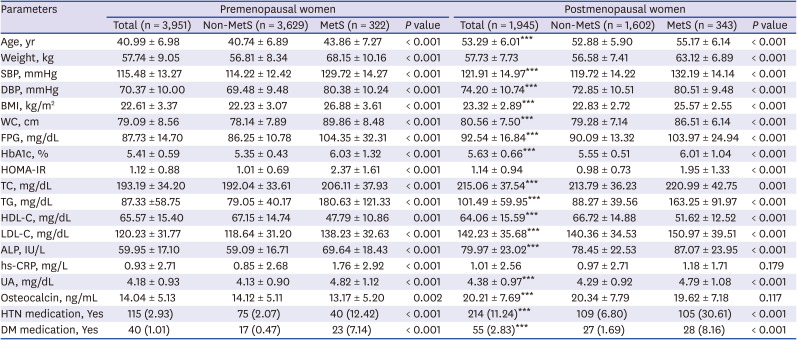
Fig. 1
Serum osteocalcin levels in relation to menopause and metabolic syndrome. (A) Mean serum osteocalcin levels in premenopausal and postmenopausal women. (B, C) Mean serum osteocalcin levels in MetS and non-MetS groups. Data were adjusted for age, BMI, ALP, UA, and hs-CRP, and are presented as mean ± standard error. Multiple linear regression analysis was performed to determine the level of significant difference.
MetS = metabolic syndrome, BMI = body mass index, ALP = alkaline phosphatase, UA = uric acid, hs-CRP = high sensitivity-C-reactive protein.
![]()
Table 1
Baseline characteristics of the study population based on the presence or absence of MetS
Data are presented as mean ± standard deviation or number (%).
MetS = metabolic syndrome, SBP = systolic blood pressure, DBP = diastolic blood pressure, BMI = body mass index, WC = waist circumference, FPG = fasting plasma glucose, HbA1c = hemoglobin A1c, HOMA-IR = homeostatic model assessment for insulin resistance, TC = total cholesterol, TG = triglyceride, HDL-C = high-density lipoprotein cholesterol, LDL-C = low-density lipoprotein cholesterol, ALP = alkaline phosphatase, hs-CRP = high sensitivity C-reactive protein, UA = uric acid, HTN = hypertension, DM = diabetes mellitus.
***P < 0.001 vs. premenopausal women: analyzed using independent t-tests for continuous variables and Pearson χ2 tests for categorical variables.
![]()
Association between serum osteocalcin and MetS
Serum osteocalcin levels of subjects with MetS were significantly lower than those without, in both premenopausal and postmenopausal women after adjustment for age, BMI, ALP, UA, and hs-CRP (Fig. 1B and C). Table 2 shows serum osteocalcin levels according to individual diagnostic criteria for MetS. Mean serum osteocalcin was lower in subjects with elevated WC, higher BP (or anti-hypertension medication) and increased FPG levels (or anti-diabetic medication) in premenopausal women. In postmenopausal women, it was significantly lower in participants with WC ≥ 80 cm, and FPG ≥ 100 mg/dL (or anti-diabetic medication). Osteocalcin levels according to the number of MetS criteria are shown in Fig. 2. A significant reduction in mean serum osteocalcin levels was observed with increasing MetS criteria in both the groups.
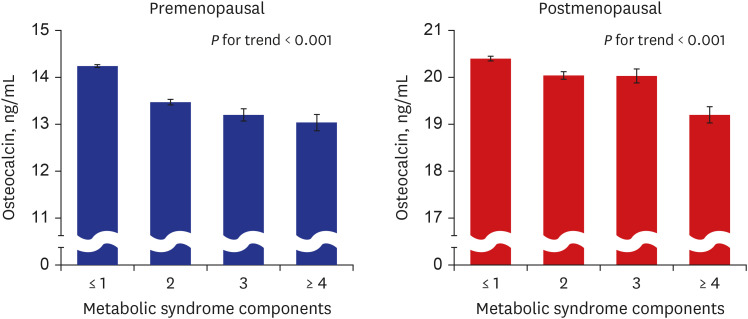
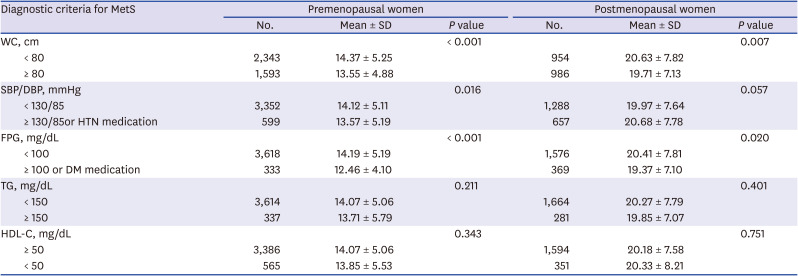
Fig. 2
Serum osteocalcin levels in relation to the number of MetS components. Data were adjusted for age, BMI, ALP, UA, and hs-CRP, and are expressed as mean ± standard error. Multiple linear regression analysis was performed to determine the level of significant difference.
MetS = metabolic syndrome, BMI = body mass index, ALP = alkaline phosphatase, UA = uric acid, hs-CRP = high sensitivity-C-reactive protein.
![]()
Table 2
Comparison of osteocalcin according to each diagnostic criterion for MetS
MetS = metabolic syndrome, SD = standard deviation, WC = waist circumference, SBP = systolic blood pressure, DBP = diastolic blood pressure, HTN = hypertension, FPG = fasting plasma glucose, DM = diabetes mellitus, TG = triglyceride, HDL-C = high-density lipoprotein cholesterol.
![]()
Association of serum osteocalcin with clinical and biochemical parameters
Multiple regression analysis was performed to investigate the parameters independently associated with serum osteocalcin, by considering it as a dependent variable, and age, SBP, DBP, WC, HbA1c, TG, HDL-C, UA, ALP, and hs-CRP as independent variables in premenopausal and postmenopausal women (Table 3). Considering the possibility of multicollinearity (VIF > 10), HbA1c was adopted as a variable instead of FPG. HbA1c measurement had less biologic variability and HbA1c level has been significantly related to several metabolic risk factors, including FPG.30 Serum osteocalcin levels were independently and inversely associated with WC, HbA1c, and hs-CRP in both premenopausal and postmenopausal women. Additionally, TG was also an independent predictor of osteocalcin in premenopausal women. Similar to findings from an earlier study,24 serum osteocalcin levels and age were negatively correlated in premenopausal women, and positively correlated in postmenopausal women.
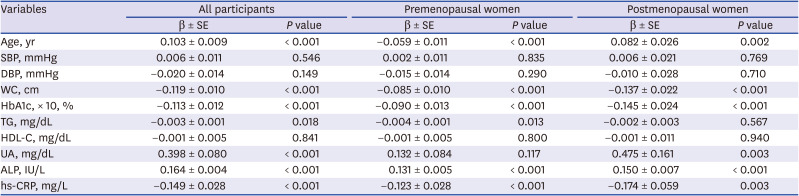
Table 3
Multiple regression analysis with serum osteocalcin as a dependent variable
SE = standard error, SBP = systolic blood pressure, DBP = diastolic blood pressure, WC = waist circumference, HbA1c = hemoglobin A1c, TG = triglyceride; HDL-C = high-density lipoprotein cholesterol, UA = uric acid, ALP = alkaline phosphatase, hs-CRP = high sensitivity C-reactive protein.
![]()
Another multiple regression analysis was performed using FPG and an added a parameter, HOMA-IR, instead of HbA1c with abovementioned the parameters (Supplementary Table 1). As with HbA1c, serum osteocalcin levels were independently and inversely associated with WC, FPG, and hs-CRP in both premenopausal and postmenopausal women. However, serum osteocalcin levels and HOMA-IR were positively correlated in premenopausal women, and not associated in postmenopausal women (Supplementary Table 1).
Adjusted ORs for MetS based on osteocalcin levels
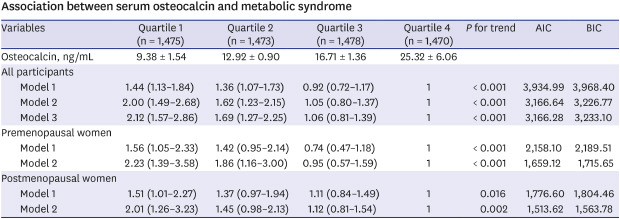
The results of the logistic regression analysis are shown in Table 4. When participants were divided into four groups based on serum osteocalcin levels, increased ORs of MetS were observed along with decreased serum osteocalcin levels after adjustment for age, ALP, UA, hs-CRP, and BMI in both premenopausal and postmenopausal women (model 2). Furthermore, in all women, the ORs for MetS were significantly higher in the lower two quartiles (Q1 and Q2) of serum osteocalcin levels than in the highest quartile (Q4) after further adjustment for menopausal status (Model 3). The AIC values of models 2 and 3 for all women were very similar. The lowest value of BIC for all women was found in model 2 (Table 4).
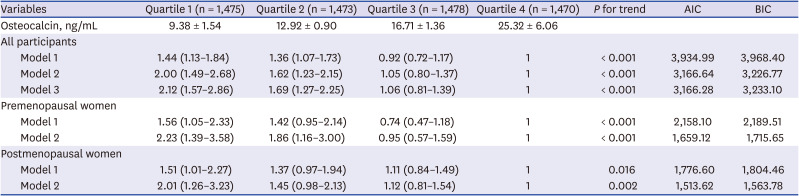
Table 4
Association between serum osteocalcin and MetS
Data are shown as mean ± standard deviation or odds ratio (95% confidence interval). Model 1 was adjusted for age. Model 2 was further adjusted for alkaline phosphatase, uric acid, high sensitivity C-reactive protein, and body mass index. Model 3 was further adjusted for menopausal status.
MetS = metabolic syndrome, AIC = Akaike information criterion, BIC = Bayesian information criterion.
![]()
Analysis of a subgroup excluding women previously diagnosed with hypertension or diabetes and on medication for that, yielded post-adjustment results (models 2 and 3) that were similar to those before exclusion (Supplementary Table 2 and Table 4). For another subgroup analysis regarding perimenopausal status, measured FSH values were divided by FSH concentrations (Supplementary Table 3). The results of models 2 and 3 in the table were similar to those of Table 4 in all women. In the perimenopausal and postmenopausal groups, the ORs for MetS were significantly higher in the lowest quartile (Q1) of serum osteocalcin levels than in the highest quartile (Q4) after further adjustment (model 2). In premenopausal women, the results showed similar trends, but were not statistically significant. The lowest values of AIC and BIC in all participants were found in model 2 (Supplementary Table 3).
DISCUSSION
The purpose of this study was to compare the relationship between osteocalcin and MetS according to menopausal status. To date, studies have yet to report the effect of menopausal status on the association between serum osteocalcin levels and MetS. This study directly compare these parameters. Menopause results in metabolic and endocrine changes as well as termination of fertility in women, leading to fat accumulation in the body, development of central obesity, and an increase in insulin resistance, which can result in MetS. Parameters such as blood pressure, total cholesterol, and LDL-C increase, and HDL-C decreases after menopause. This study confirms that menopause is accompanied by a general change in the metabolic characteristics studied. Since low serum osteocalcin level is associated with MetS in men and total serum osteocalcin levels rise with age after menopause,1624 the relationship between premenopausal serum osteocalcin and MetS may differ from that observed in postmenopausal levels. However, we found that lower serum osteocalcin levels were significantly associated with MetS in both groups, with or without menopause. In the logistic regression analysis (Table 4 and Supplementary Table 3), model 2 (all women with the lowest value of BIC) was considered more likely to adequately explain the association between serum osteocalcin and MetS, suggesting that menopausal status was not an appropriate determinant.
Previous studies reported that serum osteocalcin concentration was affected by age, gender, ethnicity,2431 and menopausal status.3233 In women, the level of serum osteocalcin showed a J-shaped relationship with age, with 40s being the vertex and the level of osteocalcin rising between 40s and 50s.2431 This relationship was also observed in our study (Supplementary Fig. 1) and its results stating that serum osteocalcin levels and age were negatively correlated in premenopausal women and positively correlated in postmenopausal women were consistent with the abovementioned study (Table 3). Osteocalcin is a bone turnover marker and high bone turnover occurs in women during menopausal transition. The perimenopause, which literally means “about or around the menopause,” begins at the same time as the menopausal transition and ends 1 year after the final menstrual period.34 In Koreans, the most recently reported mean age at natural menopause was 49.3 years.35 To account for changes during perimenopause, FSH values of participants were measured and divided by FSH concentrations. The menopausal staging definition was formulated at the Stages of Reproductive Aging Workshop (STRAW)34 and states that perimenopause encompassed both early transition (a gap in normal menstrual period of longer than 7 days) and late transition (≥ 2 skipped menstrual cycles or no menses for ≥ 60 days). However, using our questionnaire, we could not obtain detailed information about the pattern of menstrual changes outlined by STRAW, and because the definition of perimenopause is ambiguous, we defined perimenopausal women using FSH levels with reference to a previous study.26
Several studies have demonstrated the association between serum osteocalcin and metabolic abnormalities. Consistent with the results presented here, previous studies demonstrated that serum osteocalcin was negatively correlated with hyperglycemia in premenopausal and postmenopausal women.161719 Choudhury et al.20 reported a significant inverse association between osteocalcin level and type 2 diabetes with an effect size stronger in premenopausal women than in postmenopausal women. On the other hand, Kim et al.21 demonstrated that serum osteocalcin was associated with insulin resistance only in postmenopausal women in Korea. We observed that serum osteocalcin was positively correlated with HOMA-IR in premenopausal women, but no significant correlations were found in postmenopausal women, although osteocalcin was negatively correlated with FPG and HbA1c in both the groups (Table 3 and Supplementary Table 1). Some of these discrepancies may be explained by differences in study populations, inclusion and exclusion criteria, and adjustment strategies for potential confounders. We defined menopause as the absence of natural menstruation for at least 12 months without other medical causes for amenorrhea, or an FSH concentration > 40 mIU/mL,1726 whereas Kim et al.21 defined it as cessation of menstruation for at least 1year, with an FSH level ≥ 30 mIU/mL. Their premenopausal population tended to be older and postmenopausal population tended to be younger because a balanced study population (61 pairs) was selected among all participants. Considering that the average menopausal age of Korean women is approximately 50 years,35 they may not represent the general premenopausal and postmenopausal populations.21 Meanwhile, insulin regulates osteocalcin through insulin receptor signaling in osteoblasts.36 There is a feedback loop between osteocalcin and insulin, wherein each promotes the expression of the other.37 However, undercarboxylated osteocalcin did not correlate with insulin resistance measured via the hyperinsulinemic-euglycemic clamp technique in participants with type 2 diabetes.38 D'Amelio et al.39 reported that intermittent treatment with parathyroid hormone decreased glucose level consistent with increased osteocalcin level without influencing insulin secretion and resistance, pancreatic β-cell function, and fat mass in non-diabetic persons. These observations demonstrated that serum osteocalcin may affect glucose homeostasis in an insulin-independent manner. Furthermore, GPRC6A was found to be the only potential receptor for osteocalcin, but neither the structure of GPRC6A nor the molecular mechanism for osteocalcin binding has yet been reported.40 In a recent study, full locus GPRC6A knock out (KO) mice presented with normal serum insulin and glucose levels, and unchanged insulin sensitivity compared with wild type controls, although the KO mice exhibited significantly reduced serum osteocalcin protein and mRNA levels.41 These results revealed that GPRC6A may be not the actual receptor for osteocalcin or that ostecalcin may have another unknown mechanism for glucose regulation.
Dyslipidemia in MetS is characterized by elevated TG and reduced HDL-C levles.28 However, the relationship between osteocalcin and lipid metabolism is disputed.1617 Although our multiple regression analyses showed that serum osteocalcin correlated negatively with TG only in premenopausal women (Table 3), the current study failed to correlate osteocalcin level and other elements of the lipid profile (data not shown). The relationship between serum osteocalcin levels and blood pressure also appears unclear.22234243 We found that serum osteocalcin level was not related to blood pressure in multiple regression analyses (Table 3), which is consistent with a few studies2343 but not others.2242 The majority of the published studies report that osteocalcin level is inversely correlated with central obesity.182223 Chen et al.44 demonstrated a negative correlation between serum osteocalcin and waist-hip ratio (WHR) in men, but not in postmenopausal women. Our study shows that serum osteocalcin was negatively correlated with WC in both premenopausal and postmenopausal women.
Our findings are consistent with recent studies that have explored the relationship between osteocalcin and MetS.15 Yang et al.18 investigated postmenopausal women in China and found an inverse association of serum osteocalcin with MetS. Other prior studies have demonstrated an inverse correlation between serum osteocalcin levels and MetS in Chinese men22 and in older individuals from the Netherlands.45 MetS has become a major worldwide public health epidemic, with particular manifestations such as type 2 diabetes mellitus (T2DM) and cardiovascular disease (CVD).4647 The finding that osteocalcin is a regulator of energy metabolism has led to several studies investigating its relationship with CVD. A systematic review and meta-analysis demonstrated no obvious association between osteocalcin and atherosclerosis.48 However, a few investigators found that osteocalcin expression was associated with vascular calcification in in vivo and in vitro animal experiments.495051 Akiyoshi and colleagues52 observed that higher osteocalcin levels in C57BL/6 mice were positively correlated with an increase in thoracic aorta calcification. Further studies based on study populations and characteristics, inclusion and exclusion criteria, and osteocalcin assay methods, as well as measures of vessel calcification or atherosclerosis are required to resolve the discrepancies seen in these results.
Ferron et al.4 showed that daily injections of recombinant osteocalcin in mice fed with a high-fat diet improved glucose intolerance and insulin sensitivity, increased overall energy expenditure and prevented obesity. They concluded that treatment with osteocalcin alleviated glucose intolerance and prevented the onset of T2DM. Furthermore, several clinical studies have suggested that serum osteocalcin may be a potential therapeutic target in future prevention and treatment efforts against adverse metabolic outcomes such as MetS.15 Our results provide indirect evidence supporting this potential approach targeting women, irrespective of menopausal status.
In our study, the participants were restricted to a single institution, which was a limitation. A possible selection bias and the retrospective cross-sectional design were the other study limitations. Furthermore, dietary and smoking habits, alcohol consumption and physical activity were not considered. Vitamin K levels affect the post-translational modification of osteocalcin protein; however, no assays of vitamin K were conducted. Nevertheless, to minimize the possibility of this effect, the study was performed on subjects who were not treated with vitamin K antagonists or multi-vitamin supplements. We measured only total osteocalcin and did not measure the undercarboxylated form. Epidemiological studies have shown the association of lower levels of undercarboxylated osteocalcin with insulin resistance and risk of type 2 diabetes, although the method for assaying circulating undercarboxylated osteocalcin needs to be optimized.115354 However, it is still unclear whether undercarboxylated osteocalcin is the metabolically active form in humans.8910111213 We defined perimenopausal women by FSH levels while studying subgroup analysis considering menopausal transition.26 Application of other criteria for perimenopause may yield different results.
Despite these limitations, this study is one of a few studies showing an association between serum osteocalcin levels and MetS in premenopausal women. Although serum osteocalcin level in postmenopausal women was higher than that in the premenopausal women, a lower serum osteocalcin level was significantly associated with MetS in both the groups. No significant differences of association existed between osteocalcin and MetS with respect to menopausal status. Thus, serum osteocalcin may act as a menopause-independent metabolic regulator. Further studies are needed to shed light on the mechanisms underlying the role of osteocalcin in MetS and CVD.
 XML Download