

 PDF
PDF Citation
 Print
Print


INTRODUCTION
Coronavirus disease 2019 (COVID-19) was first reported in Wuhan, China on 31 December 2019, and then rapidly spread worldwide. The number of confirmed cases worldwide now exceeds 40 million and the overall mortality rate stands at 2.8%.1 Reported CT findings of COVID-19 pneumonia include multiple areas of pure ground-glass opacity (GGO) with or without a crazy-paving pattern, mixed consolidation and GGO, which are typically observed in subpleural or peribronchovascular areas of both lungs.2345 Cavities, large or centrilobular nodules, pleural effusion, and lymphadenopathy are rare.2345
In viral infections, the main role of imaging is to identify the presence of pneumonia, provide a differential diagnosis, and to evaluate changes in disease statuses and treatment responses.6 In this respect, radiologists should analyze lung abnormalities in terms of distribution, extents, and specific patterns.
Viral pneumonia in an immunocompetent host can be classified into bronchopneumonia, organizing pneumonia (OP), or diffuse alveolar damage (DAD) patterns and these patterns are closely related to prognosis.7
The purpose of the present study was to analyze retrospectively the initial clinical and chest CT findings of COVID-19 and to determine their relationships with clinical severity.
Go to : 
METHODS
Patients and clinical data
This retrospective study was approved by the Institutional Review Board of the Pusan National University Hospital (2004-034-090), which waived the requirement for informed consent. This study used the open data repository for COVID-19, namely, the Korean Imaging Cohort for COVID-19 (KICC-19), which was constructed by the Korean Society of Thoracic Radiology (KSTR) during July 2020.89 From February through May 2020, 522 adult patients (≥ 18 years old) with real-time reverse transcriptase-polymerase chain reaction (RT-PCR) results and positivity for coronavirus by nasal and oropharyngeal swab testing were enrolled in KICC-19. Other respiratory pathogens capable of causing symptoms were excluded by RT-PCR and sputum culture. Of these 522 patients, 271 underwent chest CT within 10 days of diagnosis and constituted the study cohort. Mean time between symptom onset and chest CT examination was 5.5 ± 2.7 days (range, 0–10 days).
Demographics, clinical symptoms, underlying diseases, initial laboratory findings including lymphocyte counts, C-reactive protein (CRP), procalcitonin, type of treatment, duration of hospital stay, clinical severity, and clinical outcome (cure or death) of the 271 study subjects were evaluated. Lymphocytopenia was defined as fewer than 1,000 lymphocytes per microliter of blood.1011 The thresholds for CRP and procalcitonin elevation were 0.5 mg/dl and 0.05 ng/ml, respectively.1213 The 271 patients were divided into 2 groups, that is, a severe group of patients who needed additional oxygen therapy or mechanical ventilation, and a mild group of patients who did not.
CT imaging protocol and reconstruction profiles
All CT examinations were performed using multi-detector CT scanners with more than 16 channels. Scans were obtained from lung apices to lung bases. Intravenous contrast medium was injected in only 9 patients (3%). Of the 271 scans, 133 (49%) and 130 (48%) were obtained using a slice thickness of ≤ 1.5 mm or between 1.5 and 3 mm, respectively; only 8 CT scans (3%) were constructed using a slice thickness of > 3 mm.
All images were anonymized locally and transferred to a cloud-based web interface (AiCRO System, Asan Image Metrics (AIM), Strategy & Development Unit, Clinical Trial Center, Asan Medical Center, Korea) for analysis. CT data were also transferred to a post-processing workstation (syngo.via, Siemens) for further analysis by an investigator with 18 years' experience in thoracic imaging.
Image analysis
Two radiologists with 9 and 13 years of chest CT experience unaware of patient clinical severity, reviewed all images and reached conclusions by consensus. Only the first CT examination was analyzed if a patient underwent multiple CT examinations within 10 days of COVID-19 diagnosis. Times between symptom onsets and CT examinations were recorded. CT findings were evaluated for the presence, distribution, and extents of parenchymal abnormalities including GGO, consolidation, crazy-paving appearance, reversed halo sign, interlobular and intralobular interstitial thickenings, reticulation, subpleural lines, traction bronchiectasis, air-bronchograms, large nodules, and centrilobular nodules. A crazy-paving appearance was defined as thickened interlobular septa and intralobular lines superimposed on a background of GGO, and the reversed halo sign was defined as a focal rounded area of GGO surrounded by a near or complete ring of consolidation.14 The presences of vascular enlargement, pleural effusion, hilar, and mediastinal lymph node enlargement were also evaluated. An enlarged lymph node was defined as one with a short-axis diameter of > 10 mm. In addition, the presence of vascular enlargement was evaluated and defined as a vessel diameter larger than that expected based on its location in the vascular tree, than in an adjacent portion of non-diseased lung, or in a comparable region of non-diseased contralateral lung or focal dilation or non-tapering of vessels as they coursed toward lung periphery. Vessel enlargement within areas of parenchymal opacity, outside of opacities, and dilated distal subsegmental vessels touching pleura or fissure were recorded.15
Total extents of all parenchymal lesions were assessed using a visual scoring system and artificial intelligence (AI) software (CT Pneumonia Analysis 2.1.2, syngo,via FRONTIER, Siemens). With a visual CT scoring system, each lung lobe was visually scored from 0 to 5 as: 0, no involvement; 1, < 5% involvement; 2, 5%–24%; 3, 25%–49%; 4, 50%–74%; 5, ≥ 75%. Visual CT scores were the sum of the individual lobar score and ranged from 0 to 25. With AI software for the automatic quantification of COVID-19, the total extent of lung parenchymal abnormality was calculated. Data from 245 patients were analyzed in automatic measurement; 26 patients were excluded due to data non-availability.
Laterality (unilateral and bilateral) and distributions of lung parenchymal abnormalities in the transverse (central, peripheral, peribronchovascular, and random) and longitudinal planes (upper zone, middle zone, lower zone, and random) were evaluated.
Parenchymal abnormalities were then classified into; bronchopneumonia, OP, or DAD patterns. When parenchymal abnormalities contained areas of consolidation, GGO, large nodules, centrilobular nodules, and bronchial wall thickening, they were considered to exhibit a bronchopneumonia pattern. OP patterns were considered to show lung abnormalities consisting of consolidation and GGO with subpleural or peribronchovascular predominance, and DAD patterns were considered to demonstrate patchy or extensive airspace consolidation or GGO without zonal predominance.
Statistical analysis
Statistical analysis was performed using SPSS Ver. 21.0 software (SPSS, IBM SPSS Statistics, Armonk, NY, USA). Results are expressed as means (SDs) for continuous variables and as numbers of individuals and percentages for the categorical variables.
The Mann-Whitney U test, the χ2 test, and Fisher's exact test were used to determine the significances of differences between clinical and CT features of the severe and mild groups. Factors associated with poor prognosis were identified by univariate and multivariate logistic regression analysis. The comparison of two prediction models, which included visual CT scores and AI measurement, respectively, was performed with a receiver operating characteristic (ROC) analysis. Statistical significance was accepted for P values of < 0.050 throughout.
Ethics statement
The present study protocol was approved by the Institutional Review Board of the Pusan National University Hospital (2004-034-090), which waived the requirement for informed consent.
Go to :
RESULTS
Demographics and clinical data
The demographics and clinical data of the 271 patients, all of whom performed a chest CT scan, are presented in Table 1. There were 116 men and 155 women of mean age 52.9 ± 19.5 years (range, 15–97 years). One hundred and four (38.4%) had underlying disease: hypertension (n = 71), diabetes (n = 46), cardiovascular disease (n = 13), or cancer (n = 27). One hundred and fifty-seven were febrile and 131 had respiratory symptoms such as a cough with or without sputum production. One hundred and twenty-two patients were treated with lopinavir/ritonavir and 83 with hydroxychloroquine. Mean hospital stay was 25.2 ± 15.6 days (range, 0–94 days). Although most patients had cured, ten patients (3.7%) died.
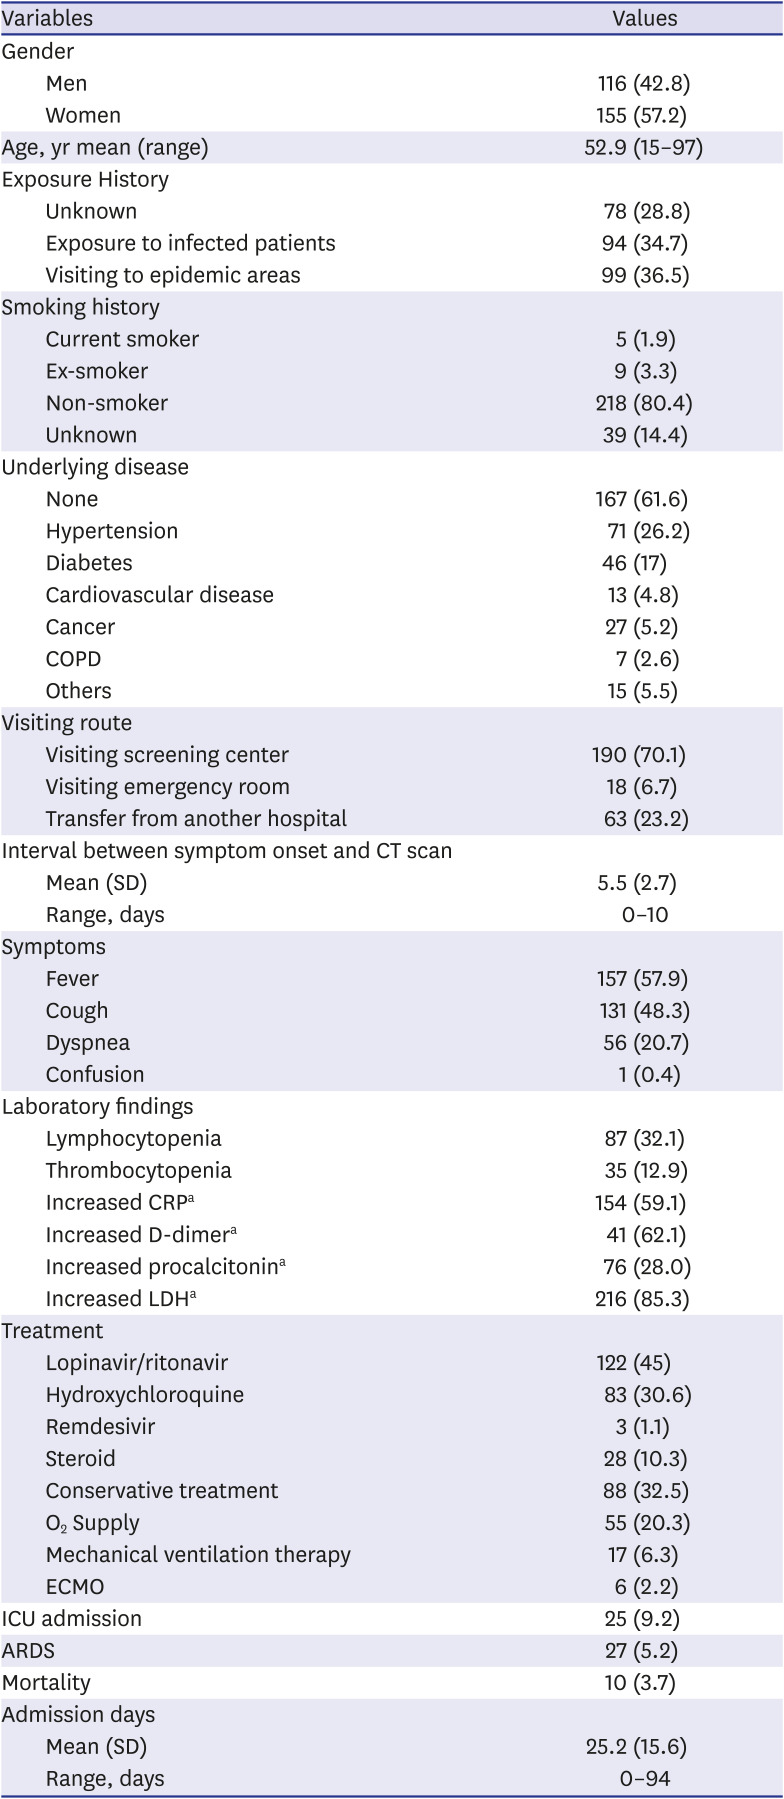
Table 1
Clinical data of patients with coronavirus disease 2019 pneumonia
COPD = chronic obstructive pulmonary disease, SD = standard deviation, CRP = C-reactive protein, LDH = lactate dehydrogenase, ECMO = extracorporeal membrane oxygenation, ICU = intensive care unit, ARDS = acute respiratory distress syndrome.
aCRP results were available for 269 patients, D-dimer in 66 patients, procalcitonin in 219 patients, and LDH in 253 patients.
![]()
Eighty-seven (32.1%) had lymphocytopenia and 154 (56.8%) elevated CRP at admission. An elevated procalcitonin level was observed in 76 (28%) patients. Fifty-five (20.3%) needed additional oxygen therapy or mechanical ventilation, and 216 did not (Table 2). Of the 55 patients in the severe group, 10 died of respiratory failure. Regarding demographics, only age was significantly different in severe and mild groups (P < 0.001). Lymphocytopenia, elevated CRP, and procalcitonin were more commonly observed in the severe group (Ps < 0.050)
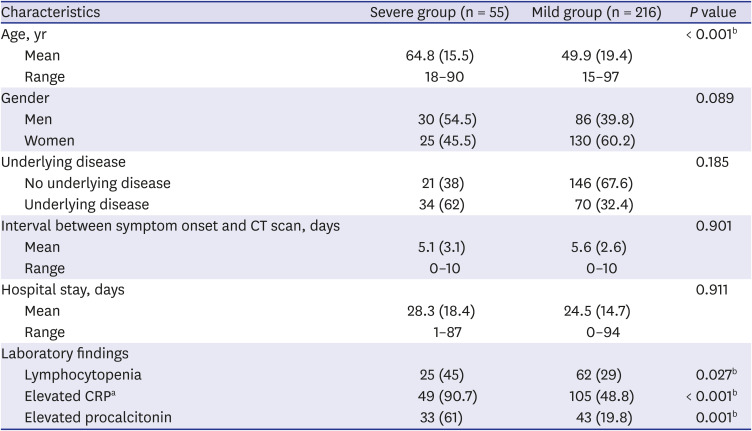
Table 2
Clinical data of patients with coronavirus disease 2019 pneumonia according to clinical severity
Data are means (standard deviations). Numbers in parentheses are percentages, unless specified otherwise.
CRP = C-reactive protein.
aCRP results were available for 53 patients in the severe group and 216 patients in the mild group; bStatistically significant in the severe and mild patient groups (P < 0.050).
![]()
CT findings
Of the 271 patients, 45 (16.6%) had normal chest CT findings. CT findings of COVID-19 pneumonia in the other 226 (83.4%) patients are presented in Table 3. The most common CT finding among these 226 patients was GGO (98%, 221 patients), followed by consolidation (53%, 120 patients), intralobular interstitial thickening (34%, 77 patients), and a crazy-paving appearance (25%, 56 patients). Other findings (in decreasing order of frequency) were air bronchogram, (19%, 42 patients), reversed halo (8%, 17 patients), reticulation (5%, 12 patients), traction bronchiectasis (5%, 11 patients), pleural effusion (4%, 8 patients), centrilobular nodules (3%, 7 patients), subpleural line (3%, 7 patients), and interlobular septal thickening (3%, 6 patients). Only twelve patients (5%) had vascular enlargement and the majority (11 patients) showed vessel enlargement within areas of parenchymal opacity; vessel enlargement outside opacity was observed in only one patient.
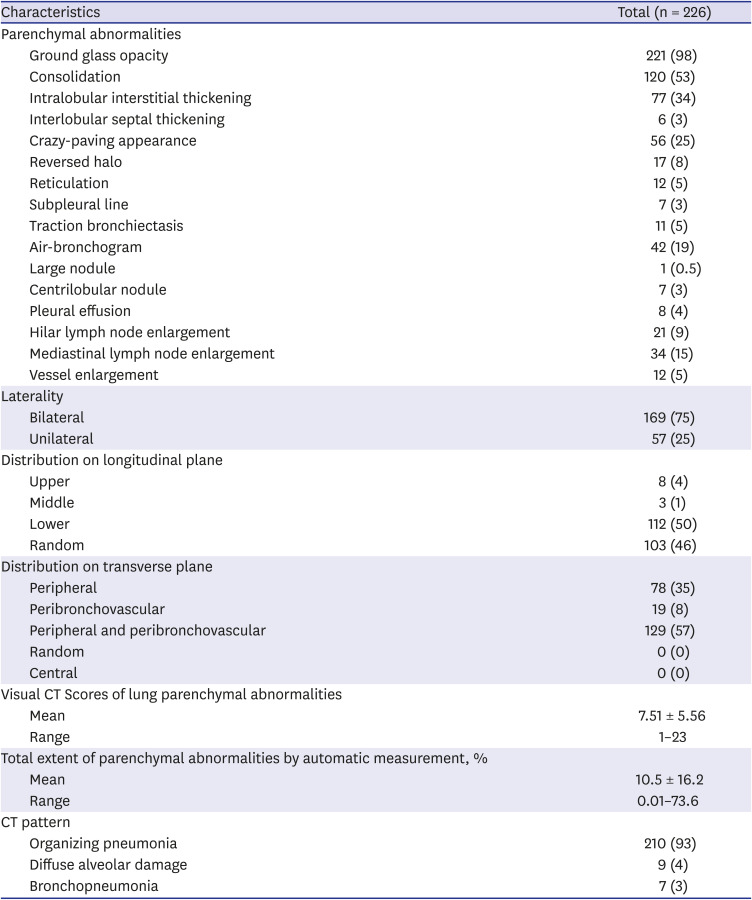
Table 3
CT findings of coronavirus disease 2019 pneumonia
![]()
The parenchymal abnormalities were bilateral in 169 patients (75%) and unilateral in 57 patients (25%). In the longitudinal plane, lung abnormalities showed mainly lower lung involvement (50%, 112 patients) and random involvement (46%, 103 patients). In the transverse plane, the lung abnormalities showed mainly peribronchovascular predominance (57%, 129 patients) and all 226 exhibited a peripheral or peribronchovascular distribution. The mean visual CT score of parenchymal abnormalities was 7.51 ± 5.56 (range, 1–23) and mean total extent by automatic measurement was 10.5 ± 16.2 (range, 0.01%–73.6%).
The CT findings were classified as OP (93%, 210 patients), DAD (4%, 9 patients), or bronchopneumonia (3%, 7 patients) (Figs. 1 and 2). Table 4 summarizes CT findings for the severe and mild groups. GGO, consolidation, intralobular and interlobular interstitial thickening, crazy-paving appearance, reticulation, traction bronchiectasis, air-bronchogram, mediastinal and hilar lymph node enlargement were most frequently observed in the severe group (all P < 0.050). Bilateral parenchymal abnormalities were more common in the severe group (P < 0.001). Random distribution in the longitudinal plane and peripheral and peribronchovascular distribution in the transverse plane were more frequently observed in the severe group (both P < 0.001). Mean visual CT score and total extent of automatic measurement were higher in the severe group (11.8 vs 4.9, P < 0.001 and 27.5% vs 5.9%, P < 0.001, respectively). All patients with DAD patterns were in the severe group. Of the 10 patients that died, 3 showed a DAD pattern and the remaining 7 showed an OP pattern (Fig. 2).
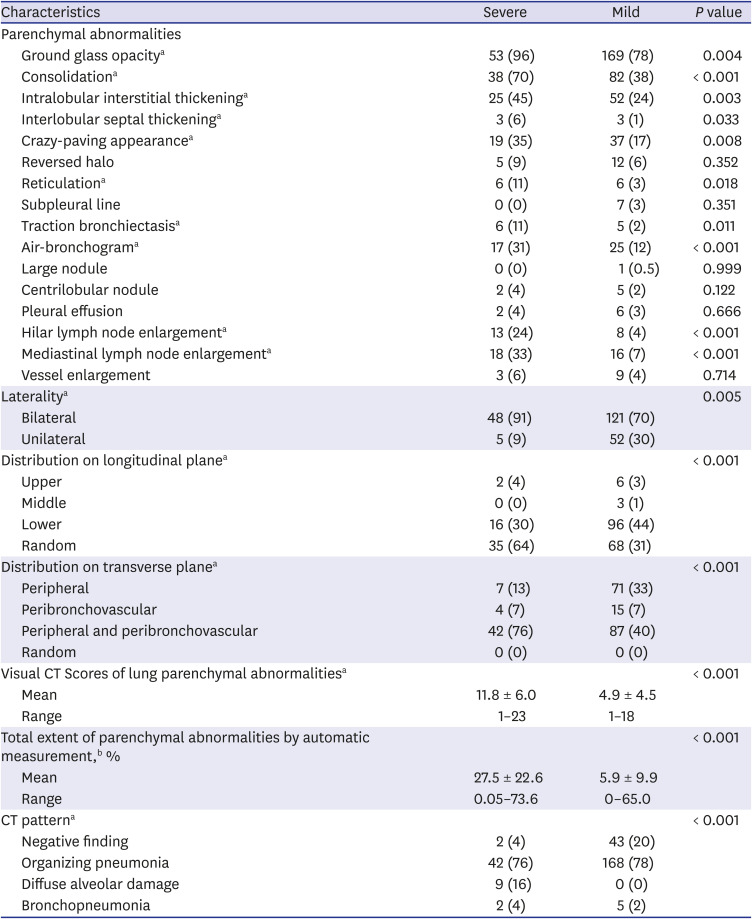
 | Fig. 1Coronavirus disease 2019 pneumonia showing an organizing pneumonia pattern in a 73-year-old man. (A, B) Serial axial CT scans obtained 5 days after symptom onset show patchy areas of ground glass opacity with a crazy-paving appearance distributed mainly in subpleural areas of both upper lungs. Visual CT score and total extents of automatic measurement of lung parenchymal abnormalities on initial CT images were 15 and 23.7%, respectively. (C, D) Follow-up axial CT scan obtained 1 months later showing partially improved lesions with residual subpleural lines.CT = computed tomography.
|
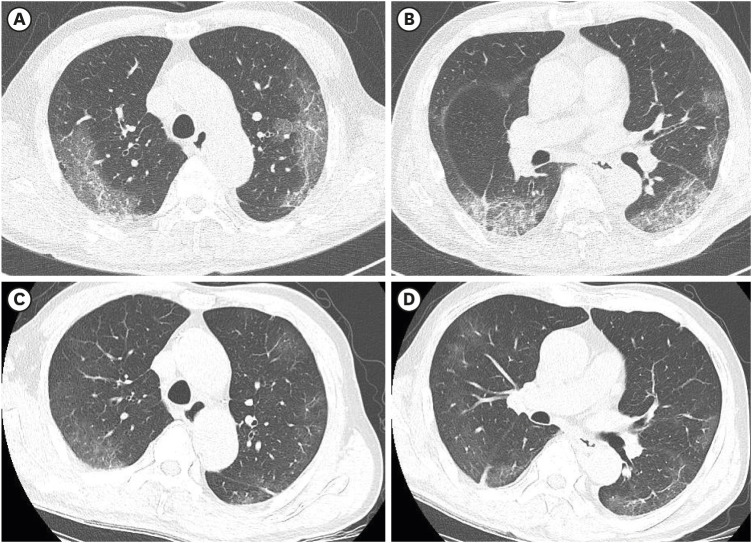
 | Fig. 2Coronavirus disease 2019 pneumonia with a diffuse alveolar damage pattern in a 72-year-old man. (A) Initial chest radiograph obtained 5 days after symptom onset showing bilateral diffuse ground glass opacities in both lungs. (B, C) Serial axial CT scans obtained on the same day as (A) showing bilateral diffuse ground-glass opacity with consolidation without specific zonal predominance in both lungs. Visual CT score and total extents of automatic measurement of lung parenchymal abnormalities on initial CT images were 24 and 47.8%, respectively. (D) Follow-up chest radiograph showing lesion progression. The patient died 14 days after chest radiograph.CT = computed tomography.
|
Table 4
CT findings of coronavirus disease 2019 pneumonia according to clinical severity
CT = computed tomography.
aResults are for a total of 226 patients (53 in the severe group and 173 in the mild group); bTotal extents of parenchymal abnormalities were analyzed in 245 patients.
Numbers in parentheses are percentages, unless specified otherwise.
![]()
Risk factors related to poor prognosis of patients with COVID-19 pneumonia
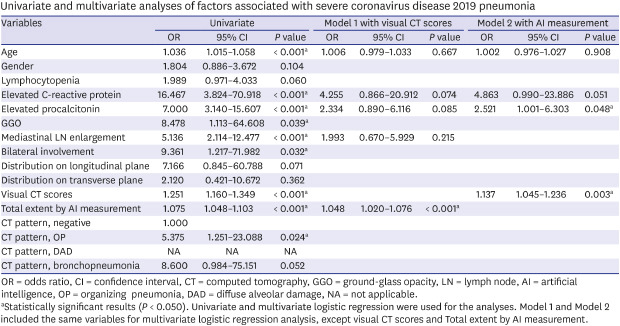
Univariate analyses showed older age, elevated CRP and procalcitonin levels, and CT findings including GGO, lymph node enlargement, bilateral involvement of parenchymal abnormalities, visual CT scores, and total extent by automatic measurement of lung parenchymal abnormalities were significant prognostic parameters. Multivariate logistic analysis with two models, which included visual CT scores and AI measurement, respectively, showed elevated CRP, elevated procalcitonin, visual CT scores, and AI measurement of lung parenchymal abnormalities were independently associated with a poorer prognosis for patients with COVID-19 pneumonia (Table 5). There was no significant difference of two models with results of area under the ROC curves: 0.8587 vs. 0.8645, P = 0.632 (Fig. 3).
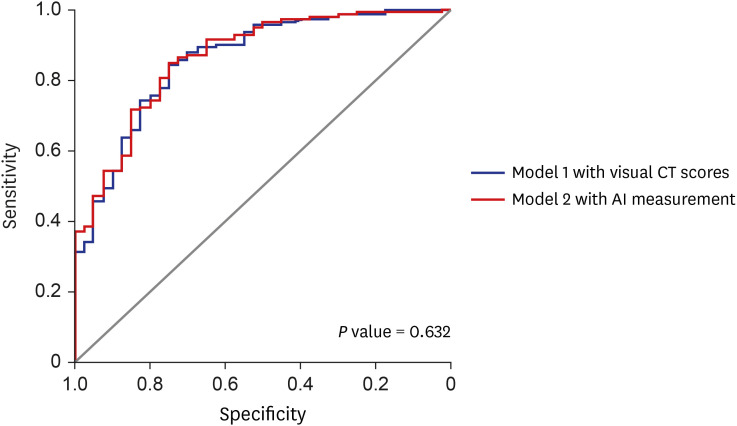 | Fig. 3Receiver operating characteristic analysis of the predictive modelsfor severe clinical course of coronavirus disease 2019 with visual CT scores and artificial intelligence measurement.CT = computed tomography.
|
Table 5
Univariate and multivariate analyses of factors associated with severe coronavirus disease 2019 pneumonia
OR = odds ratio, CI = confidence interval, CT = computed tomography, GGO = ground-glass opacity, LN = lymph node, AI = artificial intelligence, OP = organizing pneumonia, DAD = diffuse alveolar damage, NA = not applicable.
aStatistically significant results (P < 0.050). Univariate and multivariate logistic regression were used for the analyses. Model 1 and Model 2 included the same variables for multivariate logistic regression analysis, except visual CT scores and Total extent by AI measurement.
![]()
Go to :
DISCUSSION
The main results of this study are that GGO, consolidation, interstitial thickening, a crazy-paving appearance, mediastinal and hilar lymph node enlargement, visual CT scores and total extent by automatic measurement of lung parenchymal abnormalities, and the presence of a DAD pattern were significantly more prevalent in the severe clinical outcome group rather than in the mild group. An older age, lymphocytopenia, and inflammatory marker elevation were significantly more prevalent in the severe group, and elevated CRP and procalcitonin levels and visual CT scores were found to independently predict poorer outcomes. To the best of our knowledge, this is study is the first report to classify CT findings of COVID-19 pneumonia into CT patterns and to investigate the impacts of CT findings and their patterns on prognosis.
It has been reported multiple areas of patchy GGO and consolidation are common CT findings of COVID-19 pneumonia and these lesions are typically distributed in peribronchovascular or subpleural areas of both lungs.2345 These findings are consistent with our results and similar to those of severe acute respiratory syndrome (SARS) and Middle-East respiratory syndrome (MERS), which are both caused by coronavirus infection.1617181920 Bilateral subpleural and lower lung zone predominant GGO and consolidation were the most common findings in MERS and SARS. However, in the present study, lung abnormalities showed mainly lower lung (50%) and random involvement (46%) in the longitudinal plane and peripheral and peribronchovascular involvement (57%) in the transverse plane. In addition, parenchymal abnormalities were bilateral in most patients (75%) in our study, whereas initial parenchymal abnormalities were more frequently unilateral in MERS and SARS.21
In the present study, only seven patients had large or centrilobular nodules and no patient had a cavitary lesion. A few patients had pleural effusion or significant lymph node enlargement. Unlike other viral pneumonia types, poorly defined centrilobular nodules are rare in pneumonia caused by coronaviruses.22 It has been reported that CT patterns of pulmonary viral infection are related to their pathogeneses.23 Unlike respiratory syncytial virus or human parainfluenza virus pneumonia, which exhibit an airway-centered pattern of disease and result in cellular bronchiolitis,24 coronaviridae elicit direct lung injury or cell apoptosis and contribute to DAD.25 Thus, the common CT findings of pulmonary infection caused by coronaviridae are bilateral multifocal or extensive GGO and consolidation with subpleural predominance. In a recent study15 on 48 patients diagnosed with COVID-19 that underwent CT pulmonary angiography, it was reported that dilated vessels were evident in 85% of cases, dilated distal vessels extending to pleura were observed in 82%, and fissures were observed in (61%). In the present study, only 12 patients (5%) showed vascular enlargement, and 97% of the examinations were performed without contrast enhancement.
We divided patients into two groups according to clinical severity and compared their clinical and CT findings. Patients were older in the severe group (P < 0.001) and lymphocytopenia and elevated CRP and procalcitonin levels were more commonly observed in this group (Ps < 0.001). These findings were consistent with other previous studies that evaluated risk factors associated with acute respiratory distress syndrome in patients with COVID-19.11132627 Elevated CRP and procalcitonin levels in the severe group may have been associated with cytokine storms triggered by viral invasion or due to the presence of co-infections, as reported in a recent study.28
We compared CT features and patterns in severe and mild disease groups. GGO, consolidation, intralobular and interlobular interstitial thickening, a crazy-paving appearance, reticulation, traction bronchiectasis, air-bronchogram, and mediastinal and hilar lymph node enlargement were more frequently observed in the severe group. In addition, visual CT scores and total extent by automatic measurement of lung parenchymal abnormalities were higher in the severe group (Ps < 0.001). In a study of 228 COVID-19 patients that including 45 patients under intensive care,26 it was reported that a higher CT total score significantly predicted the need for invasive respiratory support, which concurs with our results. In another study conducted on 25 severe cases and 58 ordinary cases, CT scores were significantly higher in critical patients.13 This study used the same CT scoring system as our study and showed similar score values in mild and severe groups. The present study, which was conducted using a larger cohort than those used in previous studies,132629 shows that CT extent of lung parenchymal disease measured by visual scoring or AI measurement was significantly predicted prognosis in patients with COVID-19 pneumonia. We also found no significant difference in diagnostic accuracy between the prediction model using visual CT scoring and the model using AI measurement. Therefore, early CT evaluation may help predict the presence of features of severe or critical pneumonia requiring aggressive management.
DAD is a hallmark of patients with acute respiratory distress syndrome caused by infectious etiologies such as SARS, MERS, and influenza.3031 In our study, all patients with a DAD pattern were members of the severe group and we presumed that a DAD pattern presents a strong predictor of the severe clinical course of COVID-19. In our study, CT observed DAD patterns were only observed in the severe group. Kang et al. analyzed chest CT findings of influenza pneumonia and evaluated their relationships with clinical outcomes.7 They also classified CT patterns as bronchopneumonia, OP, or DAD and concluded that patients with DAD patterns tended to have poorer prognoses. On the other hand, in MERS, the number of involved lung segments predicts poorer prognosis.16 These findings are consistent with the results of our study.
The present study has several limitations that warrant consideration. First, the study is inherently limited by its retrospective design, and thus, by selection bias. In particular, we only included patients that underwent chest CT. Second, times between symptom onsets and CT scans varied, which would have affected CT patterns. For example, some of the DAD patterns observed may have been due to disease progression from initially mild disease patterns. However, we only included patients that underwent chest CT within 10 days of RT-PCR-based diagnosis. Third, the multicenter design meant that CT protocols and vendors varied.
In conclusion, the most common CT findings observed for COVID-19 pneumonia were GGO, consolidation, intralobular interstitial thickening, and a crazy-paving appearance with a bilateral, lower lung and peripheral and peribronchovascular predominance exhibiting patterns of bronchopneumonia, OP, or DAD. Older age and inflammatory marker elevations at an early stage were found to risk factors of a poor clinical outcome. If CT images show parenchyma lesions of a wide extent and DAD pattern, regardless of clinical risk factors, and the patient follows a severe clinical course a poor prognosis can be expected. Early CT findings can predict outcomes and improve prognoses by facilitating prompt, appropriate management.
Go to :
 XML Download