Journal List > J Korean Med Sci > v.36(7) > 1146444

Na, Park, Cho, Lee, Wang, and Park: Risk Factors for Intracranial Injury Caused by Falls at Home in Korea Using Data from the Emergency Department-based Injury In-depth Surveillance (2011–2018)

Abstract

Background

Most unintentional injuries that occur at home are preventable. However, it may be difficult to sufficiently reduce the number of falls occurring at home by only identifying risk factors focused on specific age groups. Therefore, this study aimed to identify the risk factors (especially age and places where injuries occurred at home) for intracranial injury (ICI) caused by unintentional falls at home.

Methods

Using the Emergency Department (ED)-Based Injury In-depth Surveillance, we analyzed the data of patients who visited the ED due to unintentional falls at home. Risk factors were identified using multivariable logistic regression according to age groups and interactions between place of injury occurrence and age groups, and sex and age groups were assessed.

Results

In total, 232,124 patients were included in the analysis; older adults had a higher adjusted odds ratio (aOR) 14.05 (95% confidence interval [CI], 12.74–15.49) of ICI than infants. The corridor was associated with ICI in the male pediatric group (aOR, 2.71; 95% CI, 1.08–6.84) and the balcony with the female pediatric group (aOR, 2.04; 95% CI, 1.03–4.04). In the adult group, aOR of kitchen was 1.38 (95% CI, 1.02–1.88) in females and 0.56 (95% CI, 0.48–0.66) in males.

Conclusion

In this study, we identified the risk factors of ICI caused by falls at home using ED-based injury surveillance data. The risk of ICI was different among places of occurrence in the home depending on the age groups and sex.

Graphical Abstract

jkms-36-e53-abf001.jpg

INTRODUCTION

Unintentional injuries pose a significant public health burden. According to Injury Facts, 167,127 deaths occurred due to unintentional injuries in the United States in 2018 alone, and at least half of these injuries occurred at home.1 Furthermore, injuries that occur at home are major contributors to the global disease burden; in Europe, approximately 110,000 deaths and 32,000,000 hospital admissions due to home- and leisure activity-related injuries were reported within one year.2 In addition, falls occurring at home are common,3 with one-third of all people aged > 65 being likely to experience at least one fall per year in their homes.4 Moreover, falls comprise 40% of all injury-related deaths and are a major cause of injury-related deaths among older individuals.56
It is well known that falls at home occur frequently in old age adults due to impaired balance, gait disturbance, and the use of multiple drugs.78 Children are also at risk of head injuries from falls at home,9 and studies focused on falls in children have shown specific risk factors, such as the mechanism of injury and triggering factors.10111213 However, most of the related research predominantly focused on older individuals or young children.
Unintentional falls occurring at home are largely considered preventable. To reduce falls, the factors that cause the falls must be examined from various aspects. In addition, it should be taken into account that falls occur through interactions of place and other factors, such as the people who are mainly active in the place, the duration of stay, the types of activities during stay, and other environmental factors. It may be difficult to reduce falls occurring at home sufficiently, by only identifying risk factors associated with specific groups, as done in previous studies,14 rather than focusing on the overall perspective. Therefore, this study aimed to identify the risk factors for intracranial injury (ICI) in patients of all ages who visited the emergency department (ED) due to falls at home. In particular, our intention was to consider the relationship between the place of occurrence, age, and sex.

METHODS

Study design and data source

This retrospective case-control study used data from the ED-based Injury In-depth Surveillance that was conducted by the Korea Centers for Disease Control and Prevention (KCDC). The KCDC established this surveillance in 2006 to build a national injury monitoring system for injury prevention and policy establishment.15 The database is based on the international classification of external causes of injuries proposed by the World Health Organization,1617 including patient demographics, injury-related information, clinical outcomes, diagnosis and treatment of ED, and patient outcomes. For the information about the severity of the injury, the Glasgow Coma Scale (GCS) and the excess mortality ratio-adjusted Injury Severity Score using the International Classification of Diseases 10th Edition (ICD-10) are recorded in the database.18 Primary surveillance data were collected in each ED by physicians and recorded in a web-based database system by trained research coordinators. The KCDC provides continuous training to researchers for the collection of high-quality data, and the project quality management committee reviews the data monthly to ensure quality.19

Study participants

Data on people admitted to the ED for unintentional falls that occurred at home between January 1, 2011, and December 31, 2018, were extracted, and patients with unknown place of occurrence at home were excluded.

Variables

The primary outcome of this study is ICI. ICI was defined as a case with an ICD-10 code of S06.1–S06.8 (traumatic cerebral edema, diffuse traumatic brain injury, focal traumatic brain injury, epidural hemorrhage, traumatic subdural hemorrhage, traumatic subarachnoid hemorrhage, other specified intracranial injuries).
The place of occurrence of an injury at home were classified as follows: bedroom, living room, bathroom, kitchen, balcony, stairs, and corridor. The patients were grouped based on age into the following groups: 0–1 year (infant group), 2–18 years (pediatric group), 19–64 years (adult group), and > 65 years (older age group). The time of injury was classified into the 6 am to 6 pm and 6 pm to 6 am groups. Further, the underlying objects producing injury were classified into the following categories: furniture; building, building component, such as walls, doors, and window; ground surface; objects, such as infant or child products, appliances mainly used in household, utensil or container, item mainly for personal use, equipment mainly used for sports/recreational activity, and tools and machines used for work-related activity; other causes were listed as “Others.”17 Fall included being pushed by a person and falling while being carried or tripping, and classified as: slip (falling by slipping on same level); on the stairs (falling on stairs/steps), falling from a height of less than 1 meter, falling from a height of 1 meter or more, and falling from an unspecified height.17 We also reviewed free texts regarding injury narratives and identified activities when injured and specific injury inducing factors. We classified the activities as: housework, and vital activities, including eating, drinking, resting, and walking.

Statistical analyses

The proportional differences were tested using the χ2 test for categorical variables. To identify the risk factors related to the occurrence of ICI, we performed univariable- and multivariable logistic regressions adjusted for age group, sex, place of occurrence, alcohol use, injury time, the underlying objects producing injury, and injury mechanism. Moreover, the interaction between the place of occurrence in the home and sex by each age group was assessed using multiplicative interaction terms. As the interaction between the location of injury and age groups was significant (P < 0.001), we also assessed association between place of occurrence and ICI stratified by age groups and sex. All statistical analyses were performed using SAS software, version 9.4 (SAS Institute Inc., Cary, NC, USA). P values were based on a two-tail significance level of 0.05.

Ethics statement

The Institutional Review Board (IRB) of Hallym University Dongtan Sacred Heart Hospital approved the study protocol (IRB No. HDT 2020-03-022). Informed consent was waived, and patient information was anonymized before the analysis.

RESULTS

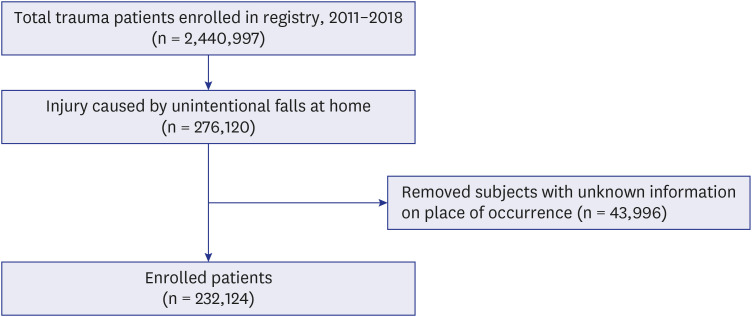
There were 276,120 patients who visited the ED due to unintentional falls at home between 2011 and 2018 (Fig. 1). After excluding patients with missing information, 232,124 patients were included in the final analysis.
Fig. 1

Study population.

jkms-36-e53-g001
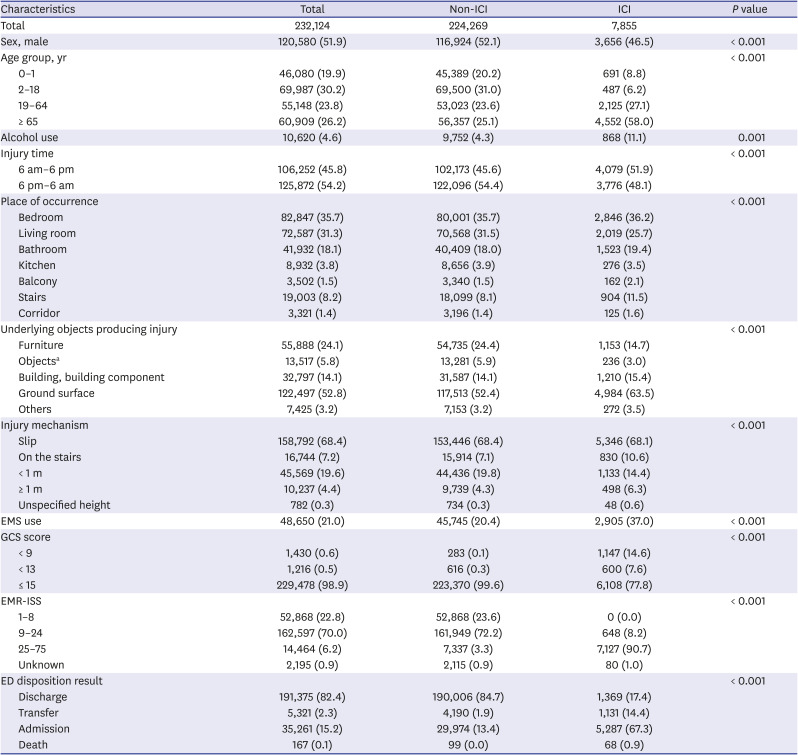
Of the 232,124 study subjects, approximately 3.4% (7,855) were diagnosed with ICI (Table 1). In the ICI group, the proportion of males was higher (53.5%) than of females, and the proportion of those aged ≥ 65 was the highest among the age groups (58.0%). In both the ICI and non-ICI groups, most injuries occurred in the bedroom; however, the proportion of injuries in the bathroom, stairs, and corridor was higher in the ICI group than in the non-ICI group (19.4%, 2.1%, 11.5%, and 1.6%, respectively); on the contrary, the proportion of injuries in the living room and kitchen was lower in the ICI group than in the non-ICI group (25.7%, 3.5%, respectively) (Table 1). By place of occurrence, the proportion of ICI was high on the stairs and balconies (Supplementary Table 1).
Table 1

Baseline characteristics of patients who visited the ED with injury resulting from unintentional falls at home stratified by non-ICI/ICI

jkms-36-e53-i001
Characteristics Total Non-ICI ICI P value
Total 232,124 224,269 7,855
Sex, male 120,580 (51.9) 116,924 (52.1) 3,656 (46.5) < 0.001
Age group, yr < 0.001
0–1 46,080 (19.9) 45,389 (20.2) 691 (8.8)
2–18 69,987 (30.2) 69,500 (31.0) 487 (6.2)
19–64 55,148 (23.8) 53,023 (23.6) 2,125 (27.1)
≥ 65 60,909 (26.2) 56,357 (25.1) 4,552 (58.0)
Alcohol use 10,620 (4.6) 9,752 (4.3) 868 (11.1) 0.001
Injury time < 0.001
6 am–6 pm 106,252 (45.8) 102,173 (45.6) 4,079 (51.9)
6 pm–6 am 125,872 (54.2) 122,096 (54.4) 3,776 (48.1)
Place of occurrence < 0.001
Bedroom 82,847 (35.7) 80,001 (35.7) 2,846 (36.2)
Living room 72,587 (31.3) 70,568 (31.5) 2,019 (25.7)
Bathroom 41,932 (18.1) 40,409 (18.0) 1,523 (19.4)
Kitchen 8,932 (3.8) 8,656 (3.9) 276 (3.5)
Balcony 3,502 (1.5) 3,340 (1.5) 162 (2.1)
Stairs 19,003 (8.2) 18,099 (8.1) 904 (11.5)
Corridor 3,321 (1.4) 3,196 (1.4) 125 (1.6)
Underlying objects producing injury < 0.001
Furniture 55,888 (24.1) 54,735 (24.4) 1,153 (14.7)
Objectsa 13,517 (5.8) 13,281 (5.9) 236 (3.0)
Building, building component 32,797 (14.1) 31,587 (14.1) 1,210 (15.4)
Ground surface 122,497 (52.8) 117,513 (52.4) 4,984 (63.5)
Others 7,425 (3.2) 7,153 (3.2) 272 (3.5)
Injury mechanism < 0.001
Slip 158,792 (68.4) 153,446 (68.4) 5,346 (68.1)
On the stairs 16,744 (7.2) 15,914 (7.1) 830 (10.6)
< 1 m 45,569 (19.6) 44,436 (19.8) 1,133 (14.4)
≥ 1 m 10,237 (4.4) 9,739 (4.3) 498 (6.3)
Unspecified height 782 (0.3) 734 (0.3) 48 (0.6)
EMS use 48,650 (21.0) 45,745 (20.4) 2,905 (37.0) < 0.001
GCS score < 0.001
< 9 1,430 (0.6) 283 (0.1) 1,147 (14.6)
< 13 1,216 (0.5) 616 (0.3) 600 (7.6)
≤ 15 229,478 (98.9) 223,370 (99.6) 6,108 (77.8)
EMR-ISS < 0.001
1–8 52,868 (22.8) 52,868 (23.6) 0 (0.0)
9–24 162,597 (70.0) 161,949 (72.2) 648 (8.2)
25–75 14,464 (6.2) 7,337 (3.3) 7,127 (90.7)
Unknown 2,195 (0.9) 2,115 (0.9) 80 (1.0)
ED disposition result < 0.001
Discharge 191,375 (82.4) 190,006 (84.7) 1,369 (17.4)
Transfer 5,321 (2.3) 4,190 (1.9) 1,131 (14.4)
Admission 35,261 (15.2) 29,974 (13.4) 5,287 (67.3)
Death 167 (0.1) 99 (0.0) 68 (0.9)
Data are presented as number (%).
ED = emergency department, ICI = intracranial injury, EMS = public emergency medical service, GCS = Glasgow Coma Scale, EMR-ISS = excess mortality ratio-adjusted Injury Severity Score.
aObjects include home appliances, infant or child products, utensil or container, item mainly for personal use, equipment mainly used for sports/recreational activity and tools or machines.
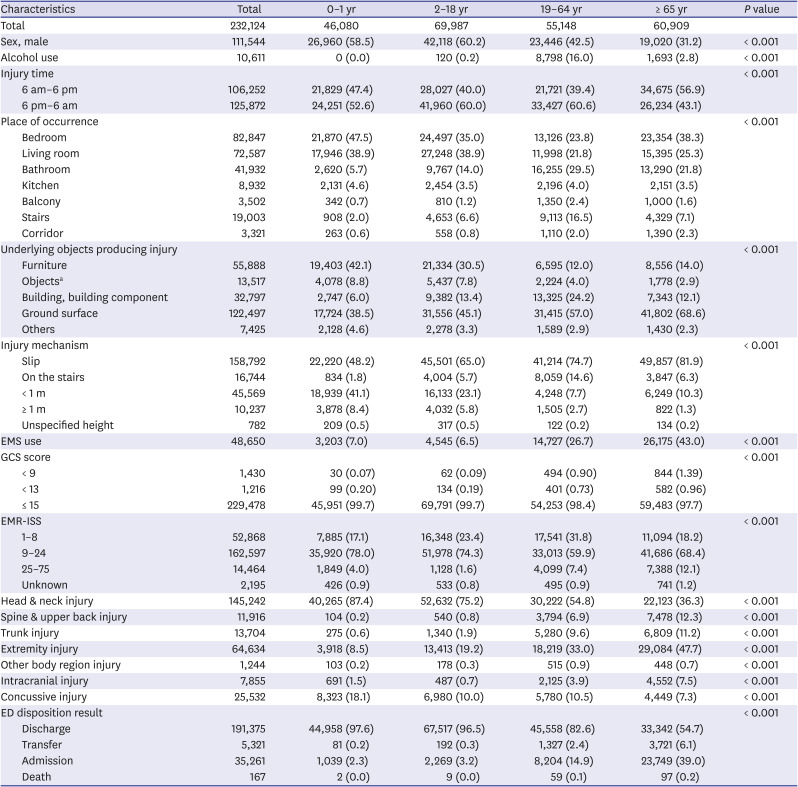
Table 2 shows the characteristics of head trauma patients due to unintentional falls at home by age groups. The proportion of males was higher in the infant and pediatric group (58.5% and 60.2%, respectively). In addition, there were differences by age group in the places of occurrence. Infants and the older age group had the most head trauma from falls in the bedroom, pediatric group in the living room, and adults in the bathroom. While the proportion of falls by slipping was the highest in all age groups, it was more pronounced in the older age group (81.9%). In the adult group, falls from the stairs were the second highest (14.6%), but in the rest of the group, falls from less than 1-m height were the second highest. After adjusting for sex, alcohol use, place of occurrence, injury time, underlying objects producing injury, and injury mechanism, the older age group has greater odds of ICI (adjusted odds ratio [aOR], 14.05; 95% confidence interval [CI], 12.74–32.08) (Supplementary Table 2).
Table 2

Baseline characteristics of patients who visited the ED with injury resulting from unintentional fall at home, stratified by age group

jkms-36-e53-i002
Characteristics Total 0–1 yr 2–18 yr 19–64 yr ≥ 65 yr P value
Total 232,124 46,080 69,987 55,148 60,909
Sex, male 111,544 26,960 (58.5) 42,118 (60.2) 23,446 (42.5) 19,020 (31.2) < 0.001
Alcohol use 10,611 0 (0.0) 120 (0.2) 8,798 (16.0) 1,693 (2.8) < 0.001
Injury time < 0.001
6 am–6 pm 106,252 21,829 (47.4) 28,027 (40.0) 21,721 (39.4) 34,675 (56.9)
6 pm–6 am 125,872 24,251 (52.6) 41,960 (60.0) 33,427 (60.6) 26,234 (43.1)
Place of occurrence < 0.001
Bedroom 82,847 21,870 (47.5) 24,497 (35.0) 13,126 (23.8) 23,354 (38.3)
Living room 72,587 17,946 (38.9) 27,248 (38.9) 11,998 (21.8) 15,395 (25.3)
Bathroom 41,932 2,620 (5.7) 9,767 (14.0) 16,255 (29.5) 13,290 (21.8)
Kitchen 8,932 2,131 (4.6) 2,454 (3.5) 2,196 (4.0) 2,151 (3.5)
Balcony 3,502 342 (0.7) 810 (1.2) 1,350 (2.4) 1,000 (1.6)
Stairs 19,003 908 (2.0) 4,653 (6.6) 9,113 (16.5) 4,329 (7.1)
Corridor 3,321 263 (0.6) 558 (0.8) 1,110 (2.0) 1,390 (2.3)
Underlying objects producing injury < 0.001
Furniture 55,888 19,403 (42.1) 21,334 (30.5) 6,595 (12.0) 8,556 (14.0)
Objectsa 13,517 4,078 (8.8) 5,437 (7.8) 2,224 (4.0) 1,778 (2.9)
Building, building component 32,797 2,747 (6.0) 9,382 (13.4) 13,325 (24.2) 7,343 (12.1)
Ground surface 122,497 17,724 (38.5) 31,556 (45.1) 31,415 (57.0) 41,802 (68.6)
Others 7,425 2,128 (4.6) 2,278 (3.3) 1,589 (2.9) 1,430 (2.3)
Injury mechanism < 0.001
Slip 158,792 22,220 (48.2) 45,501 (65.0) 41,214 (74.7) 49,857 (81.9)
On the stairs 16,744 834 (1.8) 4,004 (5.7) 8,059 (14.6) 3,847 (6.3)
< 1 m 45,569 18,939 (41.1) 16,133 (23.1) 4,248 (7.7) 6,249 (10.3)
≥ 1 m 10,237 3,878 (8.4) 4,032 (5.8) 1,505 (2.7) 822 (1.3)
Unspecified height 782 209 (0.5) 317 (0.5) 122 (0.2) 134 (0.2)
EMS use 48,650 3,203 (7.0) 4,545 (6.5) 14,727 (26.7) 26,175 (43.0) < 0.001
GCS score < 0.001
< 9 1,430 30 (0.07) 62 (0.09) 494 (0.90) 844 (1.39)
< 13 1,216 99 (0.20) 134 (0.19) 401 (0.73) 582 (0.96)
≤ 15 229,478 45,951 (99.7) 69,791 (99.7) 54,253 (98.4) 59,483 (97.7)
EMR-ISS < 0.001
1–8 52,868 7,885 (17.1) 16,348 (23.4) 17,541 (31.8) 11,094 (18.2)
9–24 162,597 35,920 (78.0) 51,978 (74.3) 33,013 (59.9) 41,686 (68.4)
25–75 14,464 1,849 (4.0) 1,128 (1.6) 4,099 (7.4) 7,388 (12.1)
Unknown 2,195 426 (0.9) 533 (0.8) 495 (0.9) 741 (1.2)
Head & neck injury 145,242 40,265 (87.4) 52,632 (75.2) 30,222 (54.8) 22,123 (36.3) < 0.001
Spine & upper back injury 11,916 104 (0.2) 540 (0.8) 3,794 (6.9) 7,478 (12.3) < 0.001
Trunk injury 13,704 275 (0.6) 1,340 (1.9) 5,280 (9.6) 6,809 (11.2) < 0.001
Extremity injury 64,634 3,918 (8.5) 13,413 (19.2) 18,219 (33.0) 29,084 (47.7) < 0.001
Other body region injury 1,244 103 (0.2) 178 (0.3) 515 (0.9) 448 (0.7) < 0.001
Intracranial injury 7,855 691 (1.5) 487 (0.7) 2,125 (3.9) 4,552 (7.5) < 0.001
Concussive injury 25,532 8,323 (18.1) 6,980 (10.0) 5,780 (10.5) 4,449 (7.3) < 0.001
ED disposition result < 0.001
Discharge 191,375 44,958 (97.6) 67,517 (96.5) 45,558 (82.6) 33,342 (54.7)
Transfer 5,321 81 (0.2) 192 (0.3) 1,327 (2.4) 3,721 (6.1)
Admission 35,261 1,039 (2.3) 2,269 (3.2) 8,204 (14.9) 23,749 (39.0)
Death 167 2 (0.0) 9 (0.0) 59 (0.1) 97 (0.2)
Data are presented as number (%).
ED = emergency department, EMS = public emergency medical service, GCS = Glasgow Coma Scale, EMR-ISS = excess mortality ratio-adjusted Injury Severity Score.
aObjects include home appliances, infant or child products, utensil or container, item mainly for personal use, equipment mainly used for sports/recreational activity and tools or machines.
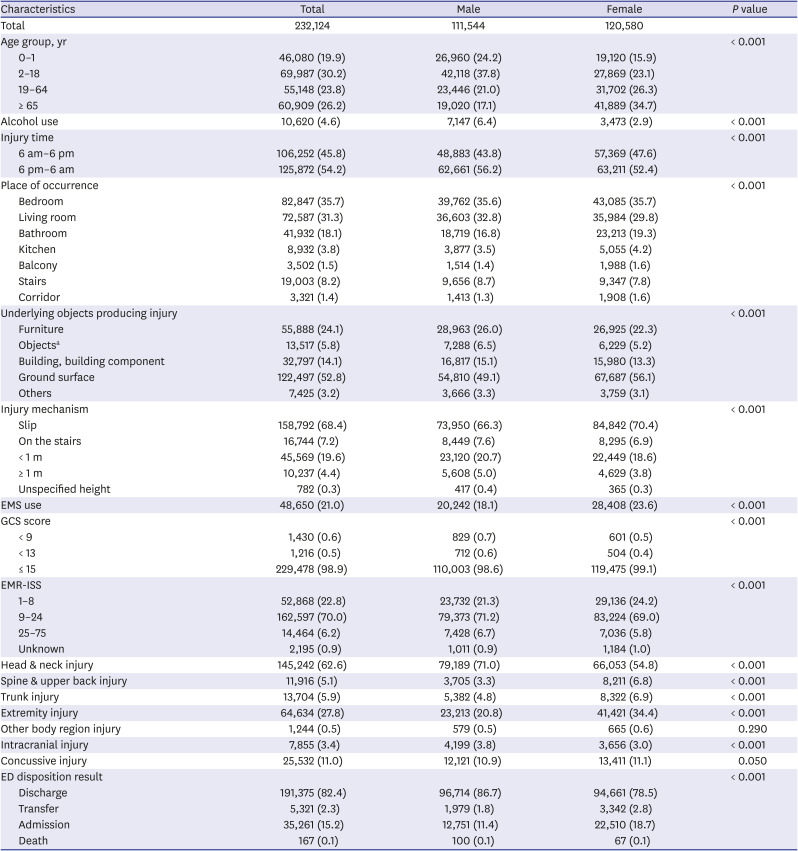
According to sex, there were differences in the proportion of injury in the age groups (Table 3). The proportion of injury was high among males in children (37.8%), and among females, in the older age group (34.7%). Males had higher proportion of falls in living rooms and stairs than females.
Table 3

Baseline characteristics of patients who visited the ED with injury resulting from unintentional falls at home stratified by sex

jkms-36-e53-i003
Characteristics Total Male Female P value
Total 232,124 111,544 120,580
Age group, yr < 0.001
0–1 46,080 (19.9) 26,960 (24.2) 19,120 (15.9)
2–18 69,987 (30.2) 42,118 (37.8) 27,869 (23.1)
19–64 55,148 (23.8) 23,446 (21.0) 31,702 (26.3)
≥ 65 60,909 (26.2) 19,020 (17.1) 41,889 (34.7)
Alcohol use 10,620 (4.6) 7,147 (6.4) 3,473 (2.9) < 0.001
Injury time < 0.001
6 am–6 pm 106,252 (45.8) 48,883 (43.8) 57,369 (47.6)
6 pm–6 am 125,872 (54.2) 62,661 (56.2) 63,211 (52.4)
Place of occurrence < 0.001
Bedroom 82,847 (35.7) 39,762 (35.6) 43,085 (35.7)
Living room 72,587 (31.3) 36,603 (32.8) 35,984 (29.8)
Bathroom 41,932 (18.1) 18,719 (16.8) 23,213 (19.3)
Kitchen 8,932 (3.8) 3,877 (3.5) 5,055 (4.2)
Balcony 3,502 (1.5) 1,514 (1.4) 1,988 (1.6)
Stairs 19,003 (8.2) 9,656 (8.7) 9,347 (7.8)
Corridor 3,321 (1.4) 1,413 (1.3) 1,908 (1.6)
Underlying objects producing injury < 0.001
Furniture 55,888 (24.1) 28,963 (26.0) 26,925 (22.3)
Objectsa 13,517 (5.8) 7,288 (6.5) 6,229 (5.2)
Building, building component 32,797 (14.1) 16,817 (15.1) 15,980 (13.3)
Ground surface 122,497 (52.8) 54,810 (49.1) 67,687 (56.1)
Others 7,425 (3.2) 3,666 (3.3) 3,759 (3.1)
Injury mechanism < 0.001
Slip 158,792 (68.4) 73,950 (66.3) 84,842 (70.4)
On the stairs 16,744 (7.2) 8,449 (7.6) 8,295 (6.9)
< 1 m 45,569 (19.6) 23,120 (20.7) 22,449 (18.6)
≥ 1 m 10,237 (4.4) 5,608 (5.0) 4,629 (3.8)
Unspecified height 782 (0.3) 417 (0.4) 365 (0.3)
EMS use 48,650 (21.0) 20,242 (18.1) 28,408 (23.6) < 0.001
GCS score < 0.001
< 9 1,430 (0.6) 829 (0.7) 601 (0.5)
< 13 1,216 (0.5) 712 (0.6) 504 (0.4)
≤ 15 229,478 (98.9) 110,003 (98.6) 119,475 (99.1)
EMR-ISS < 0.001
1–8 52,868 (22.8) 23,732 (21.3) 29,136 (24.2)
9–24 162,597 (70.0) 79,373 (71.2) 83,224 (69.0)
25–75 14,464 (6.2) 7,428 (6.7) 7,036 (5.8)
Unknown 2,195 (0.9) 1,011 (0.9) 1,184 (1.0)
Head & neck injury 145,242 (62.6) 79,189 (71.0) 66,053 (54.8) < 0.001
Spine & upper back injury 11,916 (5.1) 3,705 (3.3) 8,211 (6.8) < 0.001
Trunk injury 13,704 (5.9) 5,382 (4.8) 8,322 (6.9) < 0.001
Extremity injury 64,634 (27.8) 23,213 (20.8) 41,421 (34.4) < 0.001
Other body region injury 1,244 (0.5) 579 (0.5) 665 (0.6) 0.290
Intracranial injury 7,855 (3.4) 4,199 (3.8) 3,656 (3.0) < 0.001
Concussive injury 25,532 (11.0) 12,121 (10.9) 13,411 (11.1) 0.050
ED disposition result < 0.001
Discharge 191,375 (82.4) 96,714 (86.7) 94,661 (78.5)
Transfer 5,321 (2.3) 1,979 (1.8) 3,342 (2.8)
Admission 35,261 (15.2) 12,751 (11.4) 22,510 (18.7)
Death 167 (0.1) 100 (0.1) 67 (0.1)
Data are presented as number (%).
ED = emergency department, EMS = public emergency medical service, GCS = Glasgow Coma Scale, EMR-ISS = excess mortality ratio-adjusted Injury Severity Score.
aObjects include home appliances, infant or child products, utensil or container, item mainly for personal use, equipment mainly used for sports/recreational activity and tools or machines.
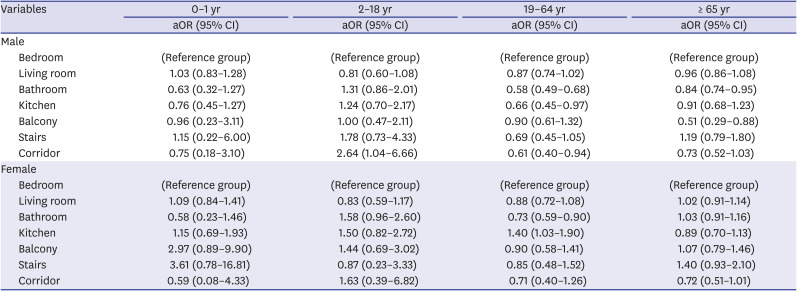
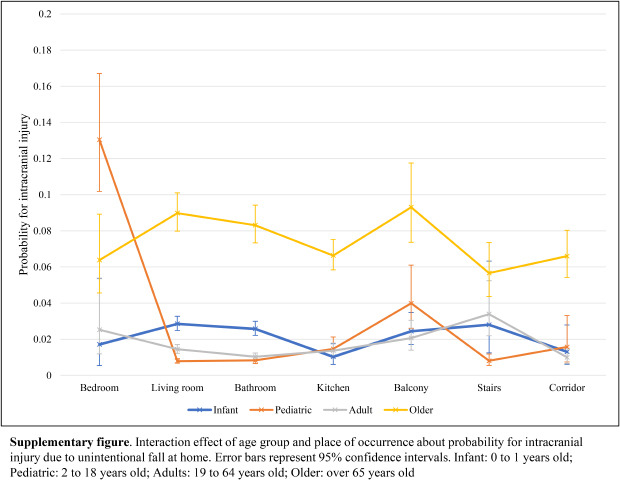
Table 4 shows the association between place of occurrence and ICI stratified by age group and sex (Table 4, Supplementary Table 3). In adult females, the risk of ICI was about 40% more likely in the kitchen than in the bedroom (aOR, 1.38; 95% CI, 1.02–1.88); however, a decreased risk of ICI in the kitchen was observed in adult males (aOR, 0.67; 95% CI, 0.46–0.98).
Table 4

Multivariable logistic regression analysis for association between place of occurrence and intracranial injury, stratified age groups and sex

jkms-36-e53-i004
Variables 0–1 yr 2–18 yr 19–64 yr ≥ 65 yr
aOR (95% CI) aOR (95% CI) aOR (95% CI) aOR (95% CI)
Male
Bedroom (Reference group) (Reference group) (Reference group) (Reference group)
Living room 1.03 (0.83–1.28) 0.81 (0.60–1.08) 0.87 (0.74–1.02) 0.96 (0.86–1.08)
Bathroom 0.63 (0.32–1.27) 1.31 (0.86–2.01) 0.58 (0.49–0.68) 0.84 (0.74–0.95)
Kitchen 0.76 (0.45–1.27) 1.24 (0.70–2.17) 0.66 (0.45–0.97) 0.91 (0.68–1.23)
Balcony 0.96 (0.23–3.11) 1.00 (0.47–2.11) 0.90 (0.61–1.32) 0.51 (0.29–0.88)
Stairs 1.15 (0.22–6.00) 1.78 (0.73–4.33) 0.69 (0.45–1.05) 1.19 (0.79–1.80)
Corridor 0.75 (0.18–3.10) 2.64 (1.04–6.66) 0.61 (0.40–0.94) 0.73 (0.52–1.03)
Female
Bedroom (Reference group) (Reference group) (Reference group) (Reference group)
Living room 1.09 (0.84–1.41) 0.83 (0.59–1.17) 0.88 (0.72–1.08) 1.02 (0.91–1.14)
Bathroom 0.58 (0.23–1.46) 1.58 (0.96–2.60) 0.73 (0.59–0.90) 1.03 (0.91–1.16)
Kitchen 1.15 (0.69–1.93) 1.50 (0.82–2.72) 1.40 (1.03–1.90) 0.89 (0.70–1.13)
Balcony 2.97 (0.89–9.90) 1.44 (0.69–3.02) 0.90 (0.58–1.41) 1.07 (0.79–1.46)
Stairs 3.61 (0.78–16.81) 0.87 (0.23–3.33) 0.85 (0.48–1.52) 1.40 (0.93–2.10)
Corridor 0.59 (0.08–4.33) 1.63 (0.39–6.82) 0.71 (0.40–1.26) 0.72 (0.51–1.01)
Models adjusted for alcohol intake status, injury time, underlying objects producing injury, and injury mechanism.
aOR = adjusted odds ratio, CI = confidence interval.
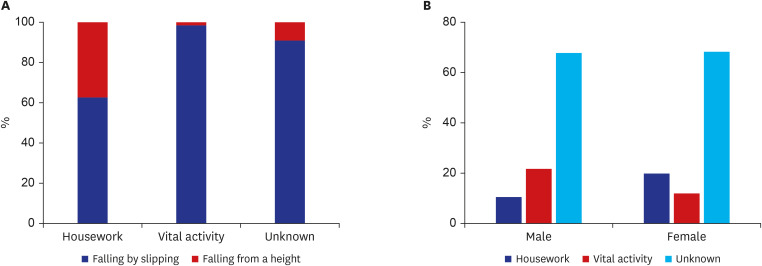
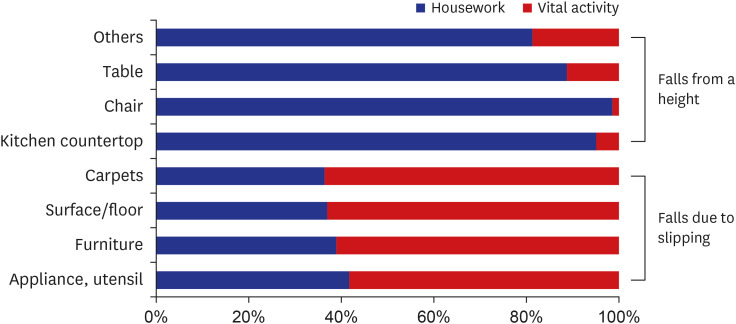
On investigating the activities in adult head trauma cases due to falls in the kitchen, the proportion of falls from a height was relatively high in housework (Fig. 2A). In Fig. 2B, females had a high proportion of falls from housework and males had a high proportion from vital activity. Excluding cases where detailed activities were not stated, we examined the specific injury inducing factors. It was found that climbing a kitchen countertop or a chair is the main injury inducing factor in housework, and in vital activity, it was found that there were many cases of slipping on appliances/utensils or furniture (Fig. 3).
Fig. 2

The activities in adult head trauma cases due to falls in the kitchen. Proportion of type of fall by activity at the time of injury (A) and proportion of activity at the time of injury by sex (B) among adults who were injured in the kitchen.

jkms-36-e53-g002
Fig. 3

Proportion of underlying objects producing injury by type of activity at the time of injury among adults who were injured in the kitchen.

jkms-36-e53-g003

DISCUSSION

In this study, we found that place of occurrence with a high risk of ICI differed according to the age group and sex. In the case of boys, the corridor was associated with ICI due to falls, and in the case of girls, it was the balcony. In addition, adult males showed a lower OR for ICI in the kitchen than in the bedroom, but adult females found that the kitchen was associated with ICI compared to the bedroom.
Most previous studies related to falls in the home targeted the elderly population; however, we identified the risky places for falls at home across all the age groups, which is a unique feature of this study. As in previous studies, the bedroom was the place where falls occurred most often in infants and older age group.202122 However, the proportion of falls in the living room or bathroom was higher than the bedroom in children and adults, indicating a difference in the frequency of falls, depending on time spent at a place. In particular, previous studies have reported the bathroom as a hazardous location for injury.2324 However, after adjusting for other variables, the probability of ICI occurring in the bathroom was lower than in the bedroom. That is probably because the bathroom had a high proportion of falls in adults and, unlike bedroom, falls by slipping accounted for more than 90%.
In the mechanism of injury by age group, the proportion of falls from < 1-m height in infants and children was higher than that of adults and the older. In addition, we found that the proportion of furniture among the underlying objects producing injury was high in young age groups. From these results, it can be inferred that factors such as the child climbing on the furniture or babies being dropped from beds were the main activities at the time of the fall.2526 In our study, children's ages were not subdivided; therefore, it was not possible to identify differences in activities according to developmental stages. However, a previous study has shown that the mechanism of injury changes as age increased in the order of “rolling or climbing,” “climbing, tripping, or running,” “running, jumping, and tripping.”26 Therefore, in a home with children, it is necessary to modify the home environment considering the developmental stages. Conversely, the occurrence of falls due to slipping is high in the older age group, probably associated with a decline in their physical ability.27 Therefore, not only environmental control but also physical exercise programs will be helpful for reducing falls in the older adults.
We also found that even in the same age group, male and female had different risks of injury from falls. Older females have been reported to be at a higher risk of falls at home,28 and it is also known that females are more likely to have non-fatal injuries from falls than males.29 In addition, one of the previous studies reported that females had greater fall rates in the kitchen than males.30 These findings are in accordance with our study. The difference between falls and their consequences, perhaps, reflects different trends in male and female regarding where and how they spend time. The main cause of the difference in associations between the falls in kitchen and ICI in adult males and females in our findings was the difference in the type of activity at the time of injury. It turns out that females spend more time in the kitchen for housework and often step on kitchen countertops and chairs to climb up. Therefore, to make kitchens safe, it is recommended to use safe steps when taking out things that are placed at heights, as well as seeking help from others, especially when there are physical restrictions.
Since a few studies have shown that different places at home have different risks of ICI from unintentional falls in different age groups and sex, our findings are meaningful. In a previous study, there was not enough evidence to determine the effects of interventions for modifying environmental hazards in the home.14 As most home modifications are structural and long-lasting, interventions should not be focused on individual occupants but rather, they should be designed to provide a safer home for all.31
As this study used ED-based registry, information regarding the socioeconomic levels of the residents and circumstantial details of the falls, such as the physical conditions of the patients, could not be obtained. In addition, there were many cases where detailed description of activity before the injury was missing; thus, this is one of the limitations of our analysis. Nevertheless, as such aspects could be risk factors for ICI due to falls at home,6 we propose to include these factors in the injury monitoring system. Also, the subjects of our study were those who visited the ED due to injury. Hence, there may be a bias that excludes not severely injured patients who are unlikely to visit the ED. For this reason, the characteristics of the injury caused by falls in the house shown in our study may be different from that of the general population.
In this study, we identified the risk factors of ICI caused by falls at home using ED-based injury surveillance data. The risk of ICI was different among places of occurrence in the home depending on the age groups and sex. Previous interventions focusing on specific target group were not effective, therefore, a new approach that considers the interaction of each risk factor is needed.

ACKNOWLEDGMENTS

The authors acknowledge all colleagues who participated in the in-depth surveillance of emergency department injury in Korea.

Notes

Funding: This research was supported by a research fund from the Korea Disease Control and Prevention Agency on 2020. This research was also supported by Hallym University Research Fund 2018 (HURF-2018-28).

Disclosure: The authors have no potential conflicts of interest to disclose.

Author Contributions:

  • Conceptualization: Park HA, Park JO.

  • Data curation: Na WI.

  • Formal analysis: Na WI, Park HA.

  • Funding acquisition: Cho GC, Park HA.

  • Investigation: Cho GC.

  • Methodology: Park HA, Park JO.

  • Supervision: Park HA.

  • Writing - original draft: Na WI.

  • Writing - review & editing: Park HA, Lee EJ, Wang SJ.

References

1. Injury Facts. All injuries: overview. Updated 2020. Accessed April 2020. https://injuryfacts.nsc.org/all-injuries/overview/.
2. Angermann A, Bauer R, Nossek G, Zimmermann N. Injuries in the European Union: Statistics Summary 2003–2005. Wien: Austrian Road Safety Board;2007.
3. Lord SR, Ward JA, Williams P, Anstey KJ. Physiological factors associated with falls in older community-dwelling women. J Am Geriatr Soc. 1994; 42(10):1110–1117. PMID: 7930338.
crossref pmid
4. Tinetti ME, Kumar C. The patient who falls: “It's always a trade-off”. JAMA. 2010; 303(3):258–266. PMID: 20085954.
5. Rubenstein LZ. Falls in older people: epidemiology, risk factors and strategies for prevention. Age Ageing. 2006; 35(Suppl 2):ii37–41. PMID: 16926202.
crossref
6. Division of Health Promotion and Disease Prevention, Institute of Medicine (US). Berg RL, Cassells JS. Falls in older persons: risk factors and prevention. The Second Fifty Years: Promoting Health and Preventing Disability. Washington, D.C.: National Academies Press (US);1992. p. 263–290.
7. Ambrose AF, Paul G, Hausdorff JM. Risk factors for falls among older adults: a review of the literature. Maturitas. 2013; 75(1):51–61. PMID: 23523272.
crossref pmid
8. Choi NG, Choi BY, DiNitto DM, Marti CN, Kunik ME. Fall-related emergency department visits and hospitalizations among community-dwelling older adults: examination of health problems and injury characteristics. BMC Geriatr. 2019; 19(1):303. PMID: 31711437.
crossref pmid pmc
9. Wadhwaniya S, Alonge O, Ul Baset MK, Chowdhury S, Bhuiyan AA, Hyder AA. Epidemiology of fall injury in rural Bangladesh. Int J Environ Res Public Health. 2017; 14(8):900.
crossref pmc
10. Harris VA, Rochette LM, Smith GA. Pediatric injuries attributable to falls from windows in the United States in 1990-2008. Pediatrics. 2011; 128(3):455–462. PMID: 21859909.
crossref pmid
11. Zielinski AE, Rochette LM, Smith GA. Stair-related injuries to young children treated in US emergency departments, 1999-2008. Pediatrics. 2012; 129(4):721–727. PMID: 22412031.
crossref pmid
12. Kendrick D, Maula A, Reading R, Hindmarch P, Coupland C, Watson M, et al. Risk and protective factors for falls from furniture in young children: multicenter case-control study. JAMA Pediatr. 2015; 169(2):145–153. PMID: 25436605.
pmid
13. Ibrahim NG, Wood J, Margulies SS, Christian CW. Influence of age and fall type on head injuries in infants and toddlers. Int J Dev Neurosci. 2012; 30(3):201–206. PMID: 22079853.
crossref pmid
14. Lyons RA, Sander LV, Weightman AL, Patterson J, Jones SA, Rolfe B, et al. Modification of the home environment for the reduction of injuries. Cochrane Database Syst Rev. 2003; (4):CD003600. PMID: 14583986.
crossref
15. Ahn SH, Seo SH, Kim BA, Lee KE, Kim YT. Emergency department-based injury in-depth surveillance data, 2006-2015. Public Health Wkly Rep. 2016; 9(33):650–654.
16. Park GJ, Shin J, Kim SC, Na DS, Lee HJ, Kim H, et al. Protective effect of helmet use on cervical injury in motorcycle crashes: a case-control study. Injury. 2019; 50(3):657–662. PMID: 30765183.
crossref
17. ICECI Coordination and Maintenance Group. International Classification of External Causes of Injuries (ICECI) version 1.2. Updated 2004. Accessed April 1, 2020. https://www.whofic.nl/sites/default/files/2018-05/ICECI%20in%20English.pdf.
18. Kim J, Shin SD, Im TH, Lee KJ, Ko SB, Park JO, et al. Development and validation of the excess mortality ratio-adjusted injury severity score using the International Classification of Diseases 10th Edition. Acad Emerg Med. 2009; 16(5):454–464. PMID: 19388920.
crossref pmid
19. Park JM, Park YS, Park I, Kim MJ, Kim KH, Park J, et al. Characteristics of burn injuries among children aged under six years in South Korea: Data from the Emergency Department-Based Injury In-Depth Surveillance, 2011-2016. PLoS One. 2018; 13(6):e0198195. PMID: 29883475.
crossref
20. Campbell AJ, Borrie MJ, Spears GF, Jackson SL, Brown JS, Fitzgerald JL. Circumstances and consequences of falls experienced by a community population 70 years and over during a prospective study. Age Ageing. 1990; 19(2):136–141. PMID: 2337010.
crossref pmid
21. Ngamsangiam P, Suttanon P. Risk factors for falls among community-dwelling elderly people in Asia: a systematic review. Sci Technol Asia. 2020; 25(3):105–126.
22. Stevens JA, Mahoney JE, Ehrenreich H. Circumstances and outcomes of falls among high risk community-dwelling older adults. Inj Epidemiol. 2014; 1(1):5. PMID: 27747670.
crossref pmid pmc
23. Gillespie LD, Robertson MC, Gillespie WJ, Sherrington C, Gates S, Clemson LM, et al. Interventions for preventing falls in older people living in the community. Cochrane Database Syst Rev. 2012; (9):CD007146. PMID: 22972103.
crossref
24. Stevens JA, Haas EN, Haileyesus T. Nonfatal bathroom injuries among persons aged ≥15 years--United States, 2008. J Safety Res. 2011; 42(4):311–315. PMID: 22017838.
pmid
25. Gaw CE, Chounthirath T, Smith GA. Nursery product-related injuries treated in United States emergency departments. Pediatrics. 2017; 139(4):e20162503. PMID: 28289137.
crossref
26. Haarbauer-Krupa J, Haileyesus T, Gilchrist J, Mack KA, Law CS, Joseph A. Fall-related traumatic brain injury in children ages 0-4 years. J Safety Res. 2019; 70:127–133. PMID: 31847987.
crossref pmid pmc
27. Latham NK, Anderson CS, Lee A, Bennett DA, Moseley A, Cameron ID, et al. A randomized, controlled trial of quadriceps resistance exercise and vitamin D in frail older people: the Frailty Interventions Trial in Elderly Subjects (FITNESS). J Am Geriatr Soc. 2003; 51(3):291–299. PMID: 12588571.
crossref pmid
28. Nordell E, Jarnlo GB, Jetsén C, Nordström L, Thorngren KG. Accidental falls and related fractures in 65-74 year olds: a retrospective study of 332 patients. Acta Orthop Scand. 2000; 71(2):175–179. PMID: 10852324.
crossref pmid
29. World Health Organization. Falls. Updated 2018. Accessed June 19, 2020. https://www.who.int/news-room/fact-sheets/detail/falls.
30. Duckham RL, Procter-Gray E, Hannan MT, Leveille SG, Lipsitz LA, Li W. Sex differences in circumstances and consequences of outdoor and indoor falls in older adults in the MOBILIZE Boston cohort study. BMC Geriatr. 2013; 13(1):133. PMID: 24313971.
crossref pmid pmc
31. Keall MD, Pierse N, Howden-Chapman P, Cunningham C, Cunningham M, Guria J, et al. Home modifications to reduce injuries from falls in the home injury prevention intervention (HIPI) study: a cluster-randomised controlled trial. Lancet. 2015; 385(9964):231–238. PMID: 25255696.
crossref

SUPPLEMENTARY MATERIALS

Supplementary Table 1

Demographics of participants with injury resulting from unintentional falls at home stratified by the place of occurrence
jkms-36-e53-s001.doc

Supplementary Table 2

Logistic regression models for intracranial injury
jkms-36-e53-s002.doc

Supplementary Table 3

Place of occurrence with injury resulting from unintentional falls at home, stratified age groups and sex
jkms-36-e53-s003.doc
TOOLS
Similar articles