

 PDF
PDF Citation
 Print
Print


INTRODUCTION
Coronary physiologic assessment by fractional flow reserve (FFR) or instantaneous wave-free ratio (iFR) has become a standard method for identifying the ischemia causing coronary stenosis in the cardiac catheterization laboratory.1) Despite the class IA recommendation of the measurement of FFR or iFR in the current guideline, real-world use is generally low and heterogeneous in different hospitals.2)3) Recently, the clinical application of computational fluid dynamics or mathematical assumptions has enabled the combination of data between coronary anatomy from imaging modalities and coronary physiology.4)5) Quantitative flow ratio (QFR) is one such modality which provides a 3-dimensional (3D) quantitative coronary angiography (QCA)-based FFR that can determine the hemodynamically significant lesion without pressure wire or hyperemia induction.5) Previous studies demonstrated its excellent diagnostic agreement with invasively-measured physiologic indices.5)6)7)8)9)10)11) However, it should be noted that iFR and FFR are measured during resting and hyperemic status, respectively, while QFR uses a simulated hyperemic status of coronary circulation based on anatomical stenosis severity. In addition, no previous studies have investigated the association of QFR with positron emission tomography (PET)-derived hemodynamic indices in comparison with FFR and iFR.
In this regard, this study was conducted to investigate the association of QFR with different degrees of anatomic and hemodynamic lesion severity, and the diagnostic performance of QFR to predict PET-defined myocardial ischemia in comparison with FFR and iFR.
METHODS
Study population
The current study included the patients with available 13N-ammonia PET within 3 months of invasive physiologic assessment.12) There was no intervention nor clinical event during the time between the PET scan and angiography/pressure measurement. Among a total of 144 patients, 15 patients with poor PET image quality, 2 patients without adequate coronary angiography data and 2 patients who underwent coronary bypass graft surgery were excluded. Patients with insufficient image quality for QFR analysis (calibration failure, ostial disease, insufficient projections, tortuous vessels, vessel overlap, or poor contrast filling) were also excluded and the specific reasons are presented in Supplementary Figure 1. Finally, 109 patients with 185 vessels were analyzed in this study. 3D QCA and analysis of QFR were retrospectively performed by an experienced analyst. The study protocol was approved by the ethics committee at Seoul National University Hospital (IRB No. H-1106-004-364) and was conducted in accordance with the Declaration of Helsinki.
13N-ammonia positron emission tomography protocol and quantification of myocardial blood flow and physiologic indices
All 13N-ammonia PET images were acquired during resting and hyperemic states by continuous intravenous infusion of adenosine (140 µg·kg−1·min−1) as previously described.13) A bolus of 13N-ammonium (370 MBq) was injected via a peripheral vein in both resting and hyperemic states, and list mode dynamic imaging was performed with a Siemens Biograph-40 PET/computed tomography scanner (Siemens Medical Solutions, Erlangen, Germany).14) A 2-compartment model was applied to quantify absolute myocardial blood flow (MBF, mL/min/g). The absolute MBF and physiological indices of a target segment were calculated from PET scan data.14) For image analysis and quantification of resting and stress absolute MBF in milliliters per minute per gram of tissue image acquisition, Carimas software (Turku PET Center, Turku, Finland) was used. Parametric stress MBF polar maps were used to delineate defect areas in target myocardial territories and to obtain MBF values of target segments. PET-derived coronary flow reserve (CFR) was calculated as the ratio of hyperemic MBF to resting MBF in target segments.15) Relative flow reserve (RFR) was calculated as the ratio of stress MBF in target myocardial segments to that of reference myocardial segments.16) To compare the diagnostic performance of pressure-derived physiologic indices, CFR <2.0 and RFR ≤0.80 were used as reference ischemic standards. Coronary flow capacity (CFC) was defined as flow capacity combining maximum absolute MBF and CFR,17) and ischemic cut-off values of 2.0 for CFR and 1.85 mL/min/g for stress MBF were used to define the presence of myocardial ischemia.18) Hyperemic stenosis resistance (HSR) was calculated as mean stenosis pressure gradient divided by hyperemic MBF.
Offline computation of quantitative flow ratio
3D QCA and analysis of QFR were performed by an experienced analyst (AngioPlus; Pulse Medical Imaging Technology, Shanghai Co., Ltd., Shanghai, China) from an independent core laboratory at Zhongshan Hospital, Fudan University in a blinded fashion as previously described.5) Briefly, end-diastolic frames of 2 optimal angiography projections, which were separated with angles of at least 25°, were selected and used for 3D model reconstruction. The 3D contour model of the segment of interest and its reference vessel were constructed in an automated manner and manual correction of contour was performed, if necessary. After acquisition of fixed QFR, estimated contrast coronary flow was calculated using thrombolysis in myocardial infarction (TIMI) frame-count adjustment, which indicated the frames where contrast entered and exited the segmented part of the vessel. With application of TIMI frame-count adjustment in the calculation method, the software automatically calculated the contrast QFR value. The ischemic cut-off value of contrast QFR ≤0.80 was used in the current study.
Invasive coronary angiography and measurement of physiological indices
Coronary angiography was performed with standard techniques. Angiographic views were obtained after the administration of intracoronary nitrate (100 or 200 µg). All angiograms were analyzed at a core laboratory (Seoul National University Hospital) by investigators blinded to other data. Two-dimensional (2D) QCA was performed using a validated software (CAAS II; Pie Medical System, Mastricht, Netherlands). Minimal lumen diameter, reference vessel size, and lesion length were measured, and percent diameter stenosis (%DS) was calculated.
All coronary physiological measurements were obtained after diagnostic angiography as previously described. Briefly, a 5F to 7F guide catheter was used to engage the coronary artery (Supplementary Table 1). A pressure-temperature sensor guide wire (Abbott Vascular, Santa Clara, CA, USA) was zeroed and equalized to aortic pressure, and then the pressure sensor was positioned at the distal segment of a target vessel. Intracoronary nitrate (100 or 200 µg) was administered before each physiological measurement. Continuous infusion of adenosine (140 µg·kg−1·min−1) was used to induce hyperemia. FFR was calculated as the mean distal coronary artery pressure/aortic pressure during hyperemia. All pressure data were collected and validated by investigators blinded to other data. iFR was calculated as the mean pressure distal to the stenosis divided by the mean aortic pressure during the diastolic wave-free period. Baseline tracing data of >5 heartbeats before adenosine infusion was extracted and then anonymized and coded as an ASCII text file. Those data were sent to the iFR core laboratory (Imperial College, London, UK), where iFR was calculated with fully automated algorithms acting over the wave-free period of a minimum of 5 beats.19)
Statistical analysis
Categorical variables were presented as numbers and relative frequencies. Continuous variables were presented as mean±standard deviation or median with interquartile range according to their distributions, which were checked by the Kolmogorov-Smirnov test. The Kruskal-Wallis test was used for comparison of continuous variables among the groups. Spearman correlation coefficients were calculated to evaluate the correlations among pressure physiologic indices, and polynomial regression was used to visualize the relationships between them. The Fisher r- to z-transformation was used to compare the difference between correlation coefficients.
The area under curve (AUC) was calculated from receiver operating characteristic (ROC) curve analysis and compared using with the DeLong method.20) Diagnostic performance of pressure-derived physiological indices was presented with sensitivity, specificity, positive predictive value, negative predictive value, and diagnostic accuracy. They were compared using McNemar test (sensitivity, specificity, and accuracy) or weight generalized score statistic (positive predictive value and negative predictive value).
All probability values were 2-sided, and p value <0.05 was considered statistically significant. The statistical package R, version 3.4.3 (R Foundation for Statistical Computing, Vienna, Austria) was used for statistical analysis.
RESULTS
Patient and lesion characteristics
Baseline patient and lesion characteristics are presented in Table 1. The mean age was 64.3±9.0 years, and 95 patients (87.2%) were male. Mean % diameter stenosis from QCA, FFR, iFR, and QFR were 46.4±16.2%, 0.83±0.11, 0.92±0.12 and 0.84±0.13, respectively. The distributions of angiographic and physiologic indices are shown in Supplementary Figure 2. PET-derived RFR and CFR were 0.83±0.11 and 2.3±0.7, respectively.
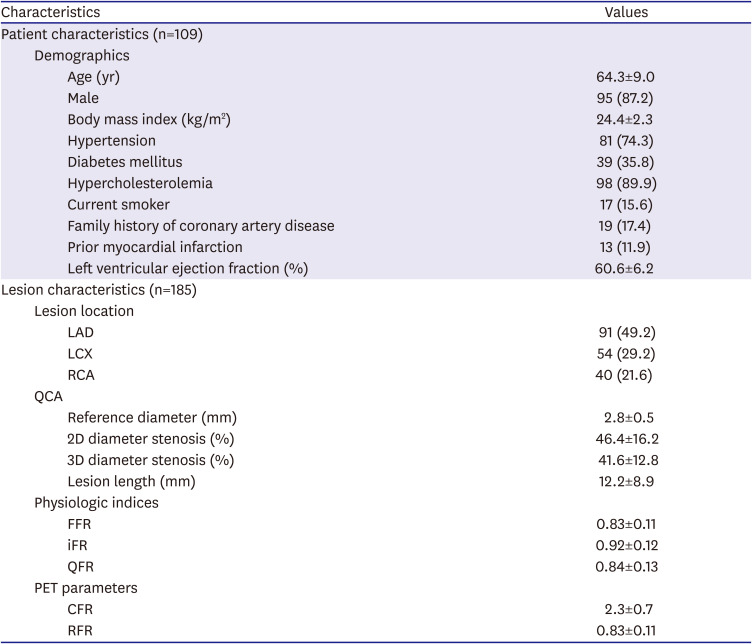
Table 1
Baseline patient and lesion characteristics
Values are expressed as mean±standard deviation or number (%).
2D = 2-dimensional; 3D = 3-dimensional; CFR = coronary flow reserve; FFR = fractional flow reserve; LAD = left anterior descending artery; iFR = instantaneous wave-free ratio; LCX = left circumflex artery; PET = positron emission tomography; QCA = quantitative coronary angiography; QFR = quantitative flow ratio; RCA = right coronary artery; RFR = relative flow reserve.
![]()
Relationship between pressured-derived physiologic indices and stenosis severity
Figure 1 shows the correlations between pressured-derived physiological indices and anatomical stenosis severity. All 3 indices showed significant negative correlations with 2D %DS from QCA and 3D %DS from QFR analysis (all p values <0.001), while higher values of correlations were observed with 3D %DS than with 2D %DS. QFR showed higher correlations with %DS than FFR or iFR (all p values for comparison<0.05). All pressure-derived physiologic indices decreased along with the increase of hemodynamic stenosis severity such as RFR, CFR, stress MBF, and HSR (Figure 2 and Supplementary Table 2). The degree of correlation was lower in QFR than that in FFR for RFR (0.655 vs. 0.786, p=0.008) and HSR (−0.797 vs. −0.950, p<0.001) (Supplementary Figure 3 and Supplementary Table 3).
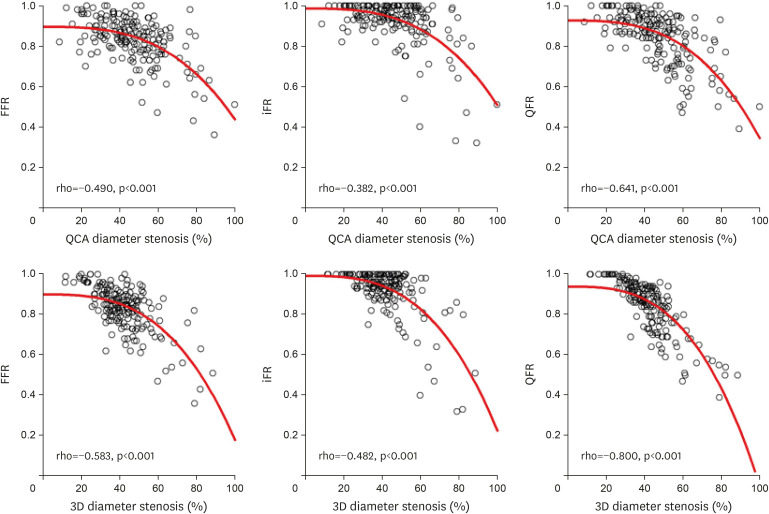
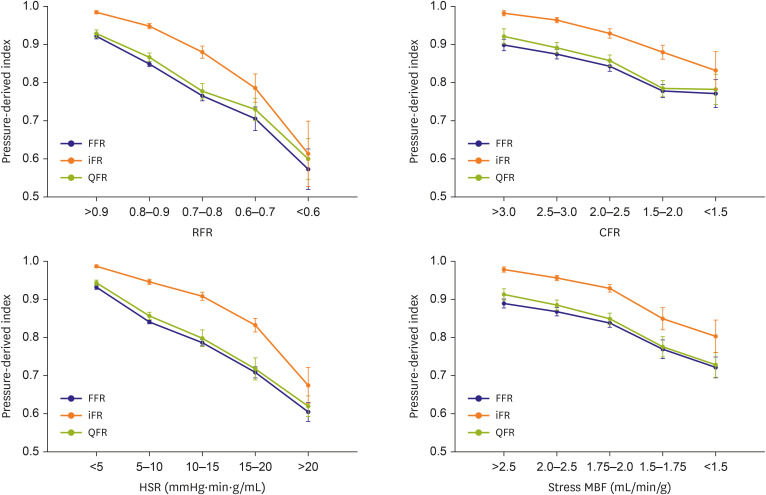
Figure 1
Correlations between angiographic severity and pressure-derived physiologic indices.
Correlations between 2D and 3D %DS and FFR, iFR and QFR are shown. There were significant correlations between 2D %DS and FFR, iFR and QFR, as well as 3D %DS and FFR, iFR and QFR. Redline was drawn using polynomial regression.
2D = 2-dimensional; 3D = 3-dimensional; FFR = fractional flow reserve; iFR = instantaneous wave-free ratio; %DS = percent diameter stenosis; QCA = quantitative coronary angiography; QFR = quantitative flow ratio.
![]()
Figure 2
Pressure-derived physiologic indices according to hemodynamic severity groups.
This figure shows the values of FFR, iFR, and QFR, according to RFR, CFR, HSR and stress MBF. Solid circle and error bar mean the mean value and standard error, respectively.
FFR = fractional flow reserve; iFR = instantaneous wave-free ratio; RFR = relative flow reserve; CFR = coronary flow reserve; HSR = hyperemic stenosis resistance; MBF = myocardial blood flow; QFR = quantitative flow ratio.
![]()
Diagnostic ability of quantitative flow ratio to predict positron emission tomography-defined myocardial ischemia
Table 2 and Supplementary Figure 4 show the diagnostic performance of FFR, iFR and QFR against PET-derived RFR, CFR and CFC. With RFR as a reference standard, QFR showed lower sensitivity (58.5%) than FFR (70.8%, p value for comparison=0.011) and lower specificity (85.8%) than iFR (96.6%, p value for comparison=0.002), leading to the lower overall diagnostic accuracy of QFR (76.2%) than that of FFR (83.2%, p value for comparison=0.021) and iFR (84.3%, p value for comparison=0.031). With CFR as a reference, QFR showed lower specificity (80.7%) than iFR (89.6%, p valeu for comparison=0.013), but overall diagnostic accuracies of QFR, FFR and iFR were comparable. With CFC as a reference standard, QFR showed lower sensitivity (58.5%) than FFR (75.6%, p value for comparison=0.008) and lower specificity (78.5%) than iFR (87.1%, p value for comparison=0.008). The overall diagnostic accuracy of QFR (74.1%) was lower than that of iFR (82.0%, p value for comparison=0.031) against CFC.
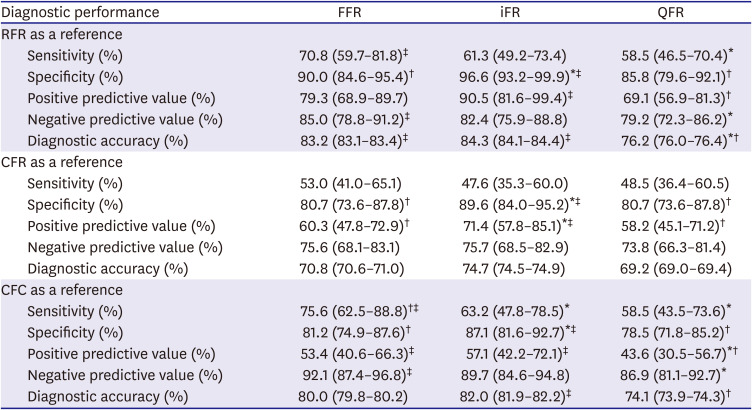
Table 2
Comparison of diagnostic performance of FFR, iFR, and QFR against PET-derived indices
CFC = coronary flow capacity; CFR = coronary flow reserve; FFR = fractional flow reserve; iFR = instantaneous wave-free ratio; PET = positron emission tomography; QFR = quantitative flow ratio; RFR = relative flow reserve.
*p<0.05 compared with FFR; †p<0.05 compared with iFR; ‡p<0.05 compared with QFR.
![]()
The discriminant functions of QFR compared to FFR or iFR are shown in Figure 3. With RFR as a reference standard, the AUCs of FFR, iFR, and QFR were 0.899, 0.895 and 0.826, respectively. With CFC as a reference, the AUCs of FFR, iFR, and QFR were 0.788, 0.789 and 0.737, respectively. There was a significant difference only between FFR and QFR with both RFR and CFC as reference standards. With RFR as a reference, QFR showed a trend of lower discriminant function than iFR. There was no difference among AUCs of these 3 indices for CFR.
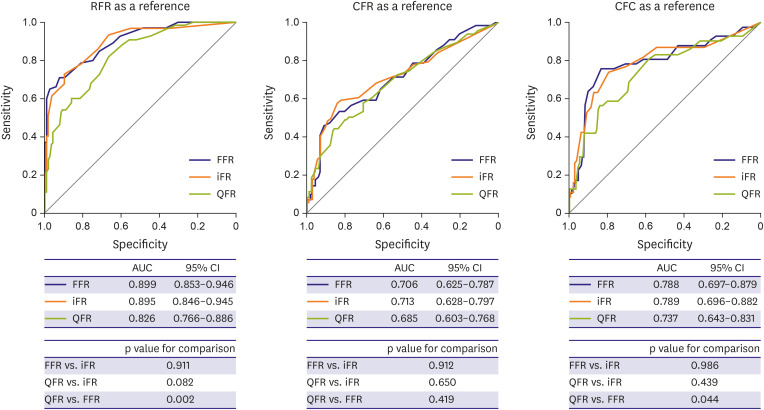
Figure 3
Discriminant functions of QFR, FFR and iFR against PET-derived indices.
Comparison of ROC curves of FFR, iFR, and QFR to predict RFR, CFR, and CFC are shown and AUCs are presented.
AUC = area under curve; CFC = coronary flow capacity; CFR = coronary flow reserve; CI = confidence interval; FFR = fractional flow reserve; iFR = instantaneous wave-free ratio; PET = positron emission tomography; QFR = quantitative flow ratio; RFR = relative flow reserve; ROC = receiver operating characteristic.
![]()
The diagnostic abilities of QFR in terms of diagnostic performance and discriminant function compared to FFR or iFR showed similar trends regardless of the target vessel location (Supplementary Figures 5 and 6 and Supplementary Tables 4 and 5). In addition, QFR showed high diagnostic performance to define myocardial ischemia in vessels which showed concordance results of pressure-derived and PET-derived indices (Supplementary Table 6).
Discordance between quantitative flow ratio and fractional flow reserve or instantaneous wave-free ratio
QFR showed significant correlations with FFR (ρ=0.820, p<0.001) and iFR (ρ=0.742, p<0.001) and 14.6% showed discordant results between QFR and FFR or iFR (Supplementary Figure 7). The anatomic and physiologic parameters in each accordant and discordant group are summarized in Figure 4 and Tables 3 and 4. In both high FFR (A and B) and low FFR groups (C and D), there were differences in 2D and 3D %DS in high and low QFR groups (A vs. B, C vs. D). This finding was consistent with iFR and QFR comparisons. In contrast, PET-derived hemodynamic parameters showed different distribution patterns. For FFR-QFR comparison, there were no differences in RFR, CFR and hyperemic MBF between high and low QFR groups (A vs. B or C vs. D) in both high FFR and low FFR groups. For QFR and iFR comparison, the distribution of PET-derived hemodynamic parameters was similar except for stress MBF (Figure 4).
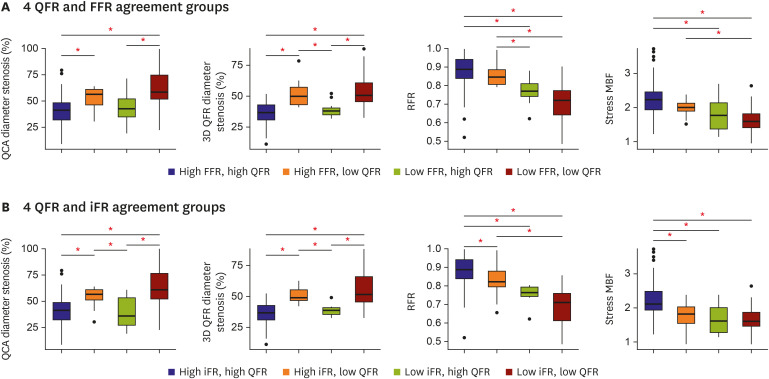
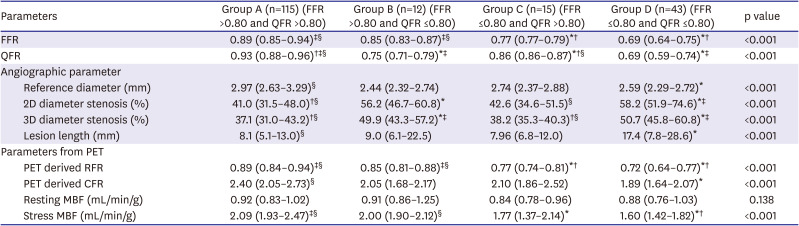
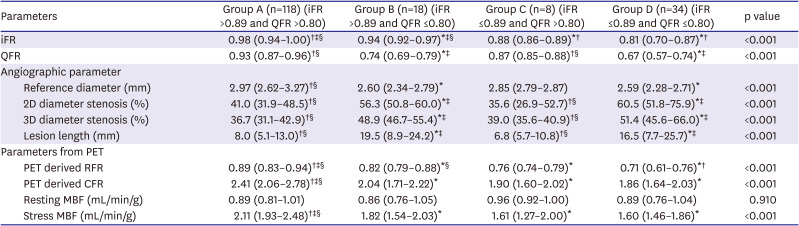
Figure 4
Anatomical and physiological severity according to QFR and FFR or iFR agreement.
The different distribution patterns of stenosis severity indices are shown in QFR and FFR agreement groups (A) and QFR and iFR agreement groups (B). The red star means a p value of <0.05. Each box ranges from upper quartile to lower quartile of the parameters and line inside the box indicates the location of the median value. The whiskers expand from the box to upper (upper quartile + 1.5×IQR) and lower (lower quartile − 1.5×IQR) extreme and outliers are plotted as individual dots.
FFR = fractional flow reserve; iFR = instantaneous wave-free ratio; IQR = interquartile range; QCA = quantitative coronary angiography; QFR = quantitative flow ratio.
![]()
Table 3
Physiologic and angiographic differences in patients among 4 FFR and QFR agreement groups
2D = 2-dimensional; 3D = 3-dimensional; CFR = coronary flow reserve; FFR = fractional flow reserve; PET = positron emission tomography; MBF = myocardial blood flow; QFR = quantitative flow ratio; RFR = relative flow reserve.
*p<0.05 compared with group A; †p<0.05 compared with group B; ‡p<0.05 compared with group C; §p<0.05 compared with group D.
![]()
Table 4
Physiologic and angiographic differences in patients among 4 iFR and QFR agreement groups
2D = 2-dimensional; 3D = 3-dimensional; CFR = coronary flow reserve; iFR = instantaneous wave-free ratio; PET = positron emission tomography; MBF = myocardial blood flow; QFR = quantitative flow ratio; RFR = relative flow reserve.
*p<0.05 compared with group A; †p<0.05 compared with group B; ‡p<0.05 compared with group C; §p<0.05 compared with group D.
![]()
DISCUSSION
The current study investigated QFR responses to different anatomic and hemodynamic stenosis severity as well as the diagnostic performance for flow impairment defined by PET in comparison with FFR and iFR. The main findings were as follows. First, QFR demonstrated a similar response as FFR and iFR to different anatomic and hemodynamic stenosis severity. Second, when compared with PET-derived RFR or CFC, the diagnostic performance of QFR was inferior to FFR or iFR. Third, discordance in stenosis classification between QFR and FFR or iFR was driven by the dependency of QFR on anatomical stenosis severity and individual differences in coronary physiologic conditions.
The clinical adoption of FFR or iFR still remains low,2) possibly due to the need of additional instrumentation, high cost of pressure wires or operator reluctance.21)22) QFR is an index that can provide information on the functional significance of a lesion based on angiography-derived coronary anatomy and estimated coronary flow. This system does not require pressure wire interrogation or induction of hyperemia.5) Despite the differences in the background of QFR with invasively measured FFR and iFR, previous studies demonstrated excellent correlation and diagnostic agreement of QFR for FFR5)6)7)8)9)10) or iFR.10)11) In our current study, QFR also demonstrated a strong relationship with FFR (ρ=0.820, p<0.001) or iFR (ρ=0.742, p<0.001). In addition, all QFR, FFR, and iFR showed significant correlation with anatomic and hemodynamic stenosis severity, indicating that QFR can be used as a physiologic index in the cardiac catheterization laboratory possibly like FFR and iFR. However, it should be noted that QFR cannot be measured in all cases, as the exclusion rate was 33.9% in our study. In addition, QFR is theoretically more dependent on anatomical stenosis severity than FFR and iFR and cannot fully reflect individual variations in coronary physiologic conditions. In our study, the correlations with QCA %DS and 3D %DS were higher with QFR than those with FFR or iFR.
In the current study, we employed PET-derived RFR, CFR and CFC as independent references to compare the diagnostic performance of QFR with FFR and iFR and showed that the diagnostic performance of these 3 indices were different according to the references. When using RFR as a reference standard, QFR demonstrated an inferior diagnostic accuracy and discriminant function compared with FFR. Diagnostic accuracy of iFR was also higher than QFR for RFR. For CFC, diagnostic accuracy of iFR was higher than QFR and discriminant function of FFR was higher than QFR. These results suggest that invasively measured physiologic assessment has better performance in defining ischemia-causing stenosis than QFR. It may be natural as QFR cannot reflect individual variations of coronary physiologic conditions, and the discordance between anatomical stenosis severity and functional significance of coronary stenosis.23)24)25) It is interesting to note that the diagnostic performance of QFR was not different from that of FFR or iFR for PET-derived CFR. Moreover, the diagnostic performance of FFR, iFR, and QFR against CFR was lower than that against RFR. This may be because CFR is influenced by both macro- and microvascular disease status,12)14)26) while RFR is a more epicardial stenosis-specific parameter.16)
As QFR integrates both anatomical and physiological principles, its diagnostic performance is determined by the accuracy of both 3D coronary lumen reconstruction and assumed hemodynamic status. In our study population, the discordance between QFR and FFR or iFR was found in 14.6%. When these lesions were divided into 4 groups according to the cutoff values of QFR and FFR or iFR, 2D and 3D %DS were different between high and low QFR groups in both high FFR group and low FFR group. The high FFR but low QFR group demonstrated a numerically smaller reference diameter. One potential explanation might be that small coronary arteries make vessel demarcation more difficult, and even small variations in measurements may have a significant impact on the overall QCA quality and QFR calculation. Therefore, QFR results in small vessels may need to be interpreted with caution. This finding was similar in QFR and iFR relationship and suggests the dependency of QFR on anatomical stenosis severity. This is the common limitation of any anatomy-based physiologic assumption.27)28) However, even this methodology is not based on full 3D curved geometry and cannot reflect individual variations of coronary physiologic characteristics.
As QFR is calculated from empirical hemodynamic assumptions, it may be natural to observe discordant results between QFR and invasively-measured physiologic parameters in some patients. Previous studies showed that resting and hyperemic flow conditions can influence the discordance between QFR and iFR or FFR.10)25) These authors reported that these discordances were mainly caused by the differences in patient-specific CFR or the presence of coronary microcirculatory dysfunction. In our study, the distribution patterns of anatomical and hemodynamics parameters were different among the 4 groups divided by QFR and FFR or iFR. This result showed that both anatomical assessment and physiologic assumption of QFR determined the discordance between QFR and iFR or FFR.
There are several limitations in this study. First, this study was retrospectively investigated, and several patients were excluded due to insufficient angiography imaging quality for QFR and/or FFR or iFR pressure tracing artifacts. Second, the sample size of this study was relatively small, especially for the 4 group comparisons for the discrepancy between QFR and FFR or iFR, and further studies are warranted to confirm the results of our study findings. However, our study is the first one that compared the diagnostic performance of QFR with FFR and iFR using PET parameters as references. Third, 13N-ammonia PET and invasive physiological measurements were not performed simultaneously. However, we included only patients with available 13N-ammonia PET and FFR measurement within 3 months and there were no clinical events between the 2 tests. Fourth, we could not evaluate the prognostic implications of QFR-guided treatment. Fifth, this study used 13N-ammonia as a PET tracer, and the absolute myocardial blood flow can be affected by the used tracer. However, the flow ratio, such as RFR or CFR, was reported to be relatively constant among different tracers.29) Finally, although PET demonstrated better diagnostic performance compared with other non-invasive modalities, high cost and limited availability are the limitations of PET in clinical practice.
In conclusion, QFR demonstrated a similar response to different anatomic and hemodynamic stenosis severities as FFR or iFR. However, its diagnostic performance was inferior to FFR and iFR when PET-derived RFR and CFC were used as a reference. The discordance between QFR and FFR or iFR was associated with the dependency of QFR on anatomical stenosis severity and individual variations in coronary physiologic conditions.
 XML Download