

 PDF
PDF Citation
 Print
Print


INTRODUCTION
Parkinson's disease (PD) is the second most common neurodegenerative disorder after Alzheimer's disease. Clinically, it is a movement disorder that is characterized by tremor, rigidity, and bradykinesia. In addition to motor symptoms, diminished visual acuity, color vision and contrast sensitivity are some of the visual disturbances found in PD.12 In this regard, dopamine dysfunction in PD is seen not only in the basal ganglia but also in the retina, especially in the horizontal, amacrine, bipolar and ganglion cells.3
Optical coherence tomography (OCT) is a non-invasive and non-contact trans-pupillary imaging technology that provides high-resolution, cross-sectional images of ocular and biological structures.4 Using OCT, it was first shown in 20045 that the nerve fiber layer (NFL) of the retina is thinned in PD. Subsequently, retinal thinning in PD was confirmed in some studies.67 Contrarily, other studies found no differences in retinal NFL (RNFL) thickness between PD patients and controls.68910
It is known that the early stages of PD are characterized by asymmetry of motor symptoms, which is to say, the occurrence of symptoms in one limb, left or right, rather than both at the same time.1112 In addition, there is a report that the directionalities of motor asymmetry and brain cortex atrophy are related.1314 Meanwhile, PD starts and progresses slowly, and so it is difficult to know exactly when the disease is fully manifest.15 In this respect, early diagnosis of PD, at the initial, asymmetry stage of motor impairment, would be helpful.
As far as we are aware, however, no study has yet analyzed the correlation between asymmetry of motor function in PD and OCT parameters. The present study was designed to evaluate the relationship between motor asymmetry and interocular difference of retinal thickness in patients with de novo PD.
Go to : 
METHODS
Subjects
This was a prospective case-control and hospital-based evaluation of PD patients and age- and sex-matched healthy controls. To control for and minimize the effects of medication involvement and disease severity, we recruited early-stage, medication-naïve PD patients. Specifically, de novo PD patients who had visited the Movement Disorder Clinic at Hallym University Dongtan Sacred Heart Hospital were consecutively recruited. Diagnosis of PD was made by a movement-disorders specialist on the basis of the clinical diagnostic criteria of the UK PD Brain Bank Society.12 For every participant with PD, information on age, sex, age at PD onset, and Unified Parkinson's Disease Rating Scale part III (UPDRS-III) was collected at the time of diagnosis. The controls were voluntarily recruited from either healthy volunteers who had visited for routine health checkups or patients from a General Ophthalmology Clinic of Hallym University Sacred Heart Hospital.
The exclusion criteria were the presence of comorbid ophthalmic pathologies capable of affecting retinal thickness, such as glaucoma, age-related macular degeneration, diabetic retinopathy, retinal vein or artery occlusion, epiretinal membrane, macular hole, high myopia (defined as spherical equivalent > −6.0 diopters or glaucomatous optic neuropathies), presence of media opacity impeding acquisition of high-quality OCT images, and inability to undergo OCT examination. Eyes that had undergone ocular surgery other than cataract extraction were excluded as well.
Ophthalmic evaluation
All of the participants underwent complete ophthalmologic examinations, including best-corrected visual acuity, slit-lamp examination, intraocular pressure measurement by non-contact tonometry, refractive error with an autorefractor (KR-890; Topcon Corporation, Tokyo, Japan), central corneal thickness measurement (Pocket II Pachymeter Echo graph; Quantel Medical, Clermont-Ferrand, France), axial length measurement (Axis II PR; Quantel Medical, Inc., Bozeman, MT, USA), dilated fundus examination, and a central 24-2 threshold test of the Humphrey Visual Field (HVF, HFA II; Humphrey Instruments Inc., Dublin, CA, USA). All also underwent retinal and optic nerve head imaging by spectral-domain optical coherence tomography (SD-OCT, Spectralis; Heidelberg Engineering, Heidelberg, Germany).
Peripapillary RNFL thickness by SD-OCT scans
High-resolution retinal imaging was performed by SD-OCT. The automatic eye-tracking technology maintains fixation on the retina. Only well-centered images with a signal strength of greater than 20 dB were used for the analysis. The peripapillary RNFL thickness (pRNFLT) was measured around the optic disc with 16 averaged consecutive circular B-scans (diameter of 3.5 mm, 768 A-scans). The pRNFLT (from the inner margin of the internal limiting membrane to the outer margin of the RNFL layer) was automatically segmented using Spectralis software version 5.3.3.0 (Fig. 1A). pRNFLT data were collected on the RNFL in each of the superior, inferior, temporal, and nasal sectors.
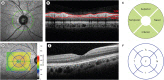 | Fig. 1OCT scans of right eye of patient showing normal RNFL and mRT values in all regions. (A) Infrared image of peripapillary region showing location of the 360-degree 3.4 mm diameter-circular scan (green circle) centered around optic nerve head (green cross). (B) OCT image depicting segmented RNFL (red line). (C) RNFLT measurement in each sector (temporal, superior, nasal, inferior, temporal) of subject. (D) Topographic maps of mRT were acquired in circles of 1, 3 and 6 mm. These were divided into 9 regions: the center circle of 500 mm radius, and inner and outer rings, each divided into four quadrants according to the Early Treatment of Diabetic Retinopathy Study. (E) Infrared image of macula showing vertical scan. The mRT was defined as the distance between the surface line of the NFL and the hyporeflective line above the retinal pigment epithelium, as measured by automatic segmentation. (F) mRT measurement in each sector (temporal, superior, nasal, inferior, temporal) of subject. The mRT of each sectoral area was the average value of the measurements at the 3 and 6 mm circles.OCT = optical coherence tomography, RNFL = retinal nerve fiber layer, mRT = macular retinal thickness, RNFLT = retinal nerve fiber layer thickness, S = superior, T = temporal, I = inferior, N = nasal, F = foveal.
|
Macular retinal thickness (mRT) by SD-OCT scans
The mRT topographic maps were acquired via raster images consisting of 31 high-resolution B scans covering a 30° × 25° area centered on the fovea. The mRT was defined as the distance between the surface line of the NFL and the hyporeflective line above the retinal pigment epithelium, as measured via the automatic segmentation algorithms of the Spectralis software. Spectralis SD-OCT provides the results of macular thickness measurements in circles of 1, 3 and 6 mm. These are divided into 9 regions: a center circle of 500 mm radius and inner and outer rings, each divided into four quadrants according to the Early Treatment of Diabetic Retinopathy Study (Fig. 1B). mRT values are reported numerically for the central, superior inner, inferior inner, temporal inner, nasal inner, superior outer, inferior outer, temporal outer, and nasal outer regions. The mRT of each superior, inferior, nasal, and temporal area was applied to the analysis of the average value of the measured mRT at the circles of 3 and 6 mm, as follows: Superior 3 mm + Superior 6 mm = Mean superior mRT. The same method was used to calculate the mean inferior, temporal, and nasal mRT, respectively.
Interocular differences of pRNFLT and mRT
Each sector and average value of pRNFLT and mRT, in both eyes, were obtained. Then, each patient's interocular asymmetry in the four directional quadrants and the overall average were calculated. Interocular asymmetry was the absolute value of thickness difference defined as follows: (More affected side of eye − Less affected side of eye).1617 Additionally, in order to correct the baseline thickness in the thickness-difference calculation, the asymmetry index for retinal thickness (AIRT) was applied. The AIRT is defined as: (Retinal thickness differences between ‘more affected side’ and ‘less affected side’/Average retinal thickness of ‘more affected side’ and ‘less affected side’) × 100.18 For comparison of the interocular difference at distinct perifoveolar radial distances, the thickness difference between the more and less affected sides for each corresponding sector, of each subject, was calculated.
Neurological evaluation in PD
For all of the patients, a detailed clinical history was taken and a neurological examination was carried out by a neurologic specialist. The motor assessment was performed based on UPDRS-III. The scores for tremor, rigidity of upper and lower extremities, finger taps, hand movements, and leg agility were calculated separately for each side (7 items, each item scored from 0 to 4).
Motor-symptom laterality in PD
For the PD patients, the laterality of motor symptoms was defined as the right or left side according to which was more affected by parkinsonism symptoms. In detail, the sum of the UPDRS-III scores for each side, left and right, was analyzed, and the higher score was determined as the more affected side. If lateralized UPDRS-III scores were equal for both sides, the more affected side was determined using the historical data on the disease onset side. If the onset symptoms were axial, the first lateralized symptom was used.19
Further, motor-symptom laterality in the PD patients was evaluated according to the Symmetric index. The Symmetric index parameter is the more and less affected side asymmetry of the UPDRS-III result, as calculated according to the following formula: |More affected − Less affected side of UPDRS score|/(More affected + Less affected side of UPDRS score).2021 Then, the correlation between the Symmetric index of UPDRS-III and the interocular asymmetry of the OCT parameters was analyzed. The symmetry index ranged from 0 to 1, higher values indicating higher degrees of asymmetry. A cut-off value of 0.20 or greater was used to estimate the frequency of asymmetric parkinsonism.22 Motor-symptom laterality in the PD patients was evaluated according to the Symmetric index.
Statistical analysis
For comparison of the baseline demographics and clinical characteristics between the PD patients and the controls, the independent t-test and χ2 test were used. During the evaluation of pRNFLT and mRT, the more affected and less affected side eyes were separately compared between PD and the controls, as was the interocular difference. Additionally, the relationships between the UPDRS-III (including Symmetric index) and the OCT parameters were studied using Spearman ranked correlation. A P value < 0.01 (0.05/5) was considered significant for statistical adjustments of multiple comparisons of the segments (superior, inferior, nasal, temporal, average) for correlation analysis with pRNFLT or mRT. Otherwise, a P value of < 0.05 was considered to be statistically significant. All of the statistical analyses were carried out using SPSS version 21.0 (SPSS, Chicago, IL, USA). All of the tests were 2-tailed.
Ethics statement
The present study protocol was reviewed and approved by the Institutional Review Board of Hallym University Sacred Heart Hospital (approval No. 2019-05-024-002), and informed consent was obtained from the participate in the research study.
Go to :
RESULTS
Of the initial 35 eligible patients with PD and 34 controls, 4 PD patients and 3 controls were excluded from the analysis due to inadequate scans, ocular conditions listed in the exclusion criteria, or poor cooperation with OCT. A total of 31 patients with PD (31 eyes) and 31 age-and sex-matched healthy controls (31 eyes) were enrolled for analysis. Females constituted the majority of patients (61.3%). Twelve (12; 38.7%) among the 31 PD patients showed motor-symptom predominance on the right side, while the remaining 19 patients (61.3%) showed predominance on the left side.
The demographics and baseline characteristics are summarized in Table 1. The ocular parameters were the averaged right eye/left eye values, and there were no differences in visual acuity, spherical equivalent or axial length between the patients with PD and the controls. However, the patients with PD had a worse mean deviation (MD) of visual field (−3.86 ± 4.16 dB) relative to the controls (−1.61 ± 2.48 dB, P = 0.001).
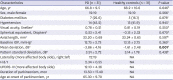
Table 1
Demographics and clinical characteristics of healthy controls and primary open-angle glaucoma
Values are presented as mean ± standard deviation or number (%). Bolded values represent significance (P < 0.05).
PD = Parkinson's disease, IOP = intraocular pressure, H & Y = Hoehn and Yahr staging, NA = not applicable, UPDRS-III = Unified Parkinson's Disease Rating Scale part III.
aAveraged right eye/left eye values; bIndependent t-test; cχ2 test.
![]()
Comparison of pRNFLT and mRT between PD patients and controls
There were no differences between the PD patients and the healthy controls in the average or any of the sectoral pRNFLT in either eye. Additionally, interocular asymmetry (More affected side – Less affected side) of pRNFLT did not differ between the two groups (all P > 0.05) (Table 2). Similarly, there was no difference in the average or sectoral mRT in either eye (all P > 0.05) (Table 3). However, the interocular asymmetry of average mRT and AIRT of temporal mRT showed significant differences between the two groups (P = 0.026 and 0.044).
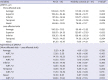
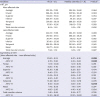
Table 2
pRNFLT analysis of healthy controls vs. PD patients
Values are presented as mean ± standard deviation. The eye direction of the healthy controls was paired with the PD group.
PD = Parkinson's disease, pRNFLT = peripapillary retinal nerve fiber layer thickness, AIRT = asymmetry index of retinal thickness.
a(Retinal thickness differences between ‘more affected side’ and ‘less affected side’/Average retinal thickness of ‘more affected side’ and ‘less affected side’) × 100; bIndependent t-test.
![]()
Table 3
mRT analysis of healthy controls vs. PD patients
The eye direction of the healthy controls was paired with the PD group. Bolded values represent significance (P < 0.05).
PD = Parkinson's disease, mRT = Macular retinal thickness, AIRT = asymmetry index of retinal thickness.
a(Retinal thickness differences between ‘more affected side’ and ‘less affected side’/Average retinal thickness of the ‘more affected side’ and ‘less affected side’) × 100; bIndependent t-test.
![]()
UPDRS-III
For all of the PD patients, the motor functions of the upper and lower extremities on both sides were analyzed using UPDRS-III (Table 4). The sum of UPDRS-III showed a discrepancy between more-affected- and less-affected-side symptoms, the overall scores being 12.10 ± 4.36 and 8.71 ± 4.04, respectively (P = 0.002). In detail, the components for rigidity in upper extremity, finger taps, and rapid alternating hand movement showed significant asymmetry between the more affected and less affected sides (P = 0.001, 0.006 and 0.006). The calculated Symmetric index was 0.21 ± 0.19, which suggested asymmetric parkinsonism.
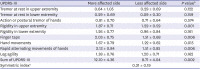
Table 4
Motor components of UPDRS-III in PD patients, more affected vs. less affected side
UPDRS-III = Unified Parkinson's Disease Rating Scale part III, PD = Parkinson's disease.
aSymmetry index = |More affected side − Less affected side UPDRS score|/(More affected side + Less affected side UPDRS score); bPaired t-test.
![]()
Correlation between OCT thickness parameters and UPDRS-III
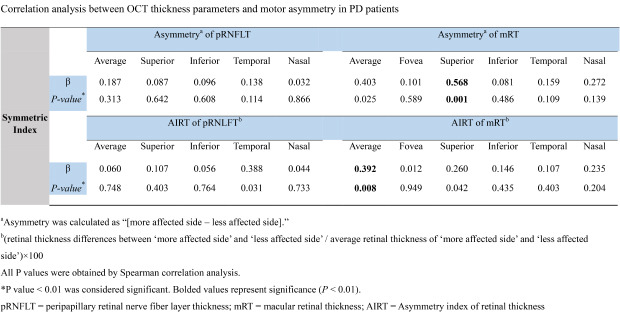
The results of the analysis of correlation between the interocular differences (More affected side − Less affected side) of the OCT thickness parameters and motor-symptom laterality are presented in Table 5. The calculated Symmetric index of UPDRS-III showed significant relations for interocular asymmetry of superior mRT and AIRT of average mRT (P = 0.001 and 0.008). By contrast, between asymmetry of pRNFLT and the Symmetric index, there was no association (P ≥ 0.01 for all) (Table 5).

Table 5
Correlation analysis between OCT thickness parameters and motor asymmetry in PD patients
All P values were obtained by Spearman correlation analysis.
OCT = optical coherence tomography, PD = Parkin's disease, pRNFLT = peripapillary retinal nerve fiber layer thickness, mRT = macular retinal thickness, AIRT = asymmetry index of retinal thickness.
aAsymmetry was calculated as (More affected side − Less affected side); b(Retinal thickness differences between ‘more affected side’ and ‘less affected side’/Average retinal thickness of ‘more affected side’ and ‘less affected side’) × 100; c
P value < 0.01 was considered significant. Bolded values represent significance (P < 0.01).
![]()
Additionally, the correspondence of directionality between the laterality of motor symptoms and the OCT thickness parameters was analyzed (Table 6). There was no definite correspondence or reverse-correspondence of directionality between the affected body side and the same side of pRNFLT or mRT.
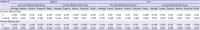
Table 6
Spearman correlation analysis between each side of UPRDS-III and OCT thickness parameters on more or less affected side
UPRDS-III = Unified Parkinson's Disease Rating Scale part III, OCT = optical coherence tomography, pRNFLT = peripapillary retinal nerve fiber layer thickness, mRT = macular retinal thickness.
aP value < 0.01 was considered significant.
![]()
Go to :
DISCUSSION
The present study showed that interocular asymmetry of mRT was apparent; the calculated Symmetric index, correspondingly, showed asymmetric motor symptoms in early-stage medication-naïve PD patients.
There have been many reports linking functional findings represented by UPDRS to the structural features of the brain in PD patients.232425 More recently, studies have found that retinal or RNFL thickness in eyes where dopamine is present was related to the UPDRS.8926272829 In the studies on structure and function in PD patients, OCT-guided structural measurement has been taken mostly in only one eye, or alternatively, in both eyes prior to calculation of the average value.892627 Likewise, in the case of functional assessment based on UPDRS, both sides are analyzed together without considering laterality. However, early-stage PD patients are known to exhibit asymmetry in UPDRS, and laterality of symptoms is related to asymmetric structural changes in the brain.13232430 This was the context in which we performed the present study, and found that there was interocular asymmetry of mRT that was correlated with asymmetric distribution of UPDRS-III scores.
Although previous reports have posited retinal-thickness abnormality in patients with PD,273132 we did not find any significant abnormality. In this study, the average and sectoral pRNFLT and mRT of patients with PD were not significantly different from those of the healthy controls (Tables 2 and 3). With respect to these points, the literature on RNFL thickness in PD likewise has yielded conflicting results. Although several studies have reported RNFL thickness to be similar in patients and controls,63133 most have shown decreased thickness of RNFL in PD.52829 In our study, a smaller mean duration of disease as compared with other studies contributed to the lack of significant difference between the two groups. In fact, our enrollment of early-stage medication-naïve PD patients probably explains why the pRNFLT changes were not significant.
One of the interesting results in this study, the baseline MD of PD group showed significantly lower values than those of the healthy controls (Table 1). However, there was no difference in RNFL thickness between the two groups, as shown in Table 2. In addition, although not shown in the results of this study, no distinct structural damage corresponding to visual field damage was identified in PD patients with low MD values. The authors have speculated that the difference in MD values did not reflect the difference in visual function between the two groups, but rather, the ability to perform the visual field test. It is possible that PD patients' poor performance in the visual field test compared with the healthy controls was due to hand tremor and difficulty in the fixed posture.
Previous research has recorded negative correlations of pRNFLT with disease severity.2834 In our study, however, pRNFLT did not correlate with UPDRS-III, whereas average mRT negatively correlated with UPDRS-III (Table 5). We postulated the following possible explanation: retinal changes tended to occur in the macular region, which is thicker than the RNFL layer in PD patients.
We reported significant interocular asymmetry of the mRT in PD. Moreover, such asymmetry of mRT was well correlated with asymmetric motor function in the PD patients. Interocular asymmetry of mRT and its association with motor asymmetry could be explained by the postulation that the retina, as with the substantia nigra, may be affected asymmetrically in the early stages of PD. In line with our results and supportive of this hypothesis is a report on interocular foveal thickness asymmetry in PD.17 Furthermore, motor asymmetry is among the clinical and imaging diagnostics criteria for PD.35
In this study, asymmetric motor abnormality and asymmetry of mRT in PD patients were observed, but there was no definite pattern of directionality between the laterality of motor symptoms and asymmetry of decreased mRT (Table 6). These findings suggest that changes in dopamine dysfunction in the neuronal tissues that cause motor asymmetry and affect the retina have no regular correspondence with the left or right direction. However, given both the small number of patients in this study and the predominance of left motor dysfunction among them, the results of this study alone cannot be considered to be decisive with respect to the corresponding direction between more affected side eye and motor laterality in PD patients. Further studies with a larger number of selected patients are needed to validate this present finding.
Several points need to be considered when interpreting the results of the current study. First, the study was cross-sectional; therefore, the recorded retinal-structural changes in correlation with PD severity need to be confirmed through longitudinal follow-up studies. In addition, since neither the pathological findings nor the DAT nuclear imaging were confirmed, a subset of the de novo PD patients ultimately might not have PD. Second, the sample size was relatively small, and the study population was comprised entirely of Korean early-stage PD patients. As such, generalization to different-stage PD patients and/or other ethnic populations would be problematic. Third and finally, whereas OCT can help to assess morphological retinal changes in PD patients, its utility in routine clinical practice might be limited, in that some PD patients have difficulties complying with it due to disease-related symptoms such as tremor, rigidity, or cognitive impairment.
In the present study, we did not find any significant pRNFLT or mRT abnormality in patients with PD. However, interocular mRT asymmetry was found, which showed a significant correlation with asymmetric motor function. Longitudinal follow-up studies on larger populations of patients are warranted for validation of our findings.
Go to :
 XML Download