Journal List > J Korean Med Sci > v.36(5) > 1146418

Joshi and Gupta: Preparing Infographics for Post-publication Promotion of Research on Social Media

Abstract

Infographics are pictorial representations of information intended to disseminate information quickly and clearly. Their use has increased in the past decade due to wider and easy access to technology. Infographics are being increasingly used for public advisories, disseminating protocols for healthcare professionals, and post-publication promotion of research. Due to their potential to rapidly reach a vast audience, these have gained larger importance during the coronavirus disease 2019 pandemic. Two key aspects determine the quality of infographics, content and visual appeal. In this brief, the authors attempt to delineate the key aspects of designing an infographic, and the freeware that they may have at their disposal for creating informative, appealing, and useful infographics.

Graphical Abstract

jkms-36-e41-abf001.jpg

INTRODUCTION

Infographics are pictorial representations of data or knowledge intended to disseminate information quickly and clearly. In this digital era, information embodies power. With various tasks at hand, both healthcare workers and patients are time-pressed, and in the quest for reliable and valid information presented in a precise and clear manner.
With an increasing volume of published medical literature, it is challenging for healthcare professionals to keep abreast of all new research findings due to barriers of time constraints and volume of published literature.1 Promotion of articles using infographics on social media platforms (SMPs) has the potential to provide rapid and effective dissemination routes for concise and practical information.1234 Besides, the visibility of articles on SMPs is an important measure of use and attention, known as Altmetrics. Wider dissemination among researcher community such as on Mendeley is known to translate into better Altmetric scores. Research showcased on SMPs as infographics are known to gather higher altmetric scores.1
Infographics containing patient-specific, real-time data about the clinical presentation, key risk factors, and adverse outcomes of diseases are not only useful for the patients and healthcare professionals. Still, they may also act as a beneficial tool for shared decision-making among future healthcare policymakers.56 In the time of coronavirus disease 2019 (COVID-19) pandemic, infographics have emerged as an effective tool to deliver credible medical information with relevance to public health due to the rise of unverified pandemic related information on SMPs.7 They are particularly used for disseminating clinical recommendations and prevention strategies891011 and in telemedicine for guidance on home-based care.12

Unique advantages of using infographics in science

The primary principle of designing a good infographic encompasses breaking down information into content that is simpler and easy to understand, visually appealing, and information that can be gathered quickly. Infographics are perceived as a more enjoyable format for reading than conventional text.13 These visual nuggets of information are built on the premise of most efficient retention of data obtained visually, despite the ever-shrinking short attention spans due to widespread use of social media in the current generation.1415 Infographics hold the potential to get information across thousands of people in a short time.
Besides, images are processed faster than text by the human brain.16 Infographics are known to improve student retention, thinking and learning skills.1718 A combination of visual and verbal information is even better for information recall and may enhance critical thinking.171920 In a study conducted by Martin et al.21 on healthcare professionals, reviewing article summaries in infographic format was associated with lower cognitive load scores than reviewing articles in text-only abstract format. The use of infographics by healthcare professionals will be less mentally taxing and could improve their knowledge of new medical evidence.
While infographics and videos may perform equally well, the former may be preferred in the longer term due to easier viewing.22 Another distinctive advantage is the ability of these to communicate important information across people of varied subject matter related to literacy, making them particularly useful for public health advisories.23242526 They are also being used to improve research literacy among trial participants.27

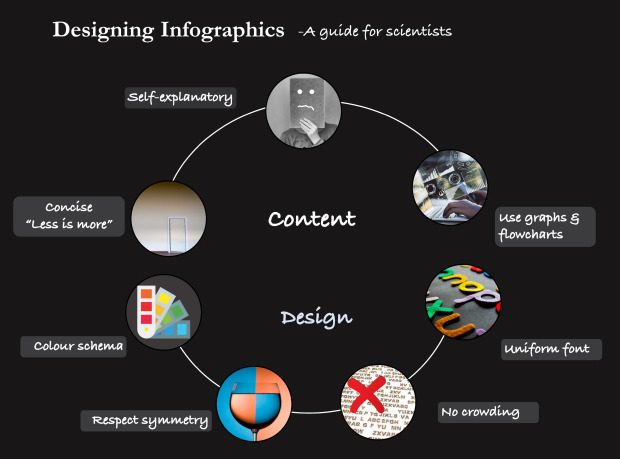
DESIGNING A GOOD INFOGRAPHIC

The content and visual appeal are two aspects vital to the creation of a good infographic.19282930313233

Content appeal

  • 1. The information to be presented should be concise, understandable and self-explanatory for the convenience of the viewer.

  • 2. Brevity is the key to better attention of the reader. Hence the idiom ‘less is more’; the creators should aim to convey curated and the most important information only, by using the least words possible.

  • 3. Representation of data using graphs, flowcharts, tables, mindmaps, lists, area diagrams, word clouds, charticles, etc., may enhance the reading experience and help in better retention of information.34

Visual appeal

  • 1. The visual content should be arranged without over or under crowding.

  • 2. For academic or scientific infographics, a greater focus on content rather than design is recommended. The design should covertly engage the audience. In other words, the appeal may not be the priority.

  • 3. Careful choice of colour scheme for infographics may enhance the style and appeal. A colour scheme which is not appealing to the eye is immediately noticed by the person reading it whereas an aesthetically pleasing scheme is automatically satisfying, and the reader is instantly drawn to the infographic.

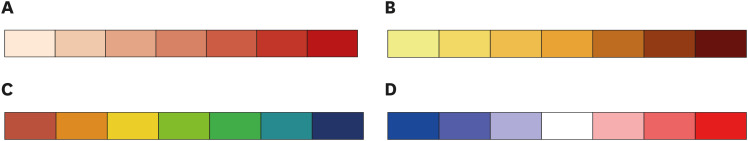
  • 4. Pre-designed colour palettes available from a free and open platform for colour inspiration on the internet35 can help attain symmetry in a time-efficient manner (Fig. 1). Various freeware listed below have in-built colour schemes as well.

  • 5. Humans have an inherent appreciation for many symmetrical aspects of the natural world, such as markings on coral reef fish and butterflies.36 This appears to extend to a more general sense of aesthetics or visual appeal. Colours and arrangement of the elements in the infographic comprise a highly important part of this.

  • 6. Uniformity should be maintained for a clean look. For example, use of many different fonts is best avoided. One font for body text and one for headings is ideal. Spacing between different elements should be equal when feasible.

Fig. 1

Types of colour schemes (A) Monochrome Sequential Colour Scheme. (B) Part-spectral Sequential Colour. (C) Divergent Colour Scheme. (D) Spectral Colour Scheme.

jkms-36-e41-g001

FREEWARE FOR DESIGNING INFOGRAPHICS
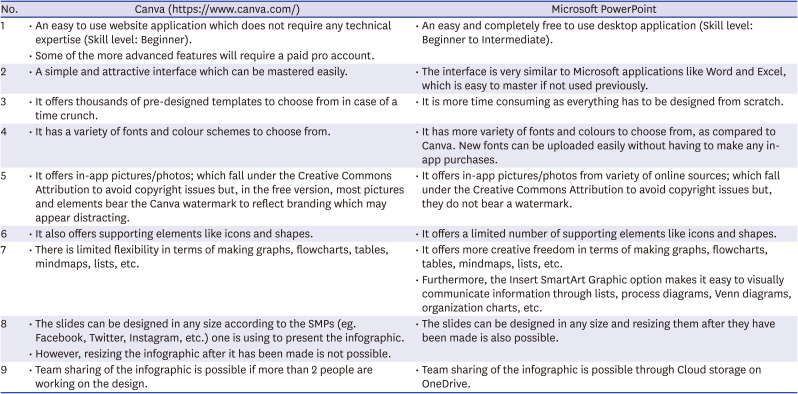
Various tools can be helpful to create an effective infographic. The authors suggest the following after using them for a significant amount of time. Canva and Microsoft PowerPoint are the most commonly used tools for the creation of infographics by medical personnel. The use of Canva is popular for social media marketing by professionals as well. The authors compare and contrast the two (Table 1) while discussing the other easy alternatives for authors and editors for creating infographics.
Table 1

Comparing features of Canva and Microsoft PowerPoint

jkms-36-e41-i001
No. Canva (https://www.canva.com/) Microsoft PowerPoint
1 • An easy to use website application which does not require any technical expertise (Skill level: Beginner). • An easy and completely free to use desktop application (Skill level: Beginner to Intermediate).
• Some of the more advanced features will require a paid pro account.
2 • A simple and attractive interface which can be mastered easily. • The interface is very similar to Microsoft applications like Word and Excel, which is easy to master if not used previously.
3 • It offers thousands of pre-designed templates to choose from in case of a time crunch. • It is more time consuming as everything has to be designed from scratch.
4 • It has a variety of fonts and colour schemes to choose from. • It has more variety of fonts and colours to choose from, as compared to Canva. New fonts can be uploaded easily without having to make any in-app purchases.
5 • It offers in-app pictures/photos; which fall under the Creative Commons Attribution to avoid copyright issues but, in the free version, most pictures and elements bear the Canva watermark to reflect branding which may appear distracting. • It offers in-app pictures/photos from variety of online sources; which fall under the Creative Commons Attribution to avoid copyright issues but, they do not bear a watermark.
6 • It also offers supporting elements like icons and shapes. • It offers a limited number of supporting elements like icons and shapes.
7 • There is limited flexibility in terms of making graphs, flowcharts, tables, mindmaps, lists, etc. • It offers more creative freedom in terms of making graphs, flowcharts, tables, mindmaps, lists, etc.
• Furthermore, the Insert SmartArt Graphic option makes it easy to visually communicate information through lists, process diagrams, Venn diagrams, organization charts, etc.
8 • The slides can be designed in any size according to the SMPs (eg. Facebook, Twitter, Instagram, etc.) one is using to present the infographic. • The slides can be designed in any size and resizing them after they have been made is also possible.
• However, resizing the infographic after it has been made is not possible.
9 • Team sharing of the infographic is possible if more than 2 people are working on the design. • Team sharing of the infographic is possible through Cloud storage on OneDrive.

Mind the Graph (https://mindthegraph.com/)

Mind the Graph is an easy to use website application specifically designed for the scientific research community. It offers thousands of pre-designed templates catered for various research-oriented topics like pneumonia, COVID, and vaccination, which can be edited as per the needs of the user. Apart from the usual elements and shapes, this application has thousands of scientifically accurate icons/illustrations for human body organs, various types of cells, the morphology of bacteria, and many other topics. Its unique feature called ‘on-demand graphics’ allows users to demand an icon from the app developers if it is not available. Additionally, it offers a wide variety of text designs, the ability to create graphs and flowcharts, and custom sizing options for the templates. The major disadvantages are that free users have to include the watermark in their projects, have to cite Mind the Graph when publishing or presenting their work, and team sharing of the infographic is not possible. The free version also has the limit of one infographic per user.

Pablo (https://pablo.buffer.com/)

Pablo is a freeware compatible with the beginner-level skill base and easy to operate with minimal technical expertise. It is primarily suitable for image-based infographics and thus does not offer much creative freedom to create more customized infographics using graphs, charts, tables, etc. It has thousands of in-app pictures/photos to choose from; which fall under the Creative Commons Attribution to avoid copyright issues but has very limited editing options for them. Posts created using this can be resized to fit SMPs like Facebook, Twitter, Instagram and Pinterest only.

Adobe Spark (https://spark.adobe.com/sp/)

Adobe Spark is a freeware that does not require any technical expertise and is very similar to Canva in functionality and features. It features unique design frameworks with different infographic styles and appeal. Additionally, it offers advantages of a wide variety of fonts and colour schemes, and the option to resize the infographic to fit different SMPs. Infographics created using this application can be shared and edited by multiple people but building a team account is not possible.

Infogram (https://infogram.com/)

Infogram is an application specifically designed for presenting data in the form of graphs, charts and maps. It allows users to integrate website links and YouTube videos into the infographic. The major disadvantages include a watermark/logo on the content and inability to download the infographics from a free account. However, the infographics designed using the tool can be shared through the website.
The use of elements is common to all platforms and may allow transfer from one platform to another. This may aid in the creation of more impactful infographics. SmartArt, graphs, tables, and design elements may be useful to the same effect. For high-quality images, saving the desired piece as a picture in a .png (Portable Network Graphics) or a .svg (Scalable Vector Graphics) format/type is suggested for the best results. Lastly, in the era of digitization, automated algorithms are being developed to extract templates from real-world timeline infographics.37
Some additional freeware available on the internet are:
  • 1. Google Charts (https://developers.google.com/chart) - It is a powerful and simple to use website application for creating infographics in the form of visually appealing mathematical charts.

  • 2. Piktochart (https://piktochart.com/) - It is a website application which allows even beginners to create infographics.

  • 3. Snappa (https://snappa.com/app) - It is an application similar to Canva except that, most pictures and elements do not bear a watermark.

  • 4. Visme (https://www.visme.co/) - It is yet another free application similar to Canva.

CONCLUDING REMARKS

Infographics are pictorial representations of information, data, or knowledge intended to disseminate information quickly and clearly.1738 This is not a new concept but has still gained popularity recently due to the technology which has impelled the analysis of data and text to become easier and more accessible. The tools of production of infographics are no longer reserved for certain specialists; now amateurs can also try their hand at them.39 Infographics have been used in the recent past for patient-centered care22404142 and public health benefits like prevention of diseases,4344 communicating overdose prevention strategies,45 to increase clinical trial participation4647 which allow for a better patient understanding of their health and empowers patients to participate in their healthcare. Recently Chan et al.2 disseminated an infographic delineating the principles of airway management focusing on infection control for healthcare workers in the early COVID‐19 pandemic period. The infographic and its various language translations were well received and received over 64,000 impressions on Twitter and were later adapted by reported organizations for a wider readership. Healthcare workers drive the rapid uptake' is a prime example of the utility of this technique. Furthermore, the use of infographics by healthcare professionals and medical editors alike could reduce article reviewing time and facilitate faster publication, dissemination and uptake of new medical evidence.2128
The pandemic period has seen a rise in the use of infographics for the promotion of scientific literature on SMPs.4 With many journals introducing infographics alongside articles,48 their use for providing concise and practical information, attract audience attention and increase the visibility of items is likely to gain a greater foothold in the future.1234
The process of infographic designing in the past was difficult and time-consuming, especially for laypeople, because the tools required users to manually initialize most of the design (e.g., drawing graphical elements). With the introduction of automated infographic design tools, it has become easier to design such infographics.49 Using templates is an effective approach to enable automated infographic design, which has been widely used in commercial software, such as Microsoft PowerPoint and Adobe Illustrator. These systems can automatically generate infographics by plugging in data to a design template. However, these systems typically only provide limited types of templates with default styles, which leads to a lack of diversity and has less control over creative freedom.37 Custom templates can be created with ease by investing a little more time for a more personally curated infographic. Creation of an animated infographic can further benefit healthcare professionals, patients and students alike.50
To conclude, the use of infographics tends to disseminate information quickly and clearly and has the advantage of being perceived as a more enjoyable format for reading. Advancement in technology has further made the process of infographic creation easier and more accessible.

ACKNOWLEDGMENTS

The authors wish to thank Prof. Armen Gasparyan for his help with this work.

Notes

Disclosure: The authors have no potential conflicts of interest to disclose.

Author Contributions:

  • Conceptualization: Gupta L, Joshi M.

  • Data curation: Gupta L, Joshi M.

  • Formal analysis: Gupta L, Joshi M.

  • Visualization: Gupta L, Joshi M.

  • Writing - original draft: Joshi M.

  • Writing - review & editing: Gupta L.

References

1. Huang S, Martin LJ, Yeh CH, Chin A, Murray H, Sanderson WB, et al. The effect of an infographic promotion on research dissemination and readership: a randomized controlled trial. CJEM. 2018; 20(6):826–833. PMID: 30289098.
crossref pmid
2. Chan AK, Nickson CP, Rudolph JW, Lee A, Joynt GM. Social media for rapid knowledge dissemination: early experience from the COVID-19 pandemic. Anaesthesia. 2020; 75(12):1579–1582. PMID: 32227594.
pmid
3. Haldule S, Davalbhakta S, Agarwal V, Gupta L, Agarwal V. Post-publication promotion in rheumatology: a survey focusing on social media. Rheumatol Int. 2020; 40(11):1865–1872. PMID: 32920728.
crossref pmid
4. Pferschy-Wenzig EM, Pferschy U, Wang D, Mocan A, Atanasov AG. Does a graphical abstract bring more visibility to your paper? Molecules. 2016; 21(9):1247.
crossref pmc
5. Tafur A, Bikdeli B, Weinberg I, Jimenez D, Monreal A, Barba R, et al. Real-time dissemination of aggregate data on presentation and outcomes of patients with venous thromboembolism: the RIETE infographics project. Clin Appl Thromb Hemost. 2020; 26:1076029620931200. PMID: 32936691.
crossref
6. Steele RJ, Digby J, Chambers JA, O'Carroll RE. The impact of personalised risk information compared to a positive/negative result on informed choice and intention to undergo colonoscopy following colorectal Cancer screening in Scotland (PERICCS) - a randomised controlled trial: study protocol. BMC Public Health. 2019; 19(1):411. PMID: 30991987.
crossref pmid pmc
7. Hamaguchi R, Nematollahi S, Minter DJ. Picture of a pandemic: visual aids in the COVID-19 crisis. J Public Health (Oxf). 2020; 42(3):483–485. PMID: 32880394.
crossref
8. Löllgen H, Bachl N, Papadopoulou T, Shafik A, Holloway G, Vonbank K, et al. Infographic. Clinical recommendations for return to play during the COVID-19 pandemic. Br J Sports Med. Forthcoming. 2020; DOI: 10.1136/bjsports-2020-102985.
crossref
9. Carmody S, Ahmad I, Gouttebarge V, Malhotra A, Glover D, Massey A. Infographic. Football-specific strategies to reduce COVID-19 transmission. Br J Sports Med. 2020; 54(22):1362–1364. PMID: 32788295.
crossref pmid
10. Fitzpatrick J, Castricum A, Seward H, Tulloh L, Dawson E. Infographic. COFIT-19: let's get moving through the COVID-19 pandemic! Br J Sports Med. 2020; 54(22):1360–1361. PMID: 32561519.
crossref pmid
11. Bongers CC, de Korte JQ, Catoire M, Greefhorst J, Hopman MTE, Kingma B, et al. Infographic. Cooling strategies to attenuate PPE-induced heat strain during the COVID-19 pandemic. Br J Sports Med. 2020; 55(1):69–70. PMID: 32522736.
crossref pmid
12. Go BC, Brewster R, Patel R, Rajasekaran K. Using telemedicine and infographics for physician-guided home drain removal. OTO Open. 2020; 4(2):2473974X2093356.
crossref
13. Buljan I, Malički M, Wager E, Puljak L, Hren D, Kellie F, et al. No difference in knowledge obtained from infographic or plain language summary of a Cochrane systematic review: three randomized controlled trials. J Clin Epidemiol. 2018; 97(6):86–94. PMID: 29269021.
crossref pmid
14. McCandless D. “The beauty of data visualization” - TEDGlobal 2010. Updated 2010. Accessed September 27, 2020. https://www.ted.com/talks/david_mccandless_the_beauty_of_data_visualization.
15. Krum R. Cool Infographics: Effective Communication with Data Visualization and Design. 1st ed. Hoboken, NJ: John Wiley & Sons;2013.
16. Smiciklas M. The Power of Infographics: Using Pictures to Communicate and Connect with Your Audiences. 1st ed. Indianapolis, IN: Que Publishing;2012.
17. Graphic Organizers. A review of scientifically based research, The Institute for the Advancement of Research in Education at AEL. Updated 2016. Accessed September 27, 2020. http://www.inspiration.com/sites/default/files/documents/Detailed-Summary.pdf.
18. Lyra KT, Isotani S, Reis RC, Marques LB, Pedro LZ, Jaques PA, et al. Infographics or Graphics+Text: Which material is best for robust learning? Updated 2016. Accessed December 18, 2020. https://arxiv.org/ftp/arxiv/papers/1605/1605.09170.pdf.
19. Dunlap JC, Lowenthal PR. Getting graphic about infographics: design lessons learned from popular infographics. J Vis Lit. 2016; 35(1):42–59.
crossref
20. Krauss J. Infographics: more than words can say. Learn Lead Technol. 2012; 39(5):10–14.
21. Martin LJ, Turnquist A, Groot B, Huang SY, Kok E, Thoma B, et al. Exploring the role of infographics for summarizing medical literature. Health Prof Educ. 2019; 5(1):48–57.
crossref
22. Ebrahimabadi M, Rezaei K, Moini A, Fournier A, Abedi A. Infographics or video; which one is more effective in asthmatic patients' health? A randomized clinical trial. J Asthma. 2019; 56(12):1306–1313. PMID: 30395745.
crossref pmid
23. Royal KD, Erdmann KM. Evaluating the readability levels of medical infographic materials for public consumption. J Vis Commun Med. 2018; 41(3):99–102. PMID: 29987964.
crossref pmid
24. Olfert MD, Hagedorn RL, Barr ML, Famodu OA, Rubino JM, White JA. eB4CAST: an evidence-based tool to promote dissemination and implementation in community-based, public health research. Int J Environ Res Public Health. 2018; 15(10):2142.
crossref pmc
25. Wolpin S, Halpenny B, Sorrentino E, Stewart M, McReynolds J, Cvitkovic I, et al. Usability testing the personal patient profile-prostate in a sample of African American and Hispanic men. Comput Inform Nurs. 2016; 34(7):288–296. PMID: 27081755.
crossref pmid
26. Oliffe M, Thompson E, Johnston J, Freeman D, Bagga H, Wong PK. Assessing the readability and patient comprehension of rheumatology medicine information sheets: a cross-sectional Health Literacy Study. BMJ Open. 2019; 9(2):e024582.
crossref
27. Kiernan M, Oppezzo MA, Resnicow K, Alexander GL. Effects of a methodological infographic on research participants' knowledge, transparency, and trust. Health Psychol. 2018; 37(8):782–786. PMID: 30024233.
crossref pmid pmc
28. Balkac M, Ergun E. Role of infographics in healthcare. Chin Med J (Engl). 2018; 131(20):2514–2517. PMID: 30334544.
crossref pmid pmc
29. Adams D. What are infographics and why are they important? Updated March 25, 2011. Accessed December 18, 2020. http://www.instantshift.com/2011/03/25/what-are-infographics-and-why-are-they-important/.
30. Ferreira J. Introduction to Infographics. Updated August 2, 2014. Accessed December 18, 2020. https://www.academia.edu/8124962/Infographics_An_Introduction.
31. Murray IR, Murray AD, Wordie SJ, Oliver CW, Simpson AH, Haddad FS. What surgeons need to know about infographics. Bone Joint J. 2017; 99B(12):1559–1560.
crossref pmid
32. Lankow J, Ritchie J, Crooks R. Infographics: the Power of Visual Storytelling. Hoboken, NJ: John Wiley & Sons;2012.
33. Davidson R. Using infographics in the science classroom. Sci Teach. 2014; 81(3):34–39.
crossref
34. McCrorie AD, Donnelly C, McGlade KJ. Infographics: healthcare communication for the digital age. Ulster Med J. 2016; 85(2):71–75. PMID: 27601757.
pmid pmc
35. Color Hunt. Color palettes for designers and artists. Updated 2020. Accessed September 27, 2020. https://colorhunt.co/.
36. Enquist M, Arak A. Symmetry, beauty and evolution. Nature. 1994; 372(6502):169–172. PMID: 7969448.
crossref
37. Chen Z, Wang Y, Wang Q, Wang Y, Qu H. Towards automated infographic design: Deep learning-based auto-extraction of extensible timeline. IEEE Trans Vis Comput Graph. 2020; 26(1):917–926. PMID: 31443028.
crossref pmid
38. Newsom D, Haynes J. Public Relations Writing: Form and Style. 10th ed. Boston, MA: Cengage Learning;2004.
39. Brigham TJ. Feast for the eyes: an introduction to data visualization. Med Ref Serv Q. 2016; 35(2):215–223. PMID: 27054537.
crossref pmid
40. Dowling S, Hair H, Boudreau D, Grigat D, Rice C, Born KB, et al. A patient-focused information design intervention to support the minor traumatic brain injuries (mTBI) choosing wisely canada recommendation. Cureus. 2019; 11(10):e5877. PMID: 31763100.
crossref
41. Vitzthum von Eckstaedt H 5th, Kitts AB, Swanson C, Hanley M, Krishnaraj A. Patient-centered radiology reporting for lung cancer screening. J Thorac Imaging. 2020; 35(2):85–90. PMID: 31913258.
pmid
42. Brotto LA, Nelson M, Barry L, Maher C. #ItsNotInYourHead: a social media campaign to disseminate information on provoked vestibulodynia. Arch Sex Behav. Forthcoming. 2020.
crossref
43. Nobles AL, Leas EC, Latkin CA, Dredze M, Strathdee SA, Ayers JW. #HIV: alignment of HIV-related visual content on instagram with public health priorities in the US. AIDS Behav. 2020; 24(7):2045–2053. PMID: 31916098.
crossref
44. Scott H, Fawkner S, Oliver C, Murray A. Why healthcare professionals should know a little about infographics. Br J Sports Med. 2016; 50(18):1104–1105. PMID: 27317791.
crossref pmid
45. Waye KM, Yedinak JL, Koziol J, Marshall BD. Action-focused, plain language communication for overdose prevention: a qualitative analysis of Rhode Island's overdose surveillance and information dashboard. Int J Drug Policy. 2018; 62(12):86–93. PMID: 30384027.
crossref pmid
46. Kern-Goldberger AS, Hill-Ricciuti AC, Zhou JJ, Savant AP, Rugg L, Dozor AJ, et al. Perceptions of safety monitoring in CF clinical studies and potential impact on future study participation. J Cyst Fibros. 2019; 18(4):530–535. PMID: 31151855.
crossref
47. Applequist J, Burroughs C, Ramirez A Jr, Merkel PA, Rothenberg ME, Trapnell B, et al. A novel approach to conducting clinical trials in the community setting: utilizing patient-driven platforms and social media to drive web-based patient recruitment. BMC Med Res Methodol. 2020; 20(1):58. PMID: 32169041.
crossref pmid pmc
48. Lake F. Introducing graphical and video abstracts. Biotechniques. 2018; 65(4):179. PMID: 30284933.
crossref pmid
49. Silverstein T, Cutler-Stamm J, Tucker D, Stein LP, Sklar D, Blackheart J, et al. Automated presentation of information using infographics. Updated 2015. Accessed September 27, 2020. https://patentscope.wipo.int/search/en/detail.jsf?docId=US222925161&docAn=15917058.
50. Dorneles LL, Martins VD, Morelato CS, Goes FD, Fonseca LM, Camargo RA. Development of an animated infographic on Permanent Health Education. Rev Lat Am Enfermagem. 2020; 28(7):e3311. PMID: 32696922.
crossref
TOOLS
Similar articles