Journal List > Diabetes Metab J > v.45(1) > 1146395

Baek, Lee, Lee, Kim, Kim, Jin, and Kim: Age at Diagnosis and the Risk of Diabetic Nephropathy in Young Patients with Type 1 Diabetes Mellitus

Abstract

Background

The aim of this study was to evaluate characteristics and risk of diabetic complications according to age at diagnosis among young adults with type 1 diabetes mellitus (T1DM).

Methods

A total of 255 T1DM patients aged less than 40 years were included. Patients were categorized into three groups (<20, 20 to 29, and 30 to 40 years) according to age at diagnosis. Diabetic nephropathy (DN) was defined when spot urine-albumin creatinine ratio was 300 mg/g or more and/or estimated glomerular filtration ratio (eGFR) level was 60 mL/min/1.73 m2 or less.

Results

Median age at diagnosis was 25 years and disease duration was 14 years. Individuals diagnosed with T1DM at childhood/adolescent (age <20 years) had lower stimulated C-peptide levels. They received more intensive insulin treatment with higher total daily insulin doses compared to older onset groups. The prevalence of DN was higher in the childhood/adolescent-onset group than in older onset groups (25.3% vs. 15.3% vs. 9.6%, P=0.022). The eGFR was inversely associated with disease duration whilst the degree of decrease was more prominent in the childhood/adolescent-onset group than in the later onset group (aged 30 to 40 years; P<0.001). Childhood/adolescent-onset group was independently associated with the risk of DN compared to the older onset group (aged 30 to 40 years; odds ratio, 3.47; 95% confidence interval, 1.45 to 8.33; P=0.005).

Conclusion

In individuals with childhood/adolescent-onset T1DM, the reduction in renal function is more prominent with disease duration. Early age-onset T1DM is an independent risk of DN.

Highlights

• Age at diagnosis of type 1 diabetes (T1D) is an important clinical parameter that define pathophysiology, disease courses, and several cardiometabolic risk factors of diabetes.
• Of total 255 T1D patients (age of onset < 40 years), younger age-onset group (<20 years) had longer disease duration and took more intensive insulin treatment with higher total daily insulin doses compared to older age-onset group (20-40 years).
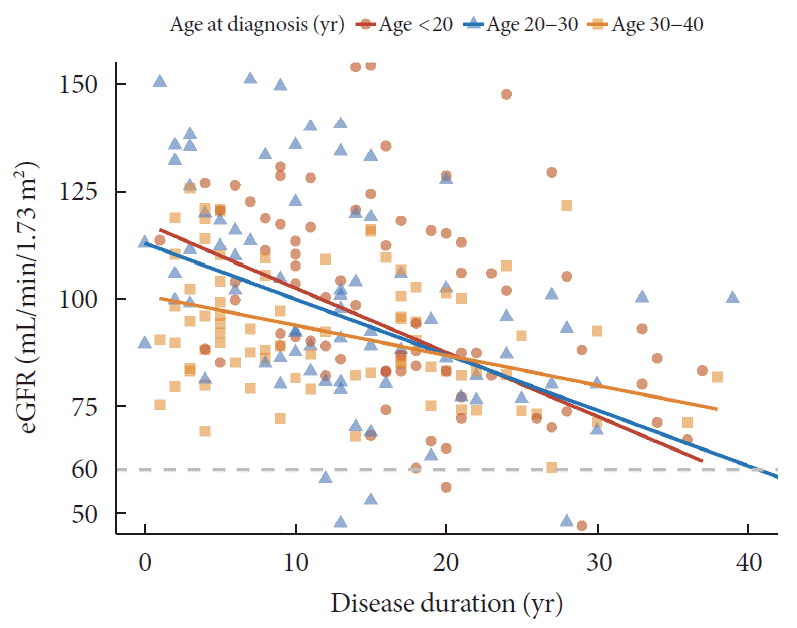
• The decrease in renal function with disease duration was more pronounced in youngest group (<20 years) than those with later onset (30-40 years).
• Younger age at diagnosis (<20 years) was independently associated with the risk of macroalbuminuria and diabetic nephropathy.

INTRODUCTION

Despite recent novel insulin preparation and advanced technology (e.g., continuous subcutaneous insulin injection with continuous glucose monitoring) [1], diabetes mellitus including type 1 diabetes mellitus (T1DM) is still associated with higher risk of cardiovascular disease (CVD) and overall premature mortality [23]. In addition, patients with T1DM have higher risk for end-stage renal disease (ESRD) from chronic kidney disease (CKD) than those with type 2 diabetes mellitus (T2DM) [4], and CKD in patients with T1DM is strongly related to CVD [56]. Macroalbuminuria which is strongly associated with progressive loss of GFR has been traditionally used to define diabetic nephropathy (DN) [7]. Meanwhile, increased albuminuria is known to be an independent predictor of prognosis in heart failure [8]. Baseline albuminuria state has a strong predictive role in the pathogenesis of coronary heart disease in patients with T1DM [9]. In the Diabetes Control and Complications Trial (DCCT) with Epidemiology of Diabetes Intervention and Complications (EDIC) study, the beneficial effect of intensive insulin treatment on lowering CVD event rates by improving glycemic control is substantially attenuated after adjusting for the presence of microalbuminuria (from P<0.001 to P=0.04) [10]. In addition, additional clinical parameters such as white blood cell counts, albuminuria, and duration of diabetes could improve the predictive power of cardiovascular risk in patients with T1DM [11].
Age at the diagnosis of T1DM is an important clinical parameter that defines pathophysiology, disease courses, and several cardiometabolic risk factors of diabetes due to various severity of immune and metabolic dysfunction [12]. Compared to childhood-onset T1DM, the rate and pattern of β-cell destruction during the course of T1DM can vary according to genetic load [13] and the presence of pancreatic β-cell auto-antibodies or its titers in adult-onset T1DM [14]. Although the incidence of typical T1DM was the highest in teenagers, more than half of incident T1DM Korean patients were 30 years or older [15]. Previous studies have shown better renal outcomes [16] or overall mortality [17] if T1DM is diagnosed before puberty in Western countries. However, the impact of age at diagnosis of T1DM on complications and its potential role in stratifying the risk have not clearly been defined yet between those who is diagnosed at childhood/adolescent (aged <20 years) and at early adult period (aged 20 to 40 years). In addition, few studies have evaluated clinical characteristics and diabetic complications according to age at diagnosis among young Asian patients with T1DM. Thus, the aim of this study was to evaluate whether childhood/adolescent-onset T1DM had different clinical characteristics compared to early adult-onset T1DM and whether age at diagnosis was associated with the risk of diabetic microvascular complications in young patients with T1DM.

METHODS

Study design and population

The study design of the original clinical trial has been described elsewhere [18]. Briefly, the original study was a multi-center, prospective cohort study that included patients with T1DM who participated in the Korea National Health Insurance Service (KNHIS) program for reimbursement of glucometer test strips between January 2011 and March 2015. Eligibility included mandatory insulin treatment and those met at least one of the following criteria: (1) fasting C-peptide <0.6 ng/mL; (2) glucagon or meal stimulated C-peptide <1.8 ng/mL; (3) positive for glutamic-acid-decarboxylase and/or other autoantibodies; (4) 24-hour urine C-peptide <30 µg/day; or (5) a history of diabetic ketoacidosis. In the original study design, clinical and biochemical factors were collected at baseline and changes in the practice of self-monitoring of blood glucose, experiences of severe hypoglycemia, and glycemic control state were compared after 1-year of follow-up. Among patients who participated in the study, we further retrospectively searched medical charts to identify the presence of diabetic microvascular complications from three hospitals (Samsung Medical Center, Asan Medical Center, and Severance Hospital) in the current study. We also reviewed detailed anthropometric, biochemical, and clinical data as well as treatment history using medical charts. Among 550 patients, we limited our analyses to young T1DM patients who developed diabetes before 40 years of age (n=421), excluding those who had atypical diabetes (e.g., latent autoimmune diabetes in adults) or long-standing T2DM. Patients (n=166) who had no clinical data about diabetic microvascular complications outcomes (urine albumin/creatinine ratio [uACR], estimated glomerular filtration ratio [eGFR], and the presence of diabetic retinopathy [DR]) were also excluded from the analysis. Creatinine clearance was calculated by the Chronic Kidney Disease Epidemiology Collaboration (CKD-EPI) equation (normal range, 90 mL/min/ 1.73 m2 or higher) [19]. Finally, a total of 255 patients were included in the current study and classified into three groups according to age at diagnosis: less than age 20, aged between 20 and 29, aged between 30 and 40. This study was approved by the Institutional Review Board of Samsung Medical Center (IRB no. 2018-07-015-001). Written informed consent by the patients was waived due to a retrospective nature of our study.

Definition of diabetic microvascular complications

The presence of diabetic microvascular complications was assessed from medical charts review. Subject were considered to have DR if they had a history of mild non-proliferative retinopathy or greater as diagnosed by ophthalmologists. The presence of DN was defined when uACR was 300 mg/g or more and/or eGFR level was less than 60 mL/min/1.73 m2. The presence or severity of diabetic neuropathy was not assessed in this study.

Anthropometric and biochemical measurements

Data of the following parameters were collected: age, gender, weight, height, body mass index (BMI), age at diagnosis, disease duration, intensity of insulin treatment, total daily insulin doses (IU/kg), fasting plasma glucose, glycosylated hemoglobin (HbA1c), systolic blood pressure (SBP), diastolic blood pressure, lipid profile, blood urea nitrogen, creatinine, uACR, eGFR, fasting C-peptide with stimulated C-peptide, smoking history, and the presence of pancreatic autoantibodies at the time of enrollment. The intensity of insulin treatment was divided into two subgroups: (1) multiple daily injection or continuous subcutaneous insulin infusion as intensive treatment, and (2) premixed insulin or neutral protamine Hagedorn insulin as conventional treatment. Patients who were prescribed any type of oral anti-diabetic drug were defined as taking oral agents. Fasting C-peptide levels were calculated after an overnight fasting (n=135) and stimulated C-peptide levels were assessed by performing either a 1 mg glucagon stimulation test (Samsung Medical Center, Asan Hospital) or a mixed meal test (Severance Hospital) (n=134) [20].

Statistical analysis

Data are expressed as median with interquartile ranges for non-evenly distributed variables. Statistical differences between groups for continuous variables were compared with Mann-Whitney U test or Fisher's exact probability test for categorical variables. Analysis of variance (ANOVA) with Tukey's test for multiple comparison was conducted to compare eGFR values and trends according to disease duration among the three age groups. Multivariate binary logistic regression analysis with forward selection was performed to identify independent factors associated with the risk of diabetic microvascular complications. In all models, we adjusted for age at diagnosis, duration of diabetes, HbA1c, SBP, BMI, and intensity of insulin treatment. Furthermore, Hosmer-Lemeshow test was performed to evaluate the goodness of fit of the logistic regression model. All statistical analyses were performed using SPSS version 24.0 (IBM Co., Armonk, NY, USA) and all statistical tests were two-tailed and the significance level was set at P<0.05.

RESULTS

Characteristics of study population

Of a total of 255 patients, the median age at diagnosis was 25 years old and the median disease duration was 14 years. Based on age at diagnosis, patients diagnosed at childhood/adolescent (aged <20 years; n=87) had longer median disease duration (16 years vs. 13 years vs. 11 years, P=0.001), lower stimulated C-peptide levels (median 0.02 ng/mL vs. 0.19 ng/mL vs. 0.27 ng/mL, P=0.047), lower BMI (21.4 kg/m2 vs. 21.9 kg/m2 vs. 22.4 kg/m2, P=0.002), and lower systolic blood pressure (median 115 mm Hg vs. 118 mm Hg vs. 121 mm Hg, P=0.022) compared to those diagnosed at older age group (20 to 29 and 30 to 40 years). However, there was no significant difference in the proportion of the use of oral anti-diabetic drugs (P=0.065), antihypertensive drugs (P=0.294), or statins usage (P=0.661) between three groups. Among those who took anti-diabetic drugs (n=60), two classes of drugs were used in this study population: metformin (48 patients, 80%) and thiazolidinedione (12 patients, 20%). Meanwhile, the younger age-onset group had higher proportion of intensive insulin treatment (81.6% vs. 60.0% vs. 57.8%, P=0.001) and higher total daily insulin doses per body weight (median 0.7 IU/kg vs. 0.6 IU/kg vs. 0.6 IU/kg, P=0.001). Patients diagnosed at childhood/adolescent had lower proportions of current/ex-smoking history than later onset groups (P=0.008).

Different patterns of the progression of CKD and albuminuria according to age at diagnosis

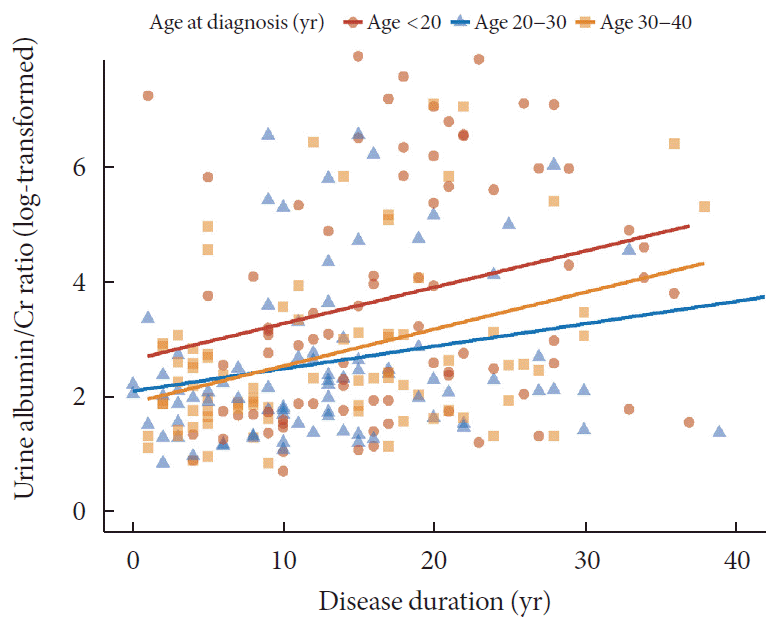
Regarding DN components, 33 (12.2%) patients had macroalbuminuria (uACR ≥300 mg/g) and 24 patients (9.4%) had CKD (eGFR <60 mL/min/1.73 m2). The eGFR was inversely associated with the duration of diabetes and the degree of decrease was more prominent in patients diagnosed at childhood/adolescent (unstandardized coefficient [B] with standard error, −2.13±0.38; aged <20 years) than those with later onset (−0.88±0.30; aged 30 to 40 years; P=0.028) (Fig. 1). Meanwhile, the trend of increasing log-transformed uACR according to disease duration was comparable among age groups (P=0.703) (Fig. 2).

Risk factors of diabetic microvascular complications in patients with T1DM

The prevalence of DR was different among the three groups (<20, 20 to 29, and 30 to 40 years: 61.9% vs. 28.9% vs. 40.2%, P<0.001). DN was significantly more common in patients diagnosed at younger age (25.3% vs. 15.3% vs. 9.6%, P=0.022) (Table 1). With regard to risk factors associated with diabetic microvascular complications, longer disease duration (odds ratio [OR], 1.08; 95% confidence interval [CI], 1.03 to 1.12; P<0.001), higher HbA1c (OR, 1.36; 95% CI, 1.13 to 1.64; P=0.001), and youngest age group (<18 years old; OR, 3.47; 95% CI, 1.45 to 8.33; P=0.005) were independently associated with the risk of DN. Meanwhile, female sex (OR, 1.89; 95% CI, 1.16 to 3.13; P=0.011), longer disease duration (OR, 1.11; 95% CI, 1.08 to 1.14; P<0.001), higher HbA1c (OR, 1.28; 95% CI, 1.12 to 1.47; P<0.001), and higher SBP (OR, 1.02; 95% CI, 1.00 to 1.04; P=0.022) were associated with DR (Table 2). When we separate the outcome of DN based on the presence of macroalbuminuria and CKD, age at diagnosis was associated with macroalbuminuria (OR, 6.43; 95% CI, 2.30 to 17.99; P<0.001), but not with CKD (OR, 2.32; 95% CI, 0.78 to 6.94; P=0.131) (Table 3).

DISCUSSION

Patients who were diagnosed with T1DM at childhood/adolescent (age <20 years old) took more intensive insulin treatment and required higher doses of daily insulin per body weight than those diagnosed at older ages (aged 20 to 40 years old). The decrease in renal function with the duration of diabetes was more pronounced in this youngest group (<20 years old) than those with later onset (30 to 40 years). The group with youngest age at diagnosis (<20 years old) was independently associated with the risk of DN, especially macroalbuminuria compared to the oldest age group (30 to 40 years old).
Higher levels of albuminuria were observed in patients diagnosed at childhood/adolescent (<20 years) regardless of the duration of diabetes. The magnitude of renal impairments associated with longer disease duration was more prominent in patients diagnosed at childhood/adolescence than those with later onset in this study. In addition, the youngest age-onset group was independently associated with higher risk of DN. In patients with T1DM, faster decline in residual β-cell function (represented by C-peptide levels) was observed in patients diagnosed at younger age [2122]. Lower levels of C-peptide [23] and higher glycemic variability [242526] are known to be associated with higher risk of diabetic complications. In addition, higher glycemic variability in T1DM is associated with the risk of microalbuminuria or progression of CKD [27]. In the present study, although baseline glycemic control state was comparable between groups, patients diagnosed at younger age were prescribed more intensive insulin treatments and higher doses of insulin per body weight. In addition, stimulated C-peptide levels were significantly lower in the group with younger age at onset. These results suggest that patients diagnosed at younger age might be vulnerable to the risk of macroalbuminuria accompanied by rapid decline in renal function due to the rapid decline in β-cell function and consequently higher glycemic variability. Thus, age at diagnosis in T1DM can be one of the important clinical parameters associated with the risk of DN.
Previous studies have shown various results on how age at diagnosis affects the risk of diabetic complications and cardiovascular outcomes according to study design and population. A recent Swedish observational cohort study has reported that developing T1DM at younger age (<10 years) is associated with a higher risk of cardiovascular complications [28]. Harjutsalo et al. [29] showed that higher mortality from ischemic heart disease was observed in women with early-onset T1DM (aged <15 years) compared to that in those with late-onset (aged 15 to 29 years). With regard to DN, previous studies have reported that the age of onset before 10 years is associated with lower risk of developing ESRD compared to those who are diagnosed at age of 20 to 34 years [30] or at age of 10 to 14 years [31]. In our study, age at diagnosis was associated with macroalbuminuria but not with CKD. Given that the incident rate of ESRD starts to rise at 15 years after diagnosis with increase to a plateau up to 25 years after diagnosis [32], it might be difficult to identify the relationship between age at diagnosis and CKD due to the relatively short duration of diabetes (median, 14 years) and the small number of patients in this study. However, the current study revealed that younger age onset group had an independent high risk for macroalbuminuria. This might explain the relationship between age at diagnosis and progression to ESRD, cardiovascular complications or the overall mortality. As a result, early detection and management of albuminuria are important, especially in those diagnosed at childhood/adolescent.
In our study, even though age at diagnosis was independently associated with the risk of DN (predominantly associated with macroalbuminuria), the presence of DR was not associated with age at diagnosis. A retrospective cohort study from Spain demonstrated that the rate of incident DR is higher in patients who were older at T1DM diagnosis compared with 0 to 9 years old group (reference group), although it is not significantly different among subgroups of those aged 10 to 44 years old [33]. Kullberg et al. [34] stated that the prevalence of DR has a non-linear correlation with age at diagnosis. It was the lowest among patients aged <5 years and increased up to 48% in those aged 15 to 19 years and then decreased to 30% in patients aged 30 to 36 years at diagnosis. The effect of age at diagnosis on the risk of DR was heterogeneous according to age group, especially for the age of 10 to 40 years old. When considering puberty that is known to be an important accelerator for DR [35], young adolescent group after puberty or late-onset group (age >45 years old) could be high risk group for DR.
This study has several limitations. First, results were drawn from patients enrolled at only three hospitals. Thus, they could not represent all Korean patients with T1DM. Second, the nature of this retrospective study limits the full evaluation of diabetic complications, and a number of missing data were excluded from this study. Moreover, the relationship between age at diagnosis and diabetic microvascular complications was not conclusive in this cross-sectional study. A large number of prospective studies are needed to determine the causal correlation between age-at-diagnosis and the progression in diabetic complications in the future. Third, we limited the age at onset to be before 40 years old to include young adult T1DM patients and exclude those who had atypical forms of T1DM or long-standing T2DM. However, the inclusion criteria according to reimbursement policy might not be enough to limit to typical T1DM patients only. Fourth, only spot albuminuria or eGFR was assessed and the progression or improvement of DN with follow-up was unavailable in this study. Fifth, time-dependent changes in glycemic control and diabetic complications were not assessed to evaluate the causal relationship between age at diagnosis and complications. Sixth, glycemic variability was not assessed directly in this study. A more detailed study using methods such as continuous glucose monitoring might enable the evaluation of the causal relationship between age at diagnosis and diabetic microvascular complications.
In conclusion, higher albuminuria with progressed renal impairments according to disease duration was observed in T1DM patients diagnosed at childhood/adolescent than those who were diagnosed at older age. In addition, younger age at diagnosis (age <20 years) was independently associated with the risk of macroalbuminuria and DN.

ACKNOWLEDGMENTS

None

Notes

CONFLICTS OF INTEREST

No potential conflict of interest relevant to this article was reported.

AUTHOR CONTRIBUTIONS

Conception or design: J.H.B., W.J.L., J.H.K.

Acquisition, analysis, or interpretation of data: W.J.L., S.K.K., G.K.

Drafting the work or revising: J.H.B., B.W.L., S.M.J.

Final approval of the manuscript: J.H.K.

FUNDING

None

References

1. Iqbal A, Novodvorsky P, Heller SR. Recent updates on type 1 diabetes mellitus management for clinicians. Diabetes Metab J. 2018; 42:3–18.
crossref pmid pmc
2. Tancredi M, Rosengren A, Svensson AM, Kosiborod M, Pivodic A, Gudbjornsdottir S, et al. Excess mortality among persons with type 2 diabetes. N Engl J Med. 2015; 373:1720–1732.
crossref
3. Secrest AM, Becker DJ, Kelsey SF, Laporte RE, Orchard TJ. Cause-specific mortality trends in a large population-based cohort with long-standing childhood-onset type 1 diabetes. Diabetes. 2010; 59:3216–3222.
crossref pmid pmc
4. Lee YB, Han K, Kim B, Jun JE, Lee SE, Ahn J, et al. Risk of end-stage renal disease from chronic kidney disease defined by decreased glomerular filtration rate in type 1 diabetes: a comparison with type 2 diabetes and the effect of metabolic syndrome. Diabetes Metab Res Rev. 2019; 35:e3197.
crossref
5. Orchard TJ, Secrest AM, Miller RG, Costacou T. In the absence of renal disease, 20 year mortality risk in type 1 diabetes is comparable to that of the general population: a report from the Pittsburgh Epidemiology of Diabetes Complications Study. Diabetologia. 2010; 53:2312–2319.
pmid pmc
6. Groop PH, Thomas MC, Moran JL, Waden J, Thorn LM, Makinen VP, et al. FinnDiane Study Group. The presence and severity of chronic kidney disease predicts all-cause mortality in type 1 diabetes. Diabetes. 2009; 58:1651–1658.
crossref pmid pmc
7. Writing Team for the Diabetes Control and Complications Trial/Epidemiology of Diabetes Interventions and Complications Research Group. Sustained effect of intensive treatment of type 1 diabetes mellitus on development and progression of diabetic nephropathy: the Epidemiology of Diabetes Interventions and Complications (EDIC) study. JAMA. 2003; 290:2159–2167.
8. Jackson CE, Solomon SD, Gerstein HC, Zetterstrand S, Olofsson B, Michelson EL, et al. CHARM Investigators and Committees. Albuminuria in chronic heart failure: prevalence and prognostic importance. Lancet. 2009; 374:543–550.
crossref
9. Soedamah-Muthu SS, Chaturvedi N, Toeller M, Ferriss B, Reboldi P, Michel G, et al. EURODIAB Prospective Complications Study Group. Risk factors for coronary heart disease in type 1 diabetic patients in Europe: the EURODIAB Prospective Complications Study. Diabetes Care. 2004; 27:530–537.
crossref pmid
10. Nathan DM, Cleary PA, Backlund JY, Genuth SM, Lachin JM, Orchard TJ, et al. Diabetes Control and Complications Trial/Epidemiology of Diabetes Interventions and Complications (DCCT/EDIC) Study Research Group. Intensive diabetes treatment and cardiovascular disease in patients with type 1 diabetes. N Engl J Med. 2005; 353:2643–2653.
crossref
11. Zgibor JC, Ruppert K, Orchard TJ, Soedamah-Muthu SS, Fuller J, Chaturvedi N, et al. Development of a coronary heart disease risk prediction model for type 1 diabetes: the Pittsburgh CHD in Type 1 Diabetes Risk Model. Diabetes Res Clin Pract. 2010; 88:314–321.
crossref pmid pmc
12. Leslie RD, Kolb H, Schloot NC, Buzzetti R, Mauricio D, De Leiva A, et al. Diabetes classification: grey zones, sound and smoke: action LADA 1. Diabetes Metab Res Rev. 2008; 24:511–519.
crossref pmid
13. Howson JM, Rosinger S, Smyth DJ, Boehm BO, Todd JA. ADBW-END Study Group. Genetic analysis of adult-onset autoimmune diabetes. Diabetes. 2011; 60:2645–2653.
crossref pmid pmc
14. Lee SA, Lee WJ, Kim EH, Yu JH, Jung CH, Koh EH, et al. Progression to insulin deficiency in Korean patients with type 2 diabetes mellitus positive for anti-GAD antibody. Diabet Med. 2011; 28:319–324.
pmid
15. Lee YB, Han K, Kim B, Jin SM, Lee SE, Jun JE, et al. High proportion of adult cases and prevalence of metabolic syndrome in type 1 diabetes mellitus population in Korea: a nationwide study. Diabetes Metab J. 2019; 43:76–89.
crossref pmid
16. Alleyn CR, Volkening LK, Wolfson J, Rodriguez-Ventura A, Wood JR, Laffel LM. Occurrence of microalbuminuria in young people with type 1 diabetes: importance of age and diabetes duration. Diabet Med. 2010; 27:532–537.
crossref pmid pmc
17. Asao K, Sarti C, Forsen T, Hyttinen V, Nishimura R, Matsushima M, et al. Diabetes Epidemiology Research International Mortality Study Group. Long-term mortality in nationwide cohorts of childhood-onset type 1 diabetes in Japan and Finland. Diabetes Care. 2003; 26:2037–2042.
crossref pmid pmc
18. Jin SM, Baek JH, Suh S, Jung CH, Lee WJ, Park CY, et al. Factors associated with greater benefit of a national reimbursement policy for blood glucose test strips in adult patients with type 1 diabetes: a prospective cohort study. J Diabetes Investig. 2017; 9:549–557.
crossref pmc
19. Levey AS, Stevens LA, Schmid CH, Zhang YL, Castro AF 3rd, Feldman HI, et al. CKD-EPI (Chronic Kidney Disease Epidemiology Collaboration). A new equation to estimate glomerular filtration rate. Ann Intern Med. 2009; 150:604–612.
crossref pmid pmc
20. Yoon HJ, Lee YH, Kim KJ, Kim SR, Kang ES, Cha BS, et al. Glycated albumin levels in patients with type 2 diabetes increase relative to HbA1c with time. Biomed Res Int. 2015; 2015:576306.
21. Kuhtreiber WM, Washer SL, Hsu E, Zhao M, Reinhold P 3rd, Burger D, et al. Low levels of C-peptide have clinical significance for established type 1 diabetes. Diabet Med. 2015; 32:1346–1353.
crossref pmid pmc
22. The DCCT Research Group. Effects of age, duration and treatment of insulin-dependent diabetes mellitus on residual beta-cell function: observations during eligibility testing for the Diabetes Control and Complications Trial (DCCT). J Clin Endocrinol Metab. 1987; 65:30–36.
pmid
23. Steffes MW, Sibley S, Jackson M, Thomas W. Beta-cell function and the development of diabetes-related complications in the diabetes control and complications trial. Diabetes Care. 2003; 26:832–836.
pmid
24. Lachin JM, Bebu I, Bergenstal RM, Pop-Busui R, Service FJ, Zinman B, et al. DCCT/EDIC Research Group. Association of glycemic variability in type 1 diabetes with progression of microvascular outcomes in the diabetes control and complications trial. Diabetes Care. 2017; 40:777–783.
crossref pmid pmc
25. Kilpatrick ES, Rigby AS, Atkin SL. A1C variability and the risk of microvascular complications in type 1 diabetes: data from the Diabetes Control and Complications Trial. Diabetes Care. 2008; 31:2198–2202.
crossref pmid pmc
26. Kilpatrick ES, Rigby AS, Atkin SL. The effect of glucose variability on the risk of microvascular complications in type 1 diabetes. Diabetes Care. 2006; 29:1486–1490.
crossref pmid
27. Gorst C, Kwok CS, Aslam S, Buchan I, Kontopantelis E, Myint PK, et al. Long-term glycemic variability and risk of adverse outcomes: a systematic review and meta-analysis. Diabetes Care. 2015; 38:2354–2369.
crossref pmid
28. Rawshani A, Sattar N, Franzen S, Rawshani A, Hattersley AT, Svensson AM, et al. Excess mortality and cardiovascular disease in young adults with type 1 diabetes in relation to age at onset: a nationwide, register-based cohort study. Lancet. 2018; 392:477–486.
crossref
29. Harjutsalo V, Maric-Bilkan C, Forsblom C, Groop PH. Impact of sex and age at onset of diabetes on mortality from ischemic heart disease in patients with type 1 diabetes. Diabetes Care. 2014; 37:144–148.
crossref pmid
30. Mollsten A, Svensson M, Waernbaum I, Berhan Y, Schon S, Nystrom L, et al. Swedish Childhood Diabetes Study Group. Diabetes Incidence Study in Sweden. Swedish Renal Registry. Cumulative risk, age at onset, and sex-specific differences for developing end-stage renal disease in young patients with type 1 diabetes: a nationwide population-based cohort study. Diabetes. 2010; 59:1803–1808.
crossref
31. Svensson M, Nystrom L, Schon S, Dahlquist G. Age at onset of childhood-onset type 1 diabetes and the development of end-stage renal disease: a nationwide population-based study. Diabetes Care. 2006; 29:538–542.
crossref pmid
32. Helve J, Sund R, Arffman M, Harjutsalo V, Groop PH, Gronhagen-Riska C, et al. Incidence of end-stage renal disease in patients with type 1 diabetes. Diabetes Care. 2018; 41:434–439.
crossref pmid
33. Forga L, Goni MJ, Ibanez B, Cambra K, Garcia-Mouriz M, Iriarte A. Influence of age at diagnosis and time-dependent risk factors on the development of diabetic retinopathy in patients with type 1 diabetes. J Diabetes Res. 2016; 2016:9898309.
crossref
34. Kullberg CE, Abrahamsson M, Arnqvist HJ, Finnstrom K, Ludvigsson J. VISS Study Group. Prevalence of retinopathy differs with age at onset of diabetes in a population of patients with type 1 diabetes. Diabet Med. 2002; 19:924–931.
crossref pmid
35. Cho YH, Craig ME, Donaghue KC. Puberty as an accelerator for diabetes complications. Pediatr Diabetes. 2014; 15:18–26.
crossref
Fig. 1

Relation between disease duration and estimated glomerular filtration ratio (eGFR) according to age at diagnosis.

dmj-2019-0134f1.tif
Fig. 2

Relation between disease duration and urine albumin-creatinine ratio (log transformation) according to age at diagnosis.

dmj-2019-0134f2.tif
Table 1.
Baseline characteristics of young patients with type 1 diabetes mellitus stratified by age at diagnosis
Characteristic Total <20 years of age 20–29 years of age 30–40 years of age P value
Number 255 87 85 83
Age of onset, yr 25 (18–32) 16 (13–18) 26 (23–27) 33 (32–37) <0.001
Age of registration, yr 36 (31–44) 31 (26–36) 37 (31–42) 45 (38–52) <0.001
Disease duration, yr 14 (8–20) 16 (11–22) 13 (7–19) 11 (5–19) 0.001
Male sex 126 (49.4) 37 (42.5) 45 (52.9) 44 (53.0) 0.286
FHx. of diabetes 63 (24.7) 27 (31.0) 18 (21.2) 18 (21.7) 0.418
BMI, kg/m2 22.3 (20.5–24.5) 21.4 (19.4–23.8) 22.9 (20.7–24.6) 22.5 (20.9–24.6) 0.022
SBP, mm Hg 118 (110–128) 115 (107–125) 118 (111–127) 121 (110–135) 0.019
DBP, mm Hg 70 (64–79) 70 (63–78) 71 (64–78) 70 (65–80) 0.609
Total cholesterol, mg/dL 167 (148–190) 164 (149–193) 168 (148–186) 168 (147–195) 0.897
TG, mg/dL 76 (55–105) 73 (53–107) 76 (57–100) 79 (56–111) 0.833
HDL-C, mg/dL 61 (50–75) 60 (49–74) 63 (50–76) 59 (50–73) 0.639
LDL-C, mg/dL 91 (76–109) 93 (77–108) 90 (73–109) 90 (75–109) 0.781
BUN, mg/dL 14.8 (12.0–19.5) 15.0 (11.2–20.1) 16.1 (12.5–21.1) 14.0 (12.0–16.9) 0.172
Creatinine, mg/dL 0.8 (0.7–1.0) 0.8 (0.7–1.1) 0.8 (0.7–1.0) 0.8 (0.7–1.0) 0.858
uACR, mg/g 9.7 (4.7–47.0) 20.7 (4.9–59.4) 7.3 (3.7–14.7) 9.2 (4.8–20.7) 0.002
eGFR, mL/min/1.73 m² 91.8 (80.1–110.7) 90.1 (75.5–114.2) 95.0 (80.0–115.7) 90.3 (82.0–102.4) 0.524
FPG, mg/dL 150 (102–186) 132 (102–190) 131 (100–175) 140 (97–195) 0.704
HbA1c, % 7.9 (7.0–9.0) 7.6 (7.0–8.9) 7.8 (7.0–8.8) 8.2 (7.0–9.1) 0.419
Fasting C-peptide, ng/mL 0.07 (0.02–0.43) 0.02 (0.01–0.16) 0.08 (0.02–0.43) 0.19 (0.02–0.48) 0.094
Stimulated C-peptide, ng/mL 0.10 (0.02–0.60) 0.02 (0.01–0.38) 0.19 (0.02–0.63) 0.27 (0.02–0.68) 0.047
Presence of autoantibodya 87 (51.8) 27 (52.9) 37 (59.7) 23 (41.8) 0.152
 Anti-GAD Ab 82 (94.3) 24 (88.9) 36 (97.3) 22 (95.7)
 Other autoantibodies 5 (5.7) 3 (11.1) 1 (2.7) 1 (4.3)
Intensive insulin treatment 170 (66.7) 71 (81.6) 51 (60.0) 48 (57.8) 0.001
Total daily insulin dose, IU/kg 0.64 (0.52–0.79) 0.7 (0.6–0.9) 0.6 (0.5–0.8) 0.6 (0.5–0.7) 0.001
Medication use
 Oral glucose lowering drugs 60 (23.5) 14 (16.1) 20 (23.5) 26 (31.3) 0.065
 Antihypertensive drugs 67 (26.3) 28 (32.2) 19 (22.4) 20 (24.1) 0.294
 Statins 66 (25.9) 24 (27.6) 19 (22.4) 23 (27.7) 0.661
Smoking 0.008
 Current smoker 31 (12.2) 6 (7.4) 7 (9.6) 18 (24.0)
 Ex-smoker 39 (15.3) 10 (12.3) 16 (21.9) 13 (17.3)
 Non-smoker 159 (62.4) 65 (80.2) 50 (68.5) 44 (58.7)
Diabetic retinopathy 109 (42.7) 52 (61.9) 24 (28.9) 33 (40.2) <0.001
Diabetic nephropathy 43 (16.9) 22 (25.3) 13 (15.3) 8 (9.6) 0.022

Values are presented as median (interquartile range) or number (%). Intensive insulin treatment, multiple daily injection or continuous subcutaneous insulin injection; Diabetic retinopathy, the presence of mild non-proliferative retinopathy or more; Diabetic nephropathy, uACR ≥300 mg/g or eGFR ≤60 mL/min/1.73 m2.

FHx, family history; BMI, body mass index; SBP, systolic blood pressure; DBP, diastolic blood pressure; TG, triglyceride; HDL-C, high-density lipoprotein cholesterol; LDL-C, low density lipoprotein cholesterol; BUN, blood urea nitrogen; uACR, urine albumin-creatinine ratio; eGFR, estimated glomerular filtration ratio; FPG, fasting plasma glucose; HbA1c, glycosylated hemoglobin; anti-GAD Ab, anti-glutamic acid decarboxylase antibody.

a n=168.

Table 2.
Risk factors associated with diabetic complications
Variable Diabetic nephropathy
Diabetic retinopathy
OR (95% CI) P value OR (95% CI) P value
Male sex 0.94 (0.47–1.88) 0.936 0.53 (0.32–0.86) 0.011
Disease duration, yr 1.08 (1.03–1.12) <0.001 1.11 (1.08–1.14) <0.001
HbA1c, % 1.36 (1.13–1.64) 0.001 1.28 (1.12–1.47) <0.001
SBP, mm Hg 1.02 (0.99–1.04) 0.160 1.02 (1.00–1.04) 0.022
BMI, kg/m2 0.95 (0.86–1.05) 0.319 0.99 (0.91–1.06) 0.708
Intensive insulin treatment 0.96 (0.46–2.01) 0.917 0.85 (0.50–1.44) 0.537
Age at diagnosis groups, yr 0.020 0.916
 <20 3.47 (1.45–8.33) 0.005 1.12 (0.63–1.99) 0.701
 20–29 1.80 (0.77–4.24) 0.177 1.01 (0.57–1.78) 0.975
 30–40 1 (reference) - 1 (reference) -

Intensive insulin treatment, multiple daily injection or continuous subcutaneous insulin injection.

OR, odds ratio; CI, confidence interval; HbA1c, glycosylated hemoglobin; SBP, systolic blood pressure; BMI, body mass index.

Table 3.
Risk factors associated with macroalbuminuria or chronic kidney disease
Variable Macroalbuminuria
Chronic kidney disease
OR (95% CI) P value OR (95% CI) P value
Male sex 0.62 (0.27–1.43) 0.264 1.21 (0.53–2.78) 0.651
Disease duration, yr 1.09 (1.04–1.14) <0.001 1.09 (1.04–1.14) <0.001
HbA1c, % 1.46 (1.18–1.79) <0.001 1.25 (1.01–1.55) 0.036
SBP, mm Hg 1.01 (0.98–1.03) 0.652 1.02 (0.99–1.04) 0.195
BMI, kg/m2 0.95 (0.85–1.07) 0.408 0.98 (0.87–1.10) 0.730
Intensive insulin treatment 0.47 (0.20–1.12) 0.090 0.29 (0.09–0.92) 0.036
Age at diagnosis groups, yr
 <20 6.43 (2.30–17.99) <0.001 2.32 (0.78–6.94) 0.131
 20–29 1.47 (0.48–4.51) 0.502 2.85 (0.97–8.32) 0.056
 30–40 1 (reference) - 1 (reference) -

Intensive insulin treatment, multiple daily injection or continuous subcutaneous insulin injection.

OR, odds ratio; CI, confidence interval; HbA1c, glycosylated hemoglobin; SBP, systolic blood pressure; BMI, body mass index.

TOOLS
Similar articles