INTRODUCTION
MATERIALS AND METHODS
Interlaboratory comparison scheme
Preparation of test samples
Details of participating laboratories
Table 1
| Laboratory code | Test drugs | Internal standard | LC manufacturer* | MS instrument manufacturer* | MS instrument model |
|---|---|---|---|---|---|
| A | TAC+SIR+EVE | Ascomycin+SIR-d3+EVE-d4 | Shimadzu | SCIEX | Triple Quad 4500 |
| CSA | CSD | Agilent | Agilent | 6460 Triple Quadrupole | |
| MPA | Indomethacin | Waters | Waters | Quattro Micro | |
| B | TAC+SIR+EVE+CSA | Ascomycin | Waters | Waters | Quattro Premier |
| C | TAC+SIR+EVE | Ascomycin+SIR-d3+EVE-d4 | Waters | Waters | Xevo TQ-S |
| D | TAC+CSA | Ascomycin+CSD | Waters | Waters | Xevo TQD |
| MPA | Indomethacin | Waters | Waters | Xevo TQD | |
| E | TAC+SIR+EVE | Ascomycin | Waters | Waters | Xevo TQD |
| CSA | CSD | Waters | Waters | Xevo TQD | |
| F | TAC+SIR+EVE+CSA | Ascomycin+EVE-d4+CSD | Agilent | Agilent | 6490 Triple Quadrupole |
| G | TAC+SIR+EVE+CSA | Ascomycin+SIR-d3+EVE-d4+CSD | Agilent | SCIEX | API 4000 |
| H | TAC+SIR+EVE+CSA | TAC-13C,d2+SIR-d3+EVE-d4+CSA-d4 | Agilent | SCIEX | API 3200 |
| I | TAC+SIR+EVE+CSA | Ascomycin | Agilent | SCIEX | QTRAP 5500 |
| MPA | MPA-d3 | Agilent | SCIEX | QTRAP 5500 | |
| J | TAC+SIR+EVE+CSA | Ascomycin+CSD | Agilent | SCIEX | Triple Quad 3500 |
Most laboratories used precipitation with organic solvent mixture followed by centrifugation for extraction, except Lab I, which used liquid/liquid extraction. All the participating laboratories used the commercial calibrator from Chromsystems Instruments & Chemicals GmbH (Gräfelfing, Germany).
Evaluation of calibrator reconstitution method and storage as calibration bias factors
Statistical analysis
RESULTS
Homogeneity and short-term stability of TAC-2
Measurement results of the participating laboratories
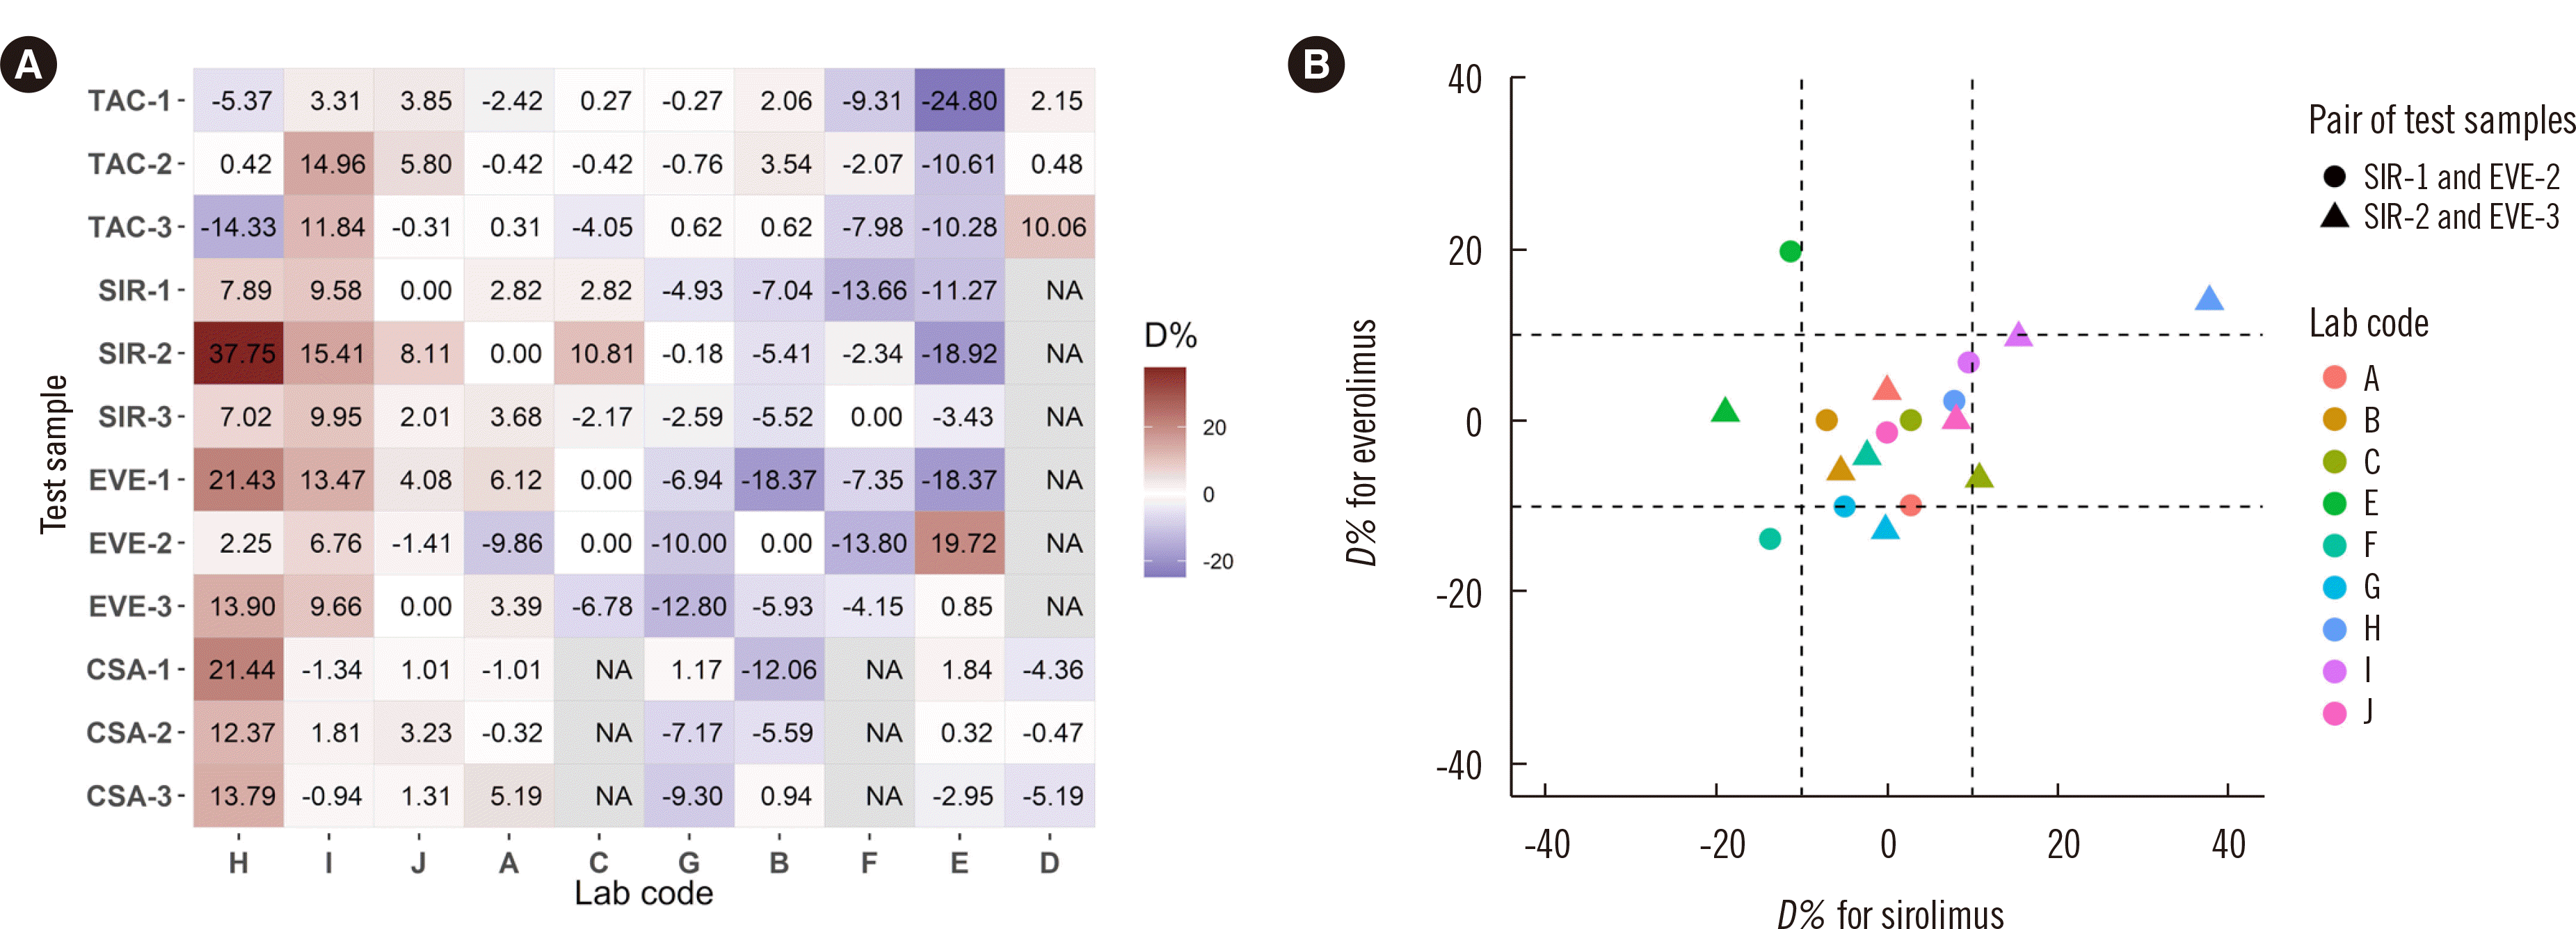
 | Fig. 1Correlation between the test samples. (A) The percent difference in individual laboratory results (D%) for each test sample. The cells are colored according to the D% values. The laboratory order is based on the average of the D% values, except for Lab E and Lab D, for pattern readability. (B) Correlation of D% values for test samples with similar concentrations for SIR and EVE. Test sample pairs are indicated by a triangle or circle, and the colors indicate the laboratory code.
Abbreviations: CSA, cyclosporine; EVE, everolimus; NA, not available; SIR, sirolimus; TAC, tacrolimus.
|
Table 2
Calibrator reconstitution and storage conditions experiment
Table 3
Table 4
| Experiment | Drug | Condition | Coefficient β2 (95% CI) | P* | Expected concentration at 6 ng/mL (%diff) | |
|---|---|---|---|---|---|---|
| Reconstitution | TAC | A0 | Baseline | 6.000 | (Baseline) | |
| B0 | 0.00012 (-0.00034–0.00058) | 0.612 | 5.997 | (-0.049) | ||
| SIR | A0 | Baseline | 6.000 | (Baseline) | ||
| B0 | -0.00005 (-0.00043–0.00032) | 0.772 | 6.002 | (0.029) | ||
| EVE | A0 | Baseline | 6.000 | (Baseline) | ||
| B0 | -0.00015 (-0.00036–0.00005) | 0.141 | 6.007 | (0.112) | ||
| Storage | TAC | A1 | Baseline | 6.000 | (Baseline) | |
| A2 | -0.00037 (-0.00102–0.00028) | 0.257 | 6.009 | (0.143) | ||
| A3 | -0.00028 (-0.00093–0.00037) | 0.386 | 6.007 | (0.109) | ||
| A4 | -0.00022 (-0.00087–0.00043) | 0.496 | 6.005 | (0.086) | ||
| SIR | A1 | Baseline | 6.000 | (Baseline) | ||
| A2 | -0.00157 (-0.00239–-0.00076) | < 0.001 | 6.033 | (0.555) | ||
| A3 | -0.00091 (-0.00173–-0.00009) | 0.030 | 6.019 | (0.321) | ||
| A4 | -0.00061 (-0.00143–0.00020) | 0.138 | 6.013 | (0.217) | ||
| EVE | A1 | Baseline | 6.000 | (Baseline) | ||
| A2 | -0.00043 (-0.00098–0.00012) | 0.121 | 6.013 | (0.222) | ||
| A3 | -0.00117 (-0.00172–-0.00062) | < 0.001 | 6.036 | (0.598) | ||
| A4 | -0.00075 (-0.00130–-0.00020) | 0.009 | 6.023 | (0.384) |


 PDF
PDF Citation
 Print
Print


 XML Download