INTRODUCTION
MATERIALS AND METHODS
Sample collection and data acquisition
Table 1
Abbreviations: CTx, chemotherapy; CR, complete remission; RD, residual disease; SCT, stem cell transplantation; VTD, vincristine/thalidomide/dexamethasone; TD, thalidomide/dexamethasone; VMP, vincristine/melphalan/prednisolone; HD-Dexa, high-dose dexamethasone; TCD, thalidomide/cycolophosphamide/dexamethasone; R-ISS, revised international staging system; CTx-CR, with complete remission after chemotherapy; CTx-RD, with residual disease after chemotherapy; SCT-CR, with complete remission after stem cell transplantation; SCT-RD, with residual disease after stem cell transplantation; BM, bone marrow; t, translocation; del, deletion.
Flow cytometric measurement of PD-1 expression on T cell subsets
Statistical analysis
RESULTS
PD-1 expression on CD4+ T cells
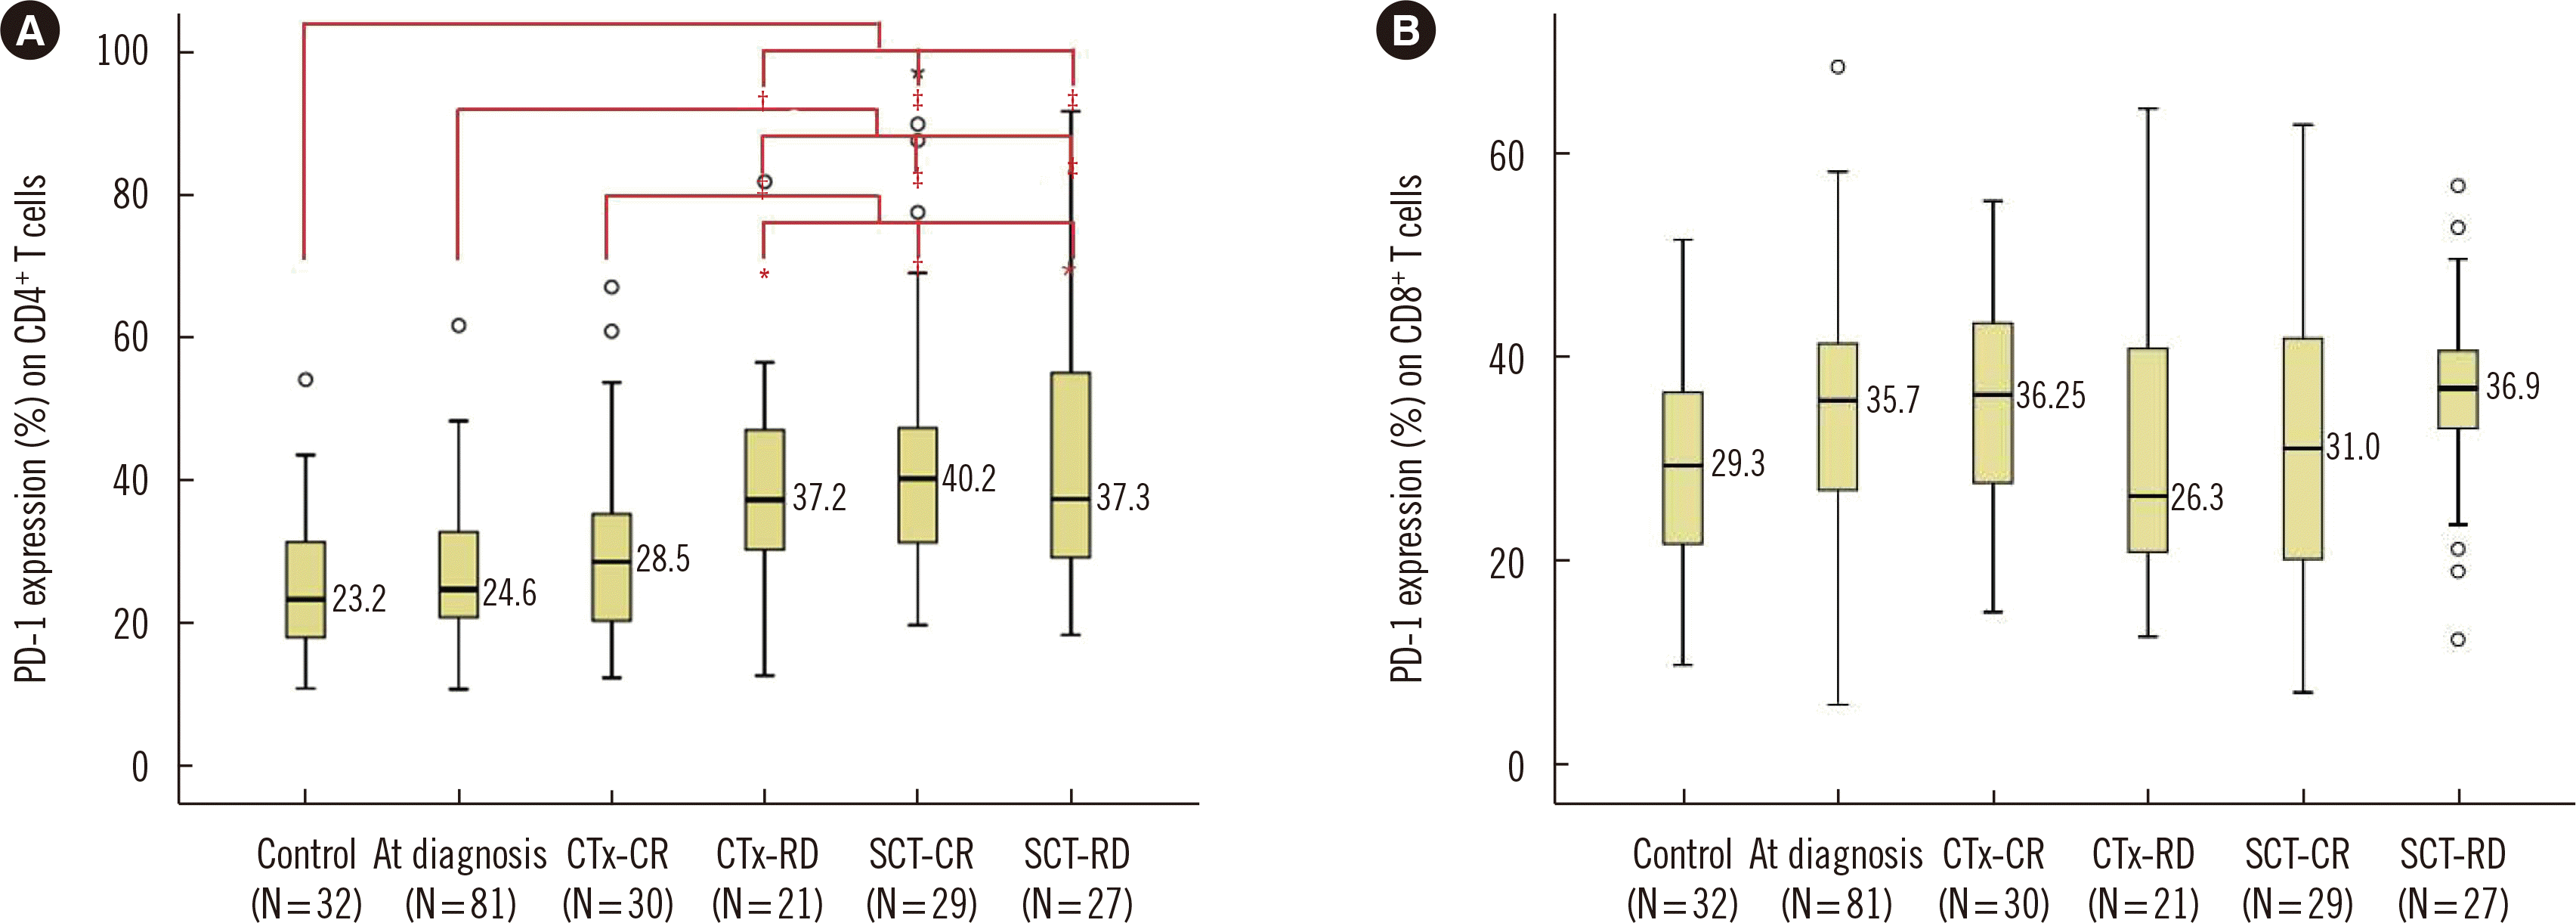
 | Fig. 1Percentages of PD-1 expression on (A) CD4+ T cells and (B) CD8+ T cells in the controls and PCM patients with various disease states. In each box plot, the median value is reported beside the box. The upper end, lower end, and inner line of the boxes correspond to the 3rd quartile, 1st quartile, and median value, respectively. Error bars denote minimum and maximum values, and circles indicate outlier values. Statistically significant differences are marked with *if P<0.05, with †if P<0.01, and with ‡if P<0.001.
Abbreviations: CTx-CR, complete remission after chemotherapy; CTx-RD, residual disease after chemotherapy; PD-1, immune checkpoint programmed cell death protein-1; PCM, Plasma cell myeloma; SCT-CR, complete remission after stem cell transplantation; SCT-RD, residual disease after stem cell transplantation.
|
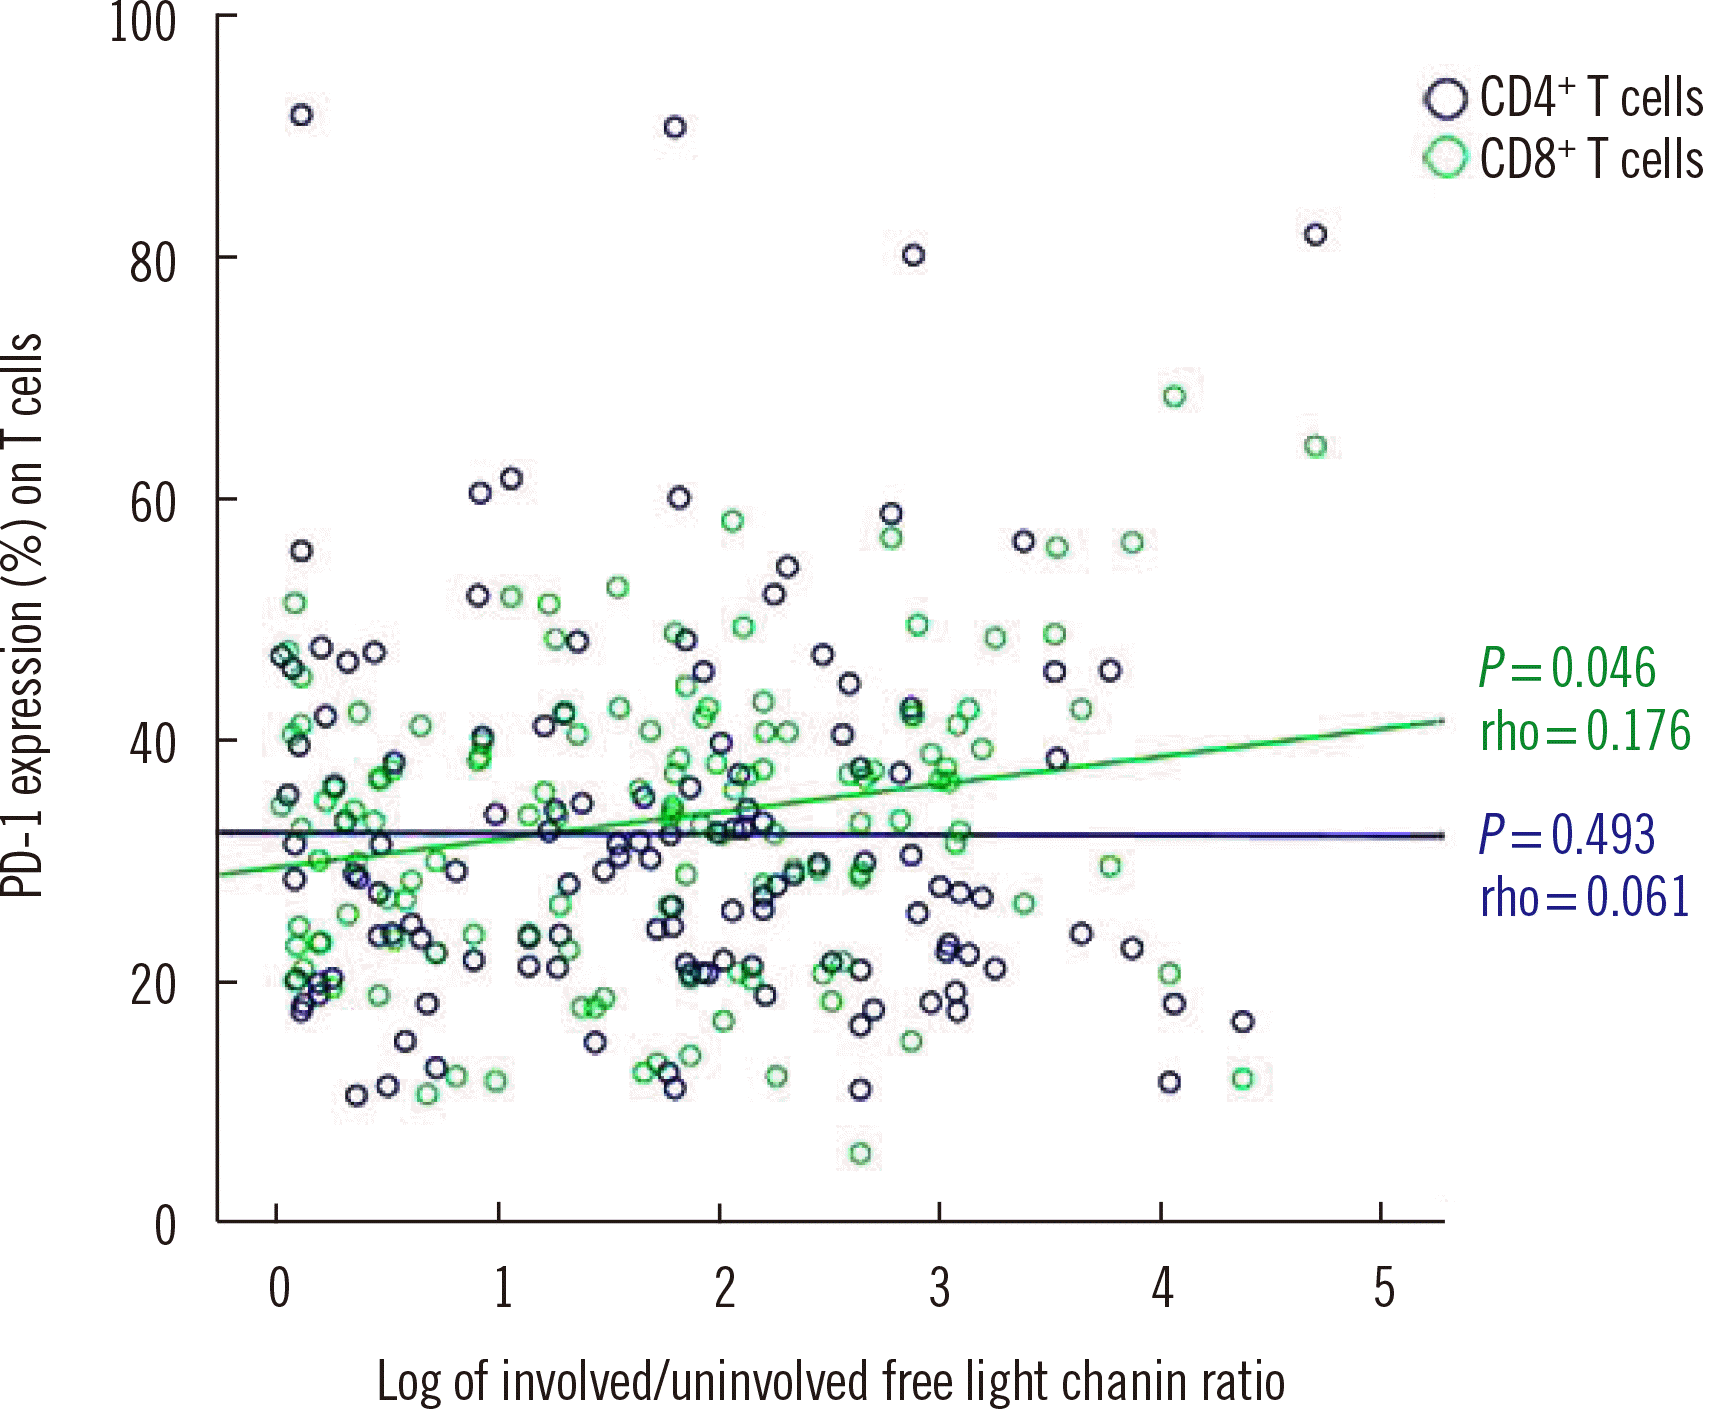
 | Fig. 2Correlation between PD-1 expression on T cell subsets and involved/uninvolved free light chain ratio in PCM. The PD-1 expression on CD8+ T cells was weakly correlated with involved/uninvolved free light chain ratio; however, the PD-1 expression on CD4+ T cells was not correlated with involved/uninvolved free light chain ratio.
Abbreviations: PCM, plasma cell myeloma; PD-1, immune checkpoint programmed cell death protein-1.
|
PD-1 expression on CD8+ T cells
PD-1 expression on T cell subsets according to cytogenetic abnormalities
Table 2
| Cytogenetic abnormalities | PD-1 expression | Difference in PD-1 expression |
|---|---|---|
| Monosomy 13 (N = 40) vs. NL* (N = 59) | CD4+ T cells | Not significant (P = 0.884) |
| CD8+ T cells | High (P = 0.020) | |
| 1q gain (N = 29) vs. NL (N = 59) | CD4+ T cells | Not significant (P = 0.214) |
| CD8+ T cells | High (P = 0.011) | |
| Complex (N = 59) vs. NL (N = 59) | CD4+ T cells | Not significant (P = 0.657) |
| CD8+ T cells | High (P = 0.041) | |
| Hypodiploidy (N = 20) vs. NL (N = 59) | CD4+ T cells | Not significant (P = 0.727) |
| CD8+ T cells | High (P = 0.032) | |
| Hyperdiploidy (N = 29) vs. NL (N = 59) | CD4+ T cells | Not significant (P = 0.149) |
| CD8+ T cells | Not significant (P = 0.162) | |
| t(11;14) (N = 17) vs. NL (N = 59) | CD4+ T cells | Not significant (P = 0.852) |
| CD8+ T cells | Not significant (P = 0.251) |
Serial changes in PD-1 expression on T-cell subsets
Table 3
*Classified as RD, but PD-1 expression on CD4+ T cells was decreased; †Classified as CR, but PD-1 expression on CD4+ T cells was increased; ‡Reappearance of M protein in the next follow-up protein electrophoresis; §Immunoglobulin isotype switch; ∥Follow-up loss.
Abbreviations: M, male; F, female; CTx, chemotherapy; CR, complete remission; RD, residual disease; SCT, stem cell transplantation; reSCT; second stem cell transplantation; BM, bone marrow; PD-1, immune checkpoint programmed cell death protein-1; CTx-CR, complete remission after chemotherapy; SCT-RD, residual disease after stem cell transplantation; SCT-CR, complete remission after stem cell transplantation; CTx-RD, residual disease after chemotherap


 PDF
PDF Citation
 Print
Print


 XML Download