INTRODUCTION
MATERIALS AND METHODS
Clinical setting and switch to the Barricor tube (September 1, 2017)
Routine chemical tests
TAT
Hemolysis index
Statistical analysis
RESULTS
Biochemical tests
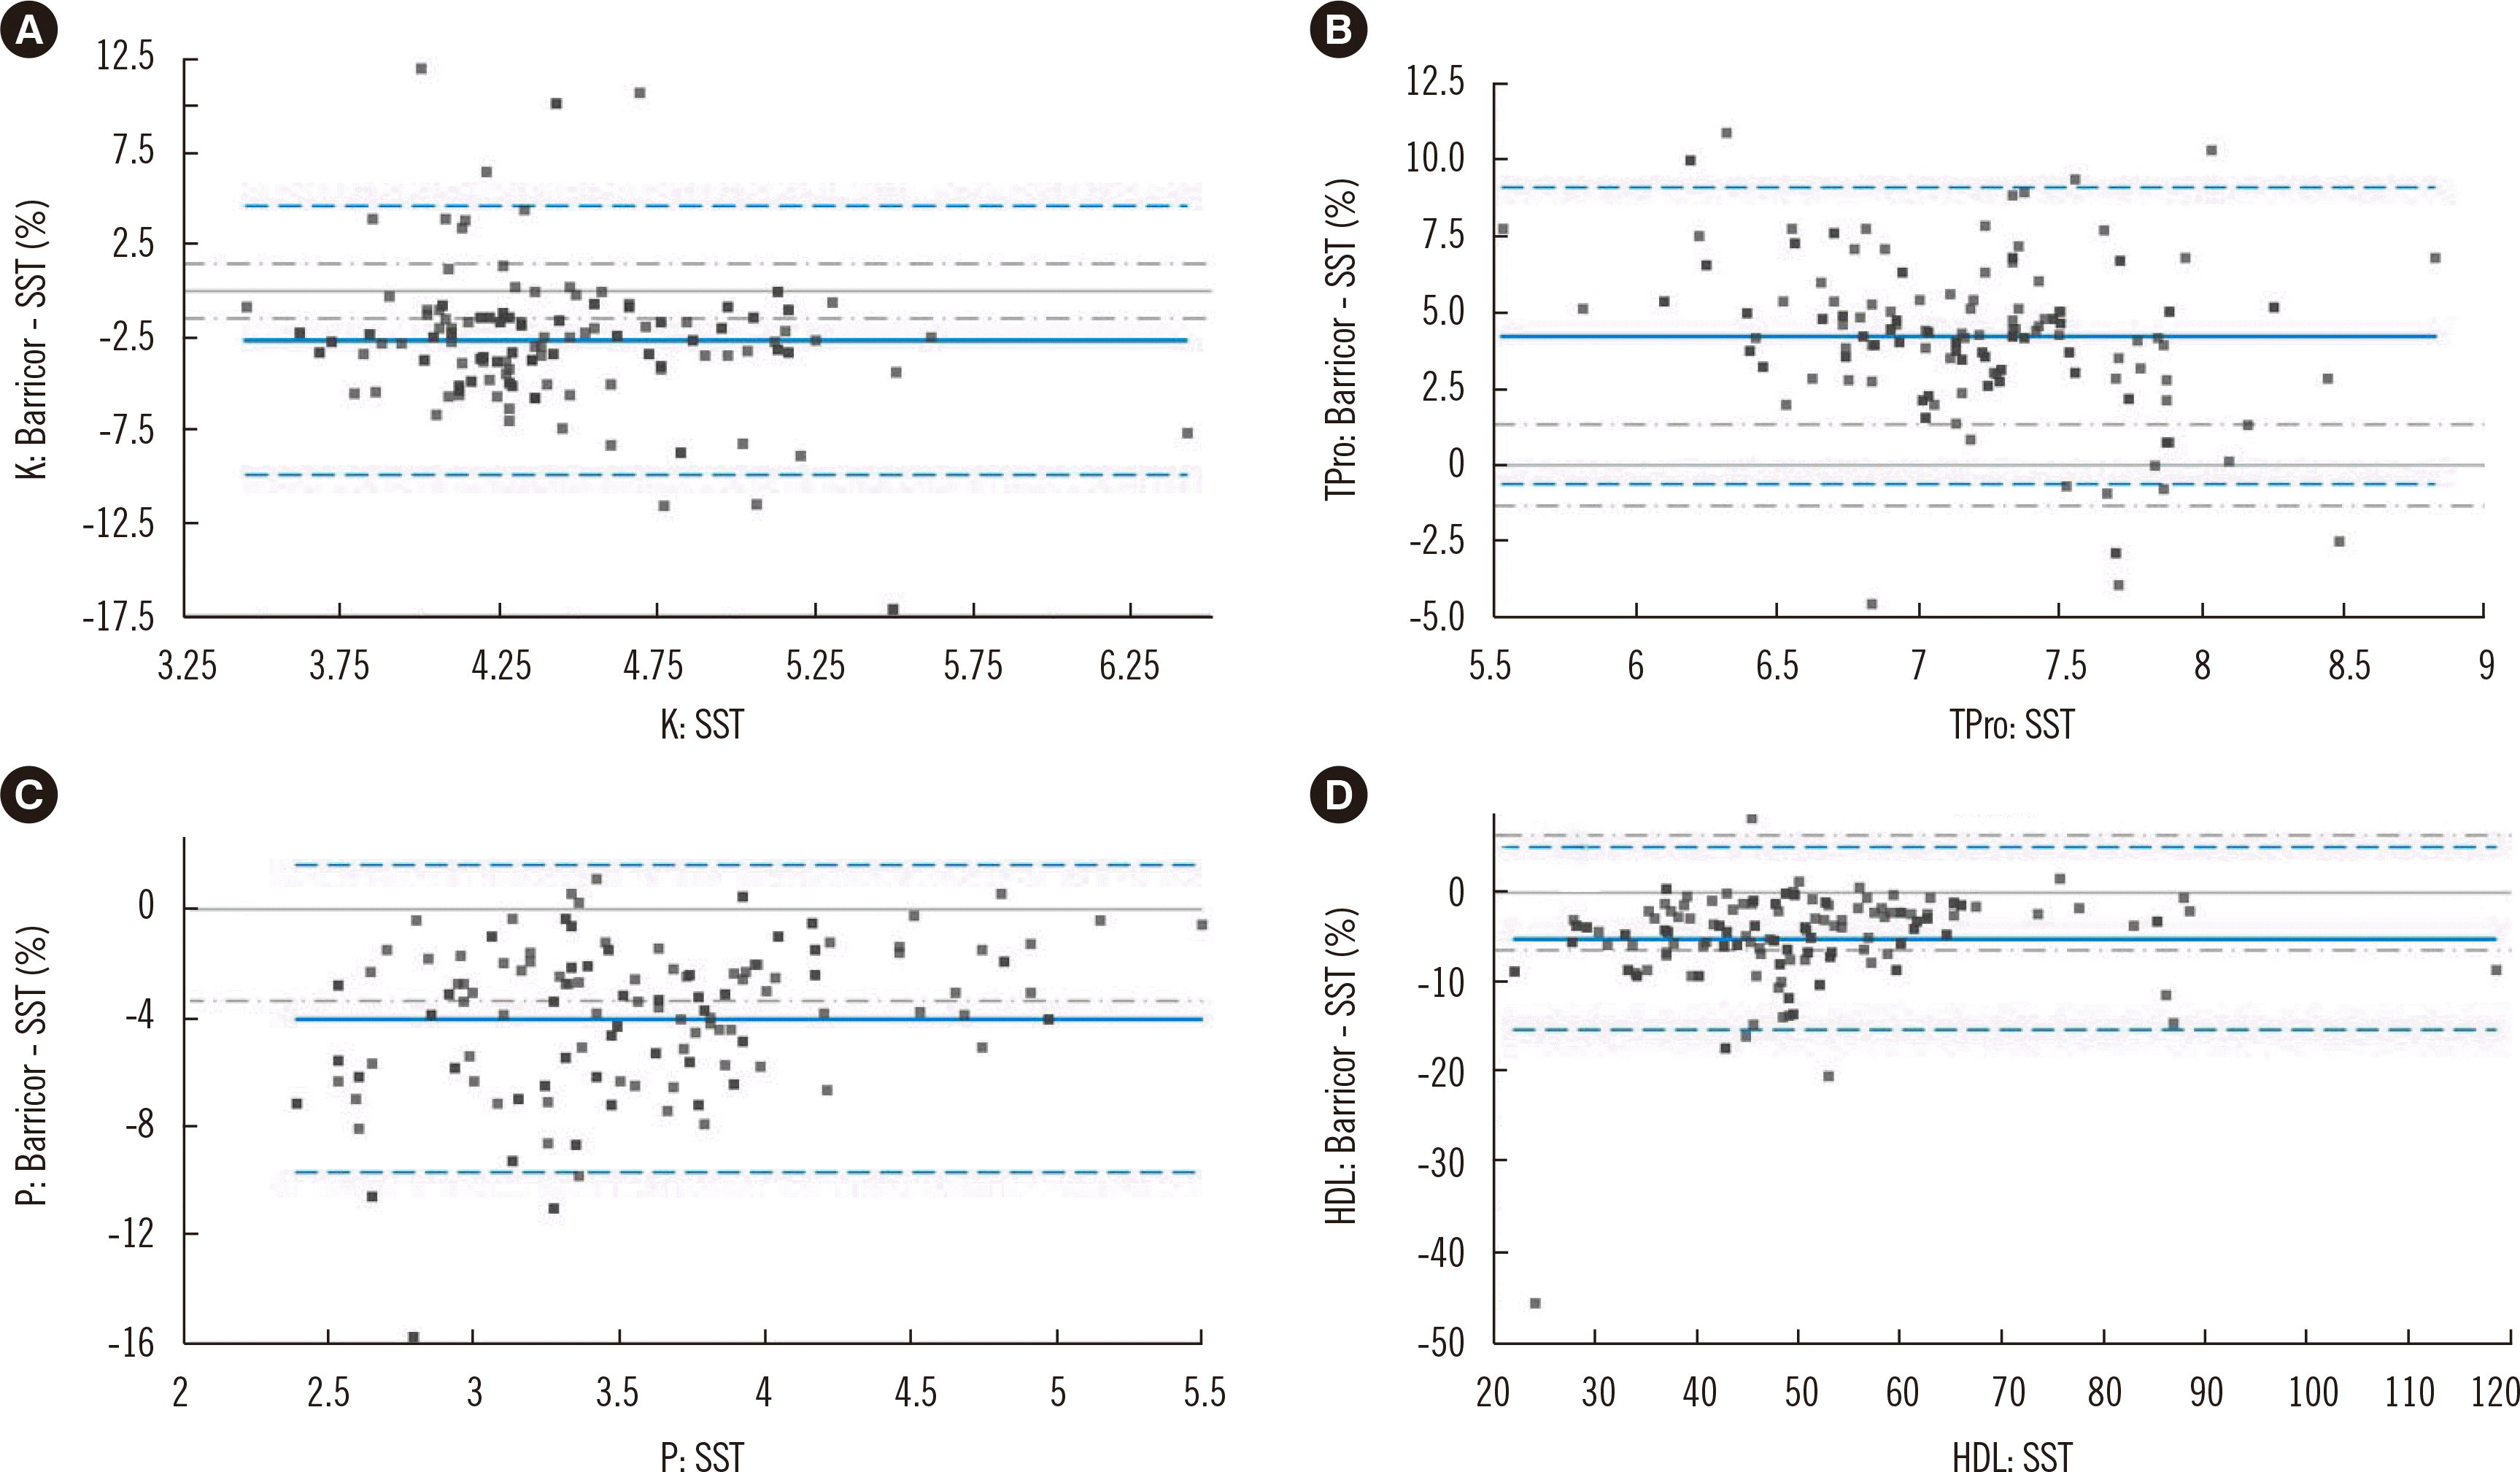
 | Fig. 1Some analytes showed bias between the SST and the Barricor tube. Bland–Altman percent bias plots for K, Tpro, P, and HDL for the two tubes in 166 patients. Blue solid line, mean percent bias; blue broken lines, 95% LoA; gray broken lines, allowable percent bias. Detailed values of mean bias, 95% LoA, and allowable percent bias are described in Table 1.
Abbreviations: HDL, high-density lipoprotein cholesterol; K, potassium; LoA, limit of agreement; P, phosphorus; SST, serum separator tube; Tpro, total protein.
|
Table 1
| Analyte | Unit | Measured range | Mean % difference | 95% limit of agreement | Allowable % bias | P | Comments on unallowable bias |
|---|---|---|---|---|---|---|---|
| Alb | g/L | 24.1–53.5 | −0.19 | −4.26–3.88 | 1.43 | 0.5316 | |
| ALP | μkat/L | 0.69–7.75 | −3.37 | −7.98–1.24 | 6.10 | < 0.0001 | |
| ALT | μkat/L | 0.14–5.37 | −8.57 | −27.93–10.78 | 7.75 | < 0.0001 | Low ALT level |
| Amy | μkat/L | 0.16–3.04 | −0.24 | −5.45–4.96 | 7.73 | 0.3384 | |
| AST | μkat/L | 0.16–5.86 | −2.34 | −16.92–12.24 | 5.63 | < 0.0001 | |
| BUN | mmol/L | 3.25–45.7 | −0.51 | −3.93–2.9 | 6.15 | 0.0003 | |
| Ca | mmol/L | 1.89–2.48 | −1.35 | −5.24–2.54 | 0.82* | < 0.0001 | Strict allowable bias criteria |
| Chol | mmol/L | 2.06–9.96 | −2.17 | −5.8–1.46 | 4.52 | < 0.0001 | |
| CK | μkat/L | 0.21–9.81 | −0.82 | −14.14–12.5 | 8.90 | 0.0005 | |
| Cl | mmol/L | 95.6–112.2 | 0 | −2.17–2.16 | 0.43 | 0.0547 | |
| CO2 | mmol/L | 14.8–29 | 18.12 | −1.93–38.18 | 1.68* | < 0.0001 | Impaired stability, strict bias criteria |
| Cre | μmol/L | 38.9–746.1 | −2.26 | −8.14–3.61 | 3.75 | < 0.0001 | |
| CRP | mg/L | 0.07–189 | −1.85 | −14.29–10.6 | 23.65 | < 0.0001 | |
| Dbil | μmol/L | 0.51–226.29 | 13.4 | −78.49–105.3 | 14.19* | 0.053 | |
| GGT | μkat/L | 0.14–29.02 | −1.74 | −11.86–8.38 | 10.56 | < 0.0001 | |
| Glu | mmol/L | 4.30–17.65 | −1.35 | −5.71–3.01 | 2.38 | < 0.0001 | |
| HDL | mmol/L | 0.57–3.07 | −5.06 | −15.19–5.08 | 6.34 | < 0.0001 | Allowable but significant |
| K | mmol/L | 3.45–6.42 | −2.69 | −9.91–4.53 | 1.47 | < 0.0001 | Unallowable bias |
| LDH | μkat/L | 4.11–38.6 | −0.87 | −15.09–13.36 | 3.38 | 0.0167 | |
| LDL | mmol/L | 0.61–251.3 | −1.7 | −6.84–3.45 | 6.85 | < 0.0001 | |
| Lip | μkat/L | 0.07–2.43 | −1.29 | −7.96–5.38 | 6.61 | < 0.0001 | |
| Mg | mmol/L | 0.51–1.10 | −1.72 | −7.22–3.78 | 1.84* | < 0.0001 | |
| Na | mmol/L | 126.7–147.8 | 0.13 | −2.19–2.45 | 0.30 | 0.0001 | |
| P | mmol/L | 0.77–1.78 | −4.02 | −9.71–1.67 | 3.38* | < 0.0001 | Unallowable bias |
| Tbil | μmol/L | 4.45–470.19 | 1.24 | −5.92–8.4 | 8.95* | 0.0004 | |
| TG | mmol/L | 0.41–8.59 | −2.14 | −5.44–1.15 | 10.23 | < 0.0001 | |
| Tpro | g/L | 55.3–88.2 | 4.24 | −0.64–9.12 | 1.32 | < 0.0001 | Unallowable bias |
| UA | mmol/L | 0.12–0.56 | −0.2 | −3.26–2.87 | 4.87* | 0.7904 |
Mean percent differences (Barricor tube minus SST) and 95% limits of agreement were calculated from Bland–Altman plots. P was determined using the Wilcoxon signed-rank test. The criteria for allowable %bias were calculated using the EFLM biological variation database [10], except for * analytes (calculated using the Westgard biological variation database).
Abbreviations: SST, serum separator tubes; CI, confidence interval; Alb, albumin; ALP, alanine alkaline phosphatase; ALT, aminotransferase; Amy, amylase; AST, aspartate aminotransferase; BUN, blood urea nitrogen; Ca, calcium, Cl, chloride; Chol, cholesterol; CK, creatine kinase; CO2, carbon dioxide; Cre, creatinine; CRP, c-reactive protein; Dbil, direct bilirubin; GGT, γ-glutamyltransferase; Glu, glucose; HDL, high-density lipoprotein cholesterol; K, potassium; LDH, lactate dehydrogenase; LDL, low-density lipoprotein cholesterol; Lip, lipase; Mg, magnesium; Na, Sodium; P, phosphate; Tbil, total bilirubin; TG, triglyceride; Tpro, total protein; UA, uric acid; EFLM, European Federations of Laboratory Medicine.
TAT
Table 2
The TAT was calculated as the time interval from the end of blood collection to the reporting of the initial results. AST was selected to monitor the TAT. Data from the first-floor phlebotomy unit, in which the Barricor tube was not introduced, for the same period are presented as a reference. P was determined using the independent t-test between two periods before and after introducing the Barricor tube.


 PDF
PDF Citation
 Print
Print


 XML Download