Journal List > J Korean Med Sci > v.36(2) > 1146308

Kang, Hong, Jeon, Lee, Lee, Moon, Lee, Kim, Park, and Ahn: Rapid Response System Should Be Enhanced at Non-general Ward Locations: a Retrospective Multicenter Cohort Study in Korea

Abstract

Background

A rapid response system (RRS) contributes to the safety of hospitalized patients. Clinical deterioration may occur in the general ward (GW) or in non-GW locations such as radiology or dialysis units. However, there are few studies regarding RRS activation in non-GW locations. This study aimed to compare the clinical characteristics and outcomes of patients with RRS activation in non-GW locations and in the GW.

Methods

From January 2016 to December 2017, all patients requiring RRS activation in nine South Korean hospitals were retrospectively enrolled and classified according to RRS activation location: GW vs non-GW RRS activations.

Results

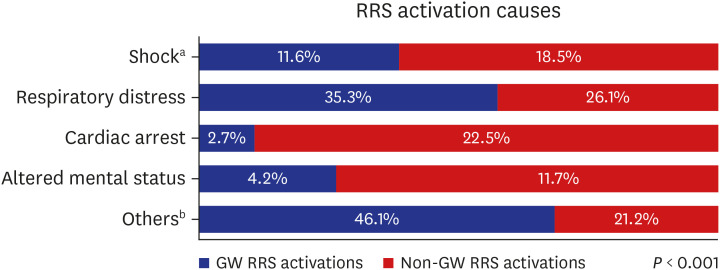
In total, 12,793 patients were enrolled; 222 (1.7%) were non-GW RRS activations. There were more instances of shock (11.6% vs. 18.5%) and cardiac arrest (2.7% vs. 22.5%) in non-GW RRS activation patients. These patients also had a lower oxygen saturation (92.6% ± 8.6% vs. 88.7% ± 14.3%, P < 0.001) and a higher National Early Warning Score 2 (7.5 ± 3.4 vs. 8.9 ± 3.8, P < 0.001) than GW RRS activation patients. Although non-GW RRS activation patients received more intubation (odds ratio [OR], 3.135; P < 0.001), advanced cardiovascular life support (OR, 3.912; P < 0.001), and intensive care unit transfer (OR, 2.502; P < 0.001), their hospital mortality (hazard ratio, 0.630; P = 0.013) was lower than GW RRS activation patients upon multivariate analysis.

Conclusion

Considering that there were more critically ill but recoverable cases in non-GW locations, active RRS involvement should be required in such locations.

Graphical Abstract

jkms-36-e7-abf001.jpg

INTRODUCTION

It has been established that some patients experience serious adverse events such as cardiopulmonary arrest, unplanned intensive care unit (ICU) admission, and unexpected death during their hospitalization.1 However, several studies have reported that abnormal vital signs frequently precede these adverse events by several hours.234 A rapid response system (RRS) strives to enhance the safety of hospitalized patients with the purpose of preventing cardiac arrest and death by identifying deterioration in vital signs, assessing the patients' conditions, and providing immediate and timely interventions.56
The RRS activation is usually triggered by multiple factors such as vital sign surveillance, proactive rounding, and direct calls from attending physicians, nurses, and family members.7 Although most RRS activations occur in the general ward (GW), they may also occur in non-GW settings such as the radiology room, dialysis unit, rehabilitation unit, hospital lobby, rest room, and other hospital locations.8 As it is difficult for medical staff to monitor vital signs and predict deterioration of the patients' condition at non-GW locations, the prognosis of patients requiring non-GW RRS activation may differ from that of patients requiring GW RRS activation. However, there are few studies on non-GW RRS activations. In this study, we evaluated the characteristics and outcomes of non-GW RRS activation patients and compared them with those of GW RRS activation patients.

METHODS

Study design

This was a nationwide multicenter retrospective cohort study conducted in nine tertiary or university-affiliated hospitals in South Korea between January 2016 and December 2017. All patients older than 19 years at each hospital who required RRS activation were included, except emergency department patients, outpatients, ICU patients, patients in operating and recovery rooms, and patients who were transferred to other hospitals after RRS activation. We classified the study patients into the GW and non-GW RRS activation groups considering RRS activation places.

Data collection

Each participating hospital's trained coordinators reviewed the electronic medical records for each patient to create a standardized Excel spreadsheet-based, case report form. Data on the following parameters were retrospectively collected: 1) demographic characteristics such as age, sex, body mass index, and attending department; 2) underlying comorbidities such as diabetes mellitus, cardiovascular diseases, chronic lung diseases, chronic hepato-biliary-pancreatic diseases, chronic kidney diseases, cerebrovascular diseases, solid malignancies, hematologic malignancies, and organ transplantations; 3) vital signs, oxygen saturation, and National Early Warning Score (NEWS) 2; 4) RRS activation data such as activation location, activation cause, and interventions; and 5) patient outcomes such as ICU transfer, hospital mortality, and length of hospital stay.

Definitions

We defined RRS activation as the RRS medical staff providing checkups, recommendations, interventions, and other treatments to a targeted patient after a medical record review. The RRS activations were executed according to the participating center's criteria. We also defined non-GW RRS activation as RRS activation at locations other than a GW where RRS was poorly monitored such as a radiologic laboratory room, dialysis unit, stroke unit, delivery room, rehabilitation unit, bone marrow transplant unit, and other hospital locations. We extracted the vital signs, oxygen saturation, and NEWS 2 from the most recently measured values at the RRS calling time, RRS arrival time (if there were no available data on RRS calling time), or cardiopulmonary cerebral resuscitation (CPCR) announcement time (if there were no available data for RRS calling and arrival time). Interventions were defined as all procedures, treatments, and recommendations initiating with RRS activation to the completion of RRS follow-up. RRS follow-up was completed following an advanced care planning decision, the recovery of the patients' condition thus not requiring further monitoring, or ICU transfer. The NEWS 2 calculation was performed according to the Royal College of Physicians guidelines.9 If the RRS was activated repeatedly for one patient during the study period, we collected the data from the first RRS activation as the index case.

Statistical analysis

We presented data as numbers and proportions for categorical variables and means ± standard deviations (or median [interquartile range]) for continuous variables, respectively. Additionally, we compared the frequency of the distributions for both groups using chi-square tests and the mean (or median) values using an independent t-test. P values < 0.05 were considered statistically significant.
We analyzed the survival curves for patients with GW and non-GW RRS activations using the Kaplan–Meier method and compared them using the log-rank test. Additionally, we performed univariate and multivariate logistic regression analyses (for intubation, advanced cardiovascular life support [ACLS], and ICU transfer) and Cox regression analysis (for hospital death) to compare the outcomes between the two groups. Variables considered statistically significant (P-value < 0.05) in the univariate model were included in the multivariate model. Additionally, before conducting the multivariate analysis, we checked the variance inflation factor for detecting multicollinearity. Statistical analyses were performed using the Statistical Package for the Social Sciences Version 24.0 (IBM Corporation, Armonk, NY, USA).

Ethics statement

This study was approved by the Institutional Review Board (IRB) of Asan Medical Center (IRB No. 2018-0181) and by the local IRB of all other participating hospitals; the need for informed consent was waived owing to the retrospective nature and the anonymization of data included in the study.

RESULTS

Patient characteristics

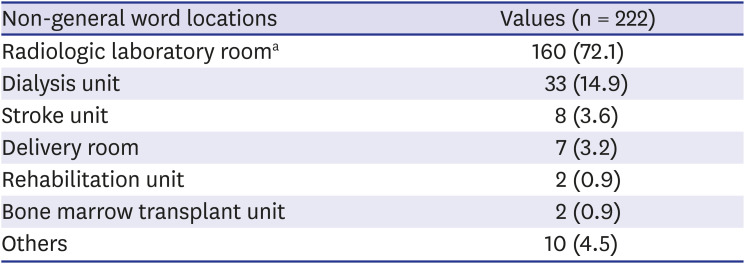
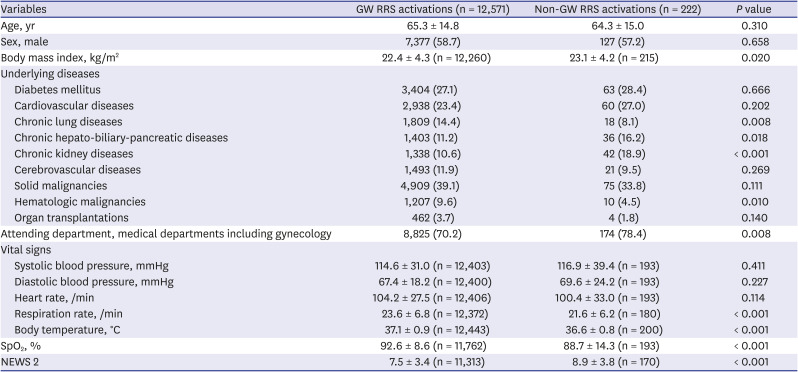
During the study period, we enrolled 12,793 patients with RRS activations in our study at the nine hospitals. Among these patients, 222 (1.7% of total RRS activations) belonged to the non-GW RRS activation group. The radiologic laboratory rooms (160/222, 72.1%), such as those for X-ray, computed tomography, magnetic resonance imaging, and angiography intervention, were the most common locations for non-GW RRS activation, followed by dialysis (33/222, 14.9%) and stroke units (8/222, 3.6%) (Table 1). Baseline characteristics of the GW and non-GW RRS activation patients are presented in Table 2. There were no significant differences in terms of age and sex between the groups. Compared with GW RRS activations, non-GW RRS activations occurred more frequently in patients with chronic hepato-biliary-pancreatic diseases (11.2% vs. 16.2%, P = 0.018) and chronic kidney diseases (10.6% vs. 18.9%, P < 0.001). Additionally, medical department patients required non-GW RRS activation more frequently than GW RRS activation (70.2% vs. 78.4%, P = 0.008). Although the respiration rate (23.6 ± 6.8 vs. 21.6 ± 6.2, P < 0.001) and body temperature (37.1 ± 0.9 vs. 36.6 ± 0.8, P < 0.001) were better, oxygen saturation (92.6 ± 8.6 vs. 88.7 ± 14.3, P < 0.001) and NEWS 2 (7.5 ± 3.4 vs. 8.9 ± 3.8, P < 0.001) were worse in the non-GW RRS activation patients than in the GW RRS activation patients.
Table 1

Locations for non-general ward rapid response system activations

jkms-36-e7-i001
Non-general word locations Values (n = 222)
Radiologic laboratory rooma 160 (72.1)
Dialysis unit 33 (14.9)
Stroke unit 8 (3.6)
Delivery room 7 (3.2)
Rehabilitation unit 2 (0.9)
Bone marrow transplant unit 2 (0.9)
Others 10 (4.5)
Values are presented as number (%).
aRadiologic laboratory room included X-ray, computed tomography, magnetic resonance imaging, and angiography intervention rooms.
Table 2

Baseline characteristics of the study patients with general ward and non-general ward rapid response system activations

jkms-36-e7-i002
Variables GW RRS activations (n = 12,571) Non-GW RRS activations (n = 222) P value
Age, yr 65.3 ± 14.8 64.3 ± 15.0 0.310
Sex, male 7,377 (58.7) 127 (57.2) 0.658
Body mass index, kg/m2 22.4 ± 4.3 (n = 12,260) 23.1 ± 4.2 (n = 215) 0.020
Underlying diseases
Diabetes mellitus 3,404 (27.1) 63 (28.4) 0.666
Cardiovascular diseases 2,938 (23.4) 60 (27.0) 0.202
Chronic lung diseases 1,809 (14.4) 18 (8.1) 0.008
Chronic hepato-biliary-pancreatic diseases 1,403 (11.2) 36 (16.2) 0.018
Chronic kidney diseases 1,338 (10.6) 42 (18.9) < 0.001
Cerebrovascular diseases 1,493 (11.9) 21 (9.5) 0.269
Solid malignancies 4,909 (39.1) 75 (33.8) 0.111
Hematologic malignancies 1,207 (9.6) 10 (4.5) 0.010
Organ transplantations 462 (3.7) 4 (1.8) 0.140
Attending department, medical departments including gynecology 8,825 (70.2) 174 (78.4) 0.008
Vital signs
Systolic blood pressure, mmHg 114.6 ± 31.0 (n = 12,403) 116.9 ± 39.4 (n = 193) 0.411
Diastolic blood pressure, mmHg 67.4 ± 18.2 (n = 12,400) 69.6 ± 24.2 (n = 193) 0.227
Heart rate, /min 104.2 ± 27.5 (n = 12,406) 100.4 ± 33.0 (n = 193) 0.114
Respiration rate, /min 23.6 ± 6.8 (n = 12,372) 21.6 ± 6.2 (n = 180) < 0.001
Body temperature, °C 37.1 ± 0.9 (n = 12,443) 36.6 ± 0.8 (n = 200) < 0.001
SpO2, % 92.6 ± 8.6 (n = 11,762) 88.7 ± 14.3 (n = 193) < 0.001
NEWS 2 7.5 ± 3.4 (n = 11,313) 8.9 ± 3.8 (n = 170) < 0.001
Categorical variables are presented as numbers (%), and continuous variables are presented as mean ± standard deviations.
GW = general ward, NEWS = National Early Warning Score, RRS = rapid response system, SpO2 = oxygen saturation.
Statistical comparisons of the data performed using the χ2 test for categorical variables and the independent t-test for continuous variables.
The NEWS 2 sub-scores were generally higher (worse) in the non-GW RRS activation patients than in the GW RRS activation patients (Supplementary Table 1). The NEWS 2 sub-scores related to oxygen requirements (oxygen saturation and air/oxygen) were similar to those in Table 2; however, NEWS 2 sub-scores for systolic blood pressure and heart rate differed from those reported in Table 2 between the two groups. Additionally, there were more critically ill cases related to RRS activation causes such as shock (1,464/12,571 [11.6%] vs. 41/222 [18.5%]) and cardiac arrest (337/12,571 [2.7%] vs. 50/222 [22.5%]) in the non-GW RRS activation patients than in the GW RRS activation patients (Fig. 1).
Fig. 1

Causes of rapid response system activation for general ward and non-general ward rapid response system activation.

GW = general ward, RRS = rapid response system.
aShock includes that because of septic, cardiac, anaphylactic, hypovolemic, obstructive, and other causes; bOthers include causes such as arrhythmia, metabolic acidosis, hypertension, education of medical staff, procedure call, and transportation.
jkms-36-e7-g001

Interventions and hospital outcomes

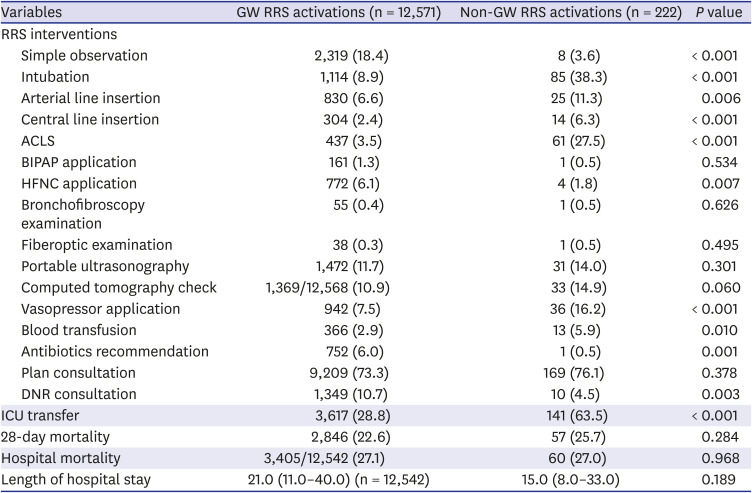
Interventions and hospital outcomes after GW and non-GW RRS activations are presented in Table 3. Dynamic interventions for the management of hemodynamically unstable patients, such as intubation (8.9% vs. 38.3%, P < 0.001), arterial line insertion (6.6% vs. 11.3%, P = 0.006), central line insertion (2.4% vs. 6.3%, P < 0.001), ACLS (3.5% vs. 27.5%, P < 0.001), vasopressor applications (7.5% vs. 16.2%, P < 0.001), and blood transfusions (2.9% vs. 5.9%, P = 0.010), were more frequently performed in the non-GW RRS activation patients than in the GW RRS patients. Contrastingly, static interventions such as simple observation (18.4% vs. 3.6%, P < 0.001), high flow nasal cannula applications (6.1% vs. 1.8%, P = 0.007), antibiotic recommendations (6.0% vs. 0.5%, P = 0.001), and do not resuscitate recommendations (10.7% vs. 4.5%, P = 0.003) were more frequently performed in the GW RRS activation patients.
Table 3

Interventions and hospital outcomes after rapid response system activation

jkms-36-e7-i003
Variables GW RRS activations (n = 12,571) Non-GW RRS activations (n = 222) P value
RRS interventions
Simple observation 2,319 (18.4) 8 (3.6) < 0.001
Intubation 1,114 (8.9) 85 (38.3) < 0.001
Arterial line insertion 830 (6.6) 25 (11.3) 0.006
Central line insertion 304 (2.4) 14 (6.3) < 0.001
ACLS 437 (3.5) 61 (27.5) < 0.001
BIPAP application 161 (1.3) 1 (0.5) 0.534
HFNC application 772 (6.1) 4 (1.8) 0.007
Bronchofibroscopy examination 55 (0.4) 1 (0.5) 0.626
Fiberoptic examination 38 (0.3) 1 (0.5) 0.495
Portable ultrasonography 1,472 (11.7) 31 (14.0) 0.301
Computed tomography check 1,369/12,568 (10.9) 33 (14.9) 0.060
Vasopressor application 942 (7.5) 36 (16.2) < 0.001
Blood transfusion 366 (2.9) 13 (5.9) 0.010
Antibiotics recommendation 752 (6.0) 1 (0.5) 0.001
Plan consultation 9,209 (73.3) 169 (76.1) 0.378
DNR consultation 1,349 (10.7) 10 (4.5) 0.003
ICU transfer 3,617 (28.8) 141 (63.5) < 0.001
28-day mortality 2,846 (22.6) 57 (25.7) 0.284
Hospital mortality 3,405/12,542 (27.1) 60 (27.0) 0.968
Length of hospital stay 21.0 (11.0–40.0) (n = 12,542) 15.0 (8.0–33.0) 0.189
Categorical variables are presented as numbers (%), and continuous variables are presented as median (interquartile range).
ACLS = advanced cardiovascular life support, BIPAP = bilevel positive airway pressure, DNR = do not resuscitate, GW = general ward, HFNC = high flow nasal cannula, ICU = intensive care unit, RRS = rapid response system.
Statistical comparisons of the data performed by using the χ2 test for categorical variables and the independent t-test for continuous variables.
There were more ICU transfers in the non-GW RRS activation group than in the GW RRS activation group (28.8% vs. 63.5%, P < 0.001); however, 28-day mortality (22.6% vs. 25.7%, P = 0.284), hospital mortality (27.1% vs. 27.0%, P = 0.968), and length of hospital stay (21.0 [11.0–40.0] vs. 15.0 [8.0–33.0], P = 0.189) did not differ significantly between the two groups. On Kaplan–Meier analysis (Supplementary Fig. 1), the median survival period of patients with GW and non-GW RRS activations were 91 and 117 days, respectively. Moreover, there was no significant survival difference between the two groups (P = 0.173).

Adjusted interventions and hospital outcomes

We performed univariate and multivariate logistic regression analysis for intubation (Supplementary Table 2), ACLS (Supplementary Table 3), and ICU transfer (Supplementary Table 4). Additionally, we performed univariate and multivariate Cox regression analysis to investigate hospital death (Supplementary Table 5). The multivariate logistic regression analysis indicated that intubation (odds ratio [OR] = 3.135, P < 0.001), ACLS (OR = 3.912, P < 0.001), and ICU transfer (OR = 2.502, P < 0.001) more commonly occurred in non-GW RRS activation patients (Fig. 2). However, there were more hospital deaths (hazard ratio = 0.630, P = 0.013) in GW RRS activation patients as indicated by the Cox regression analysis.
Fig. 2

Forest plot analysis of rapid response system interventions and hospital mortality in patients with general ward and non-general rapid response system activations.

Statistical comparisons of the data performed using univariate and multivariate logistic regression analyses related with intubation, ACLS, and ICU transfer, and using univariate and multivariate Cox regression analyses related with hospital death.
ACLS = advanced cardiovascular life support, CI = confidence interval, GW = general ward, HFNC = high flow nasal cannula, ICU = intensive care unit, OR = odds ratio, RRS = rapid response system.
aHazard ratio analyzed by Cox regression analysis.
jkms-36-e7-g002

DISCUSSION

We found that the characteristics and outcomes of non-GW RRS activation patients differed from those of GW RRS activation patients. Non-GW RRS activation contributed to approximately 1.8% of the total RRS activations. The radiologic laboratory room and dialysis unit were the most common locations for non-GW RRS activation. Although critical cases were more common among those involving non-GW RRS activations, the hospital mortality rate was lower in the non-GW RRS activation patients than in the GW RRS activation patients. Although a few studies have also assessed non-GW RRS activations, those studies evaluated non-GW RRS activations among non-hospitalized persons such as outpatients, employees, and visitors.101112 To our knowledge, our study is the first to assess non-GW RRS activations in hospitalized patients.
Our findings revealed that more than 80% of all non-GW RRS activations occurred in radiologic laboratory rooms and dialysis units. We thought that this might be a result of the underlying acute or chronic disease conditions of patients. Underlying hepato-biliary-pancreatic disease might cause more non-GW RRS activations, because patients with these conditions undergo more radiological procedures or examinations. Such conditions might cause patients to receive more sedatives or analgesics, and consequentially, affect these patients' mental status. Additionally, patients with underlying chronic kidney disease receive hemodialysis more commonly, which might result in hemodynamic changes more frequently. These findings could account for RRS activation among non-GW patients (more shock, cardiac arrest and altered mental status) in this study. And patients who had these underlying conditions might influence more non-GW RRS activations of medical department, because they were more likely to belong to medical department than surgical department.
There was a discrepancy between vital sign measurement values (Table 2) and vital sign scoring values (Supplementary Table 1) in the two groups. A possible explanation might be that vital sign scoring values for NEWS 2 were more sensitive than vital sign measurement values in non-GW RRS activation patients. When suspicious of patients' clinical deterioration at non-GW locations, a scoring system using multiple parameter vital sign abnormalities such as NEWS 2 should be considered rather than single vital sign abnormality. If a scoring system is not available, we propose that oxygen saturation and mental status are considered to detect clinical deterioration.
In our study, critical events such as shock and cardiac arrest occurred more commonly in the non-GW RRS activation patients than in the GW RRS activation patients. This might be explained by the following factors. First, among GW patients, clinical deterioration and unexpected adverse events may arise during hospitalization.131415 Some of these events are preventable or predictable.161718 Several studies have reported that there was at least one preceding abnormal measurement in the following parameters prior to cardiac arrest: blood pressure, pulse rate, respiration rate, body temperature, or changes in consciousness.1819 In patients requiring RRS activation at GW, such antecedents might provide an opportunity for RRS to recognize and manage the patients properly, and consequently prevent the development of critical events. However, because of the location, the vital signs of patients requiring RRS activation at non-GW locations were not well monitored by the RRS. Therefore, it was difficult to prevent such critical events at non-GW locations in advance. Second, these might be related to patient selection. When acute events occur in non-GW locations, mild cases can be transferred to the GW for further management; however, patients with a critical condition such as shock and cardiac arrest would not be transferred to the GW. Such patients require emergency RRS activation management in non-GW locations. Third, in non-GW locations, there are radiological technologists in radiology rooms, operators in intervention rooms, and nurses in dialysis units. They are unfamiliar with critically ill patients and their main tasks entail things other than monitoring and managing critically ill patients. This means that there are possibilities of detection and management delays in the patient's clinical deterioration in non-GW locations, consequently leading to higher rates of cardiac arrest and shock when RRS is activated in non-GW locations. Thus, we believe that RRS staff should be attentive to critically ill patients in non-GW locations; non-GW staff should be educated regarding the monitoring and management of critically ill patients. It is believed that wireless monitoring using RRS might be a solution to these challenges; however, further in-depth studies are required to confirm this.
The term RRS is often used interchangeably with rapid response team (nurse or respiratory therapist led RRS team), medical emergency team (physician led RRS team), or critical care outreach team (combined rapid response team and ICU physicians).20 Among them, medical emergency teams can perform critical care interventions including endotracheal intubation, central line assesses, and percutaneous catheter drainage of thoracic or abdominal fluid collections.21 In this study, the enrolled hospitals implemented various types of RRSs based on the resource availability in each hospital. Considering that RRS interventions and ICU transfers were more common in non-GW RRS activation patients than in GW RRS activation patients in our study, we believe the medical emergency team would be more effective in managing the patients requiring non-GW RRS activation. When RRSs are required at non-GW locations, although hospital operated RRS other than medical emergency teams, intervention related devices (such as video-laryngoscope, portable ultrasonography, real-time monitors, and vascular access tools) and emergency medications need to be prepared in advance.
Although there were more critically ill patients in the non-GW RRS activation group, hospital mortality was lower in the non-GW RRS activation patients than in the GW RRS activation patients. These findings imply that if the acute events requiring intubation, ACLS, and ICU transfer are resolved in non-GW RRS activation patients, their prognosis is generally good. Active RRS involvement should be consideration in such critically ill but recoverable patients in non-GW locations. Further prospective and randomized controlled studies are warranted.
Our study has several limitations. First, it was a retrospective cohort study. Some of the baseline data and outcomes were missing and consequently, various biases might occur. Second, the number of included non-GW RRS activation patients was smaller than the number of GW RRS activation patients. Additionally, because each hospital had a different RRS form (operation time, composition, screening, and calling criteria) and patient populations, there is a potential risk of selection bias. We attempted to minimize these biases by performing the study with a multicenter design and a large cohort, over a relatively long study period. Third, there was a possible underestimation of RRS activation at non-GW locations, as we excluded the instances of non-GW RRS activation associated with non-hospitalized persons. However, we believe that our study is significant because it focused on non-GW RRS activation of hospitalized patients, and there were already several preceding studies focused on non-hospitalized persons.101112 Fourth, some might argue that RRS activation by CPCR announcement should not be classified as RRS activation; however, because RRS was activated and managed on the basis of a CPCR announcement in our setting, we classified it as RRS activation. Finally, we could not check the non-GW locations' monitoring and handling capacity of critically ill patients. Therefore, there was possibility in misestimation of non-GW locations status. Further well-designed prospective studies are warranted to address this question.
RRS is necessary to improve the safety of hospitalized patients. Most RRS activations occurred in the GW; however, a small proportion of RRS activations occurred in non-GW locations such as radiology rooms and dialysis units. Although critical events such as shock and cardiac arrest occurred more commonly in non-GW RRS activation patients, the hospital prognosis of non-GW RRS activation patients was better than that of GW RRS activation patients. Our results indicate that active RRS involvement and interventions should be implemented for critically ill patients at non-GW locations. Further large-scale, prospective, multicenter, randomized controlled studies are required to substantiate our findings.
ACKNOWLEDGMENTS

The authors thank study coordinators including Jee Hwan Ahn and Eun Mi Cho for their support during data collection.

Notes

Funding: This study was supported by a grant of the Korea Health Technology R & D Project through the Korea Health Industry Development Institute funded by the Ministry of Health & Welfare, Republic of Korea (HI18C0599).

Disclosure: The authors have no potential conflicts of interest to disclose.

Author Contributions:

  • Conceptualization: Ahn J, Hong S.

  • Data curation: Ahn J, Hong S, Jeon K, Lee S, Lee D, Moon JY, Lee YJ, Kim JS, Park J.

  • Formal analysis: Kang BJ, Ahn J.

  • Investigation: Hong S, Jeon K, Lee S, Lee D, Moon JY, Lee YJ, Kim JS, Park J.

  • Methodology: Kang BJ, Hong S.

  • Validation: Kang BJ, Ahn J, Hong S.

  • Writing - original draft: Kang BJ.

  • Writing - review & editing: Ahn J, Hong S, Jeon K, Lee S, Lee D, Moon JY, Lee YJ, Kim JS, Park J.

References

1. Jones D, Mitchell I, Hillman K, Story D. Defining clinical deterioration. Resuscitation. 2013; 84(8):1029–1034. PMID: 23376502.
crossref
2. Andersen LW, Kim WY, Chase M, Berg KM, Mortensen SJ, Moskowitz A, et al. The prevalence and significance of abnormal vital signs prior to in-hospital cardiac arrest. Resuscitation. 2016; 98:112–117. PMID: 26362486.
crossref
3. Schein RM, Hazday N, Pena M, Ruben BH, Sprung CL. Clinical antecedents to in-hospital cardiopulmonary arrest. Chest. 1990; 98(6):1388–1392. PMID: 2245680.
crossref
4. Buist M, Bernard S, Nguyen TV, Moore G, Anderson J. Association between clinically abnormal observations and subsequent in-hospital mortality: a prospective study. Resuscitation. 2004; 62(2):137–141. PMID: 15294398.
crossref
5. Jones DA, DeVita MA, Bellomo R. Rapid-response teams. N Engl J Med. 2011; 365(2):139–146. PMID: 21751906.
crossref
6. Devita MA, Bellomo R, Hillman K, Kellum J, Rotondi A, Teres D, et al. Findings of the first consensus conference on medical emergency teams. Crit Care Med. 2006; 34(9):2463–2478. PMID: 16878033.
crossref
7. Lyons PG, Edelson DP, Churpek MM. Rapid response systems. Resuscitation. 2018; 128:191–197. PMID: 29777740.
crossref
8. Galhotra S, Devita MA, Dew MA, Simmons RL. A 5-year analysis of rapid response system activation at an in-hospital haemodialysis unit. Qual Saf Health Care. 2010; 19(6):e38.
crossref
9. Royal College of Physicians. National Early Warning Score (NEWS) 2: Standardising the Assessment of Acute Illness Severity in the NHS. London: Royal College of Physicians;2017.
10. Dechert TA, Sarani B, McMaster M, Sonnad S, Sims C, Pascual JL, et al. Medical emergency team response for the non-hospitalized patient. Resuscitation. 2013; 84(3):276–279. PMID: 22776516.
crossref
11. Lakshminarayana PH, Darby JM, Simmons RL. Addressing patient safety in rapid response activations for nonhospitalized persons. J Patient Saf. 2017; 13(1):14–19. PMID: 24717529.
crossref
12. Nett S, Kong L, Nett J, Fussell M, Slogic ST, Gill HS, et al. Medical emergency response in non-hospitalized patients (Code Whites) in a rural tertiary academic medical center: a 7 year observational study. Resuscitation. 2018; 129:13–18. PMID: 29803705.
crossref
13. Neale G, Woloshynowych M, Vincent C. Exploring the causes of adverse events in NHS hospital practice. J R Soc Med. 2001; 94(7):322–330. PMID: 11418700.
crossref
14. Joint Commission. The Joint Commission announces the 2008 National Patient Safety Goals and Requirements. Jt Comm Perspect. 2007; 27(7):1.
15. Berwick DM, Calkins DR, McCannon CJ, Hackbarth AD. The 100,000 lives campaign: setting a goal and a deadline for improving health care quality. JAMA. 2006; 295(3):324–327. PMID: 16418469.
16. Wilson RM, Runciman WB, Gibberd RW, Harrison BT, Newby L, Hamilton JD. The quality in Australian health care study. Med J Aust. 1995; 163(9):458–471. PMID: 7476634.
crossref
17. Schwendimann R, Blatter C, Dhaini S, Simon M, Ausserhofer D. The occurrence, types, consequences and preventability of in-hospital adverse events - a scoping review. BMC Health Serv Res. 2018; 18(1):521. PMID: 29973258.
crossref
18. Barrett J, Hawdon G, Wade J, Reeves J. Measuring the success of Medical Emergency Teams: potentially preventable deaths versus total cardiac arrest deaths. A single centre observational study. Intern Med J. 2018; 48(3):264–269. PMID: 29131479.
crossref
19. Lee BY, Hong SB. Rapid response systems in Korea. Acute Crit Care. 2019; 34(2):108–116. PMID: 31723915.
crossref
20. Devita MA, Bellomo R, Hillman K, Kellum J, Rotondi A, Teres D, et al. Findings of the first consensus conference on medical emergency teams. Crit Care Med. 2006; 34(9):2463–2478. PMID: 16878033.
crossref
21. Jones D, Bellomo R, DeVita MA. Effectiveness of the medical emergency team: the importance of dose. Crit Care. 2009; 13(5):313. PMID: 19825203.
crossref

SUPPLEMENTARY MATERIALS

Supplementary Table 1

NEWS 2 of study patients with general ward and non-general ward rapid response system activations
jkms-36-e7-s001.doc

Supplementary Table 2

Univariate and multivariate logistic regression analyses of intubation-related factors after rapid response team activation
jkms-36-e7-s002.doc

Supplementary Table 3

Univariate and multivariate logistic regression analyses of advanced cardiovascular life support-related factors after rapid response team activation
jkms-36-e7-s003.doc

Supplementary Table 4

Univariate and multivariate logistic analyses of the factors related to intensive care unit transfer after rapid response team activation
jkms-36-e7-s004.doc

Supplementary Table 5

Univariate and multivariate Cox regression analyses of hospital mortality-related factors after rapid response system activation
jkms-36-e7-s005.doc

Supplementary Fig. 1

Survival comparison between general ward and non-general ward rapid response system activation patients analyzed using the Kaplan–Meier method.
jkms-36-e7-s006.doc
TOOLS
Similar articles