

 PDF
PDF Citation
 Print
Print


INTRODUCTION
Cardiovascular diseases (CVDs) are the leading cause of death in Korea and in many other countries. The foundation for prevention of CVDs and other non-communicable diseases (NCDs) is identification of the most common risk factors, and implementation of prevention and control measures. In the words of the World Health Organization (WHO), “the risk factors of today are the diseases of tomorrow”.1 Most CVDs can be prevented by modifying unhealthy behaviors, such as tobacco use, unhealthy diet and obesity, physical inactivity, and excessive consumption of alcohol, by using population-wide strategies such as periodic health examinations.
In 1980, the national health screening program of Korea began. In 1988, this screening program began to focus on chronic diseases, such as hypertension and diabetes. In 2007, this screening program targeted individuals aged 40 to 66 years-old. These developments were intended to improve public health by reducing the mortalities and morbidities from targeted diseases. In 2009, the Korean government specified the goal of reducing the incidence of CVDs by modifying the behaviors of people with risk factors. Thus, the Korean government made concerted efforts to increase the number of people receiving periodic health check-ups. In response, the percentage of people receiving periodic health check-ups increased from 72.1% in 2013 to 76.9% in 2018, and this increase continues.2
Biennial national periodic health check-ups are free for all Koreans who are at least 20 years-old.3 Height, weight, waist circumference, blood pressure (BP), hemoglobin, lipids, glucose, liver function, and renal function are measured during these check-ups.3 Depending on the results, the individual can request health education in a group setting or individual health counseling. Korea also has other health check-ups, such as the national cancer screening program, the national periodic occupational health examination at the workplace, and private comprehensive health-check-ups. Japan initiated nationwide annual health check-ups in 2008, and the primary purpose was to identify individuals with metabolic syndrome (MetS).4 These systems of health check-ups, coupled with appropriate follow-up measures, should reduce cardiovascular morbidity in Korea and Japan.
However, determination of the benefits of health check-ups in Korea is difficult and no randomized trial has yet examined this topic. It is likely that individuals who attend health check-ups have healthy lifestyles56 and better socioeconomic status than those who do not.78 Previous studies also reported inequalities of geographic accessibility to primary health care,9 tertiary health care,10 screening for mammography,11 and annual check-ups.12
The present study aims to compare the risk factors for cardiovascular diseases among participants and non-participants in periodic health check-ups, after adjustment for demographic factors, socioeconomic status, and lifestyle factors.
METHODS
Design and data collection
This cross-sectional study used data from the Korea National Health and Nutrition Examination Survey (KNHANES) of 2007 to 2018, which included KNHANES IV (2007 to 2009), KNHANES V (2010 to 2012), KNHANES VI (2013 to 2015), and KNHANES VII (2016 to 2018). Details on the design of the KNHANES were shown in our previous paper.13 Briefly, data on age, education, income, exercise, smoking history, and alcohol intake were collected during a health interview. All eligible subjects were adults (≥ 40 years old, n = 44,925) who completed the health examination survey.
“Participants” were defined as those who received national periodic health-check-ups during the previous two years that focused on decreasing the incidence of CVDs, and thus relevant to the object of this study. “Non-participants” were defined as those who did not receive any type of health check-up during the previous two years; these health checkups included the national periodic health-check-up, national cancer health-check, national occupational health examination at the workplace, or a private comprehensive health-check-up.
Definition of hypertension, pre-hypertension, and MetS was provided in our previous studies.1415 The region of residence was categorized as Seoul metropolitan city and its surrounding metropolitan city and province, one of the other 6 metropolitan cities, and one of the other 8 provinces in Korea. Employment status classified participants as waged employees and others. Classification of other variables used in the present study was provided in details in our previous study.13
Data analysis
Statistical analyses were performed using SAS (Version 9.4; SAS Institute, Cary, NC, USA) and SUDAAN (Release 11.0; Research Triangle Institute, Research Triangle Park, NC, USA), a software package that incorporates sample weights and adjusts analyses for complex sample design. Survey sample weights were used in all analyses to produce estimates that were representative of the non-institutionalized civilian population of Korea.13 The χ2 test was used to compare the effect of categorical variables on participation in health check-ups (yes vs. no). Analysis of covariance was used to determine the significance of differences in the adjusted means of continuous variables for participants and non-participants in health check-ups. All analyses were gender-specific.
Multiple logistic regression was used to determine the odds ratios (ORs) and 95% confidence intervals (95% CIs) for the relationship of disease status with check-up participation, with adjustment for demographic factors (age and marital status), socioeconomic factors (education, household income, region, and residence),78 and health-related factors569101112 relevant to cardiovascular disease (smoking, alcohol consumption, regular exercise, and body mass index [BMI]). Variance inflation factors (VIF) had values below 5, which was obtained by turning dependent variable into a scale variable and then running a linear regression. As a result, there was no multicollinearity. A P value below 0.05 was considered significant.
Ethics statement
After explanation of the survey, all participants provided written informed consent prior to participation. This survey was approved by the Institutional Review Board of the Korean Centers for Disease Control and Prevention (approval No. 2007-02CON-04-P, 2008-04EXP-01-C, 2009-01CON-03-2C, 2010-02CON-21-C, 2011-02CON-06-C, 2012-01EXP-01-2C, 2013-07CON-03-4C, 2013-12EXP-03-5C).
RESULTS
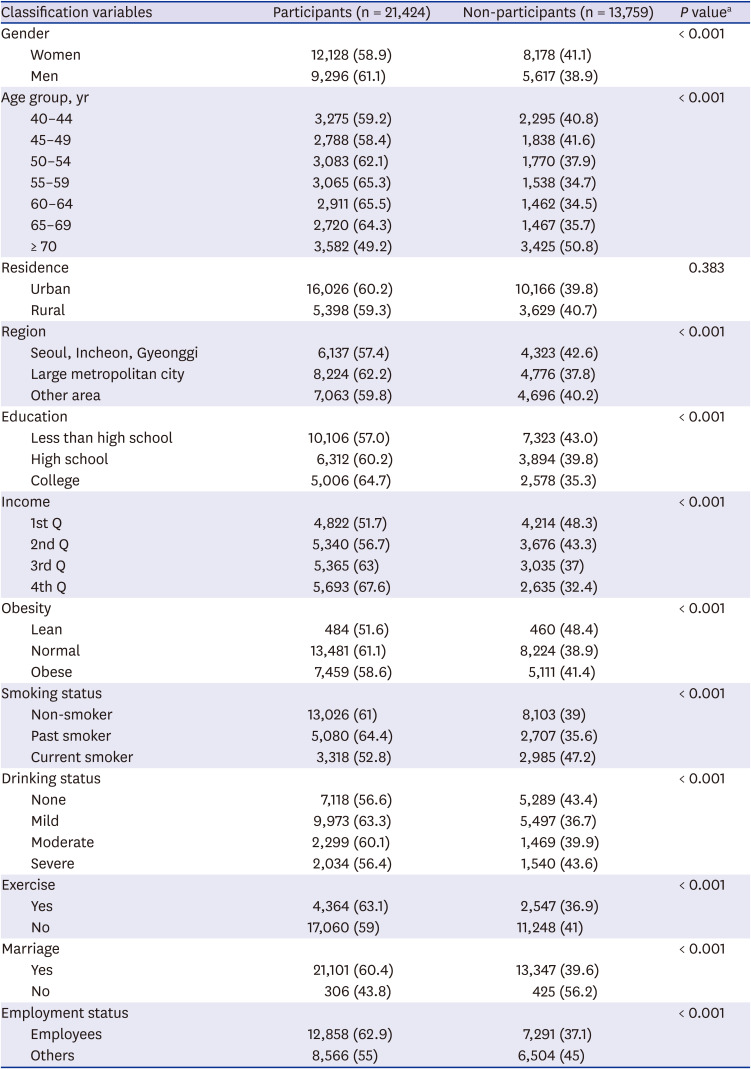
Comparison of subjects who did and did not participate in health check-ups (Table 1) indicated that significantly higher non-participation rates were observed in individuals who were women, 40 to 49 years-old, 70 years-old or more, lived in Seoul or surrounding areas, had a low level of education, had a low monthly income, were not waged employees, were lean, were heavy drinkers, were current smokers, did not perform exercise, and were not married.
Table 1
Participation rate in periodic health check-ups during the previous two years according to demographic, socioeconomic and life style variables
Analysis by gender (Table 2) indicated woman non-participants had higher mean BMI, waist circumstance, systolic BP, diastolic BP, blood glucose, triglyceride, and cholesterol levels than participants after adjustment for demographic factors, socioeconomic status, and health-related factors. Man non-participants had higher mean systolic BP, diastolic BP, blood glucose, cholesterol, triglyceride and SGPT levels than participants after adjustment for the same covariates.
Table 2
Adjusted means and 95% CI of laboratory tests according to gender and participation in periodic health check-ups during the previous two years
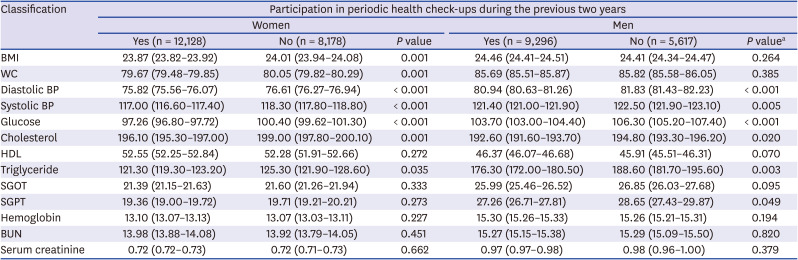
Adjusted by age, marriage, residence, region, education, obesity, income, employment status, drinking status, smoking status and exercise.
CI = confidence interval, BMI = body mass index, WC = waist circumference, BP = blood pressure, HDL = high-density lipoprotein, SGOT = serum glutamic-oxaloacetic transaminase, SGPT = serum glutamic-pyruvic transaminase, BUN = blood urea nitrogen.
aP value S_waite ChiSq.
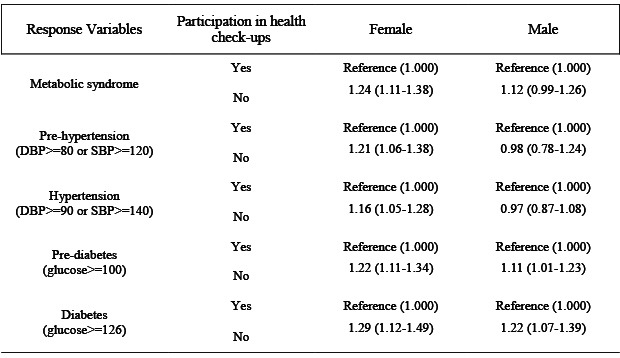
Finally, we calculated the ORs and 95% CIs to determine the relationships of MetS, pre-hypertension, hypertension, prediabetes, and diabetes with participation in periodic health check-ups and health-related behaviors, with adjustment for age, residence, marital status, and socioeconomic factors (Table 3). Among women, non-participants were more likely to have MetS (OR = 1.24, 95% CI = 1.11–1.38), pre-hypertension (OR = 1.19, 95% CI = 1.04–1.36), hypertension (OR = 1.16, 95% CI = 1.05–1.28), pre-diabetes (OR = 1.21, 95% CI = 1.10–1.33), and diabetes (OR = 1.28, 95% CI = 1.11–1.48) after adjustment for age, marital status, and socioeconomic factors. Among men, non-participants were more likely to have pre-diabetes (OR = 1.11, 95% CI = 1.01–1.22) and diabetes (OR = 1.22, 95% CI = 1.07–1.39) after adjustment for age, marital status, and socioeconomic factors.
Table 3
ORs (95% CI) for having diseases by the participation of periodic health check-ups and other variables after adjustments for covariates
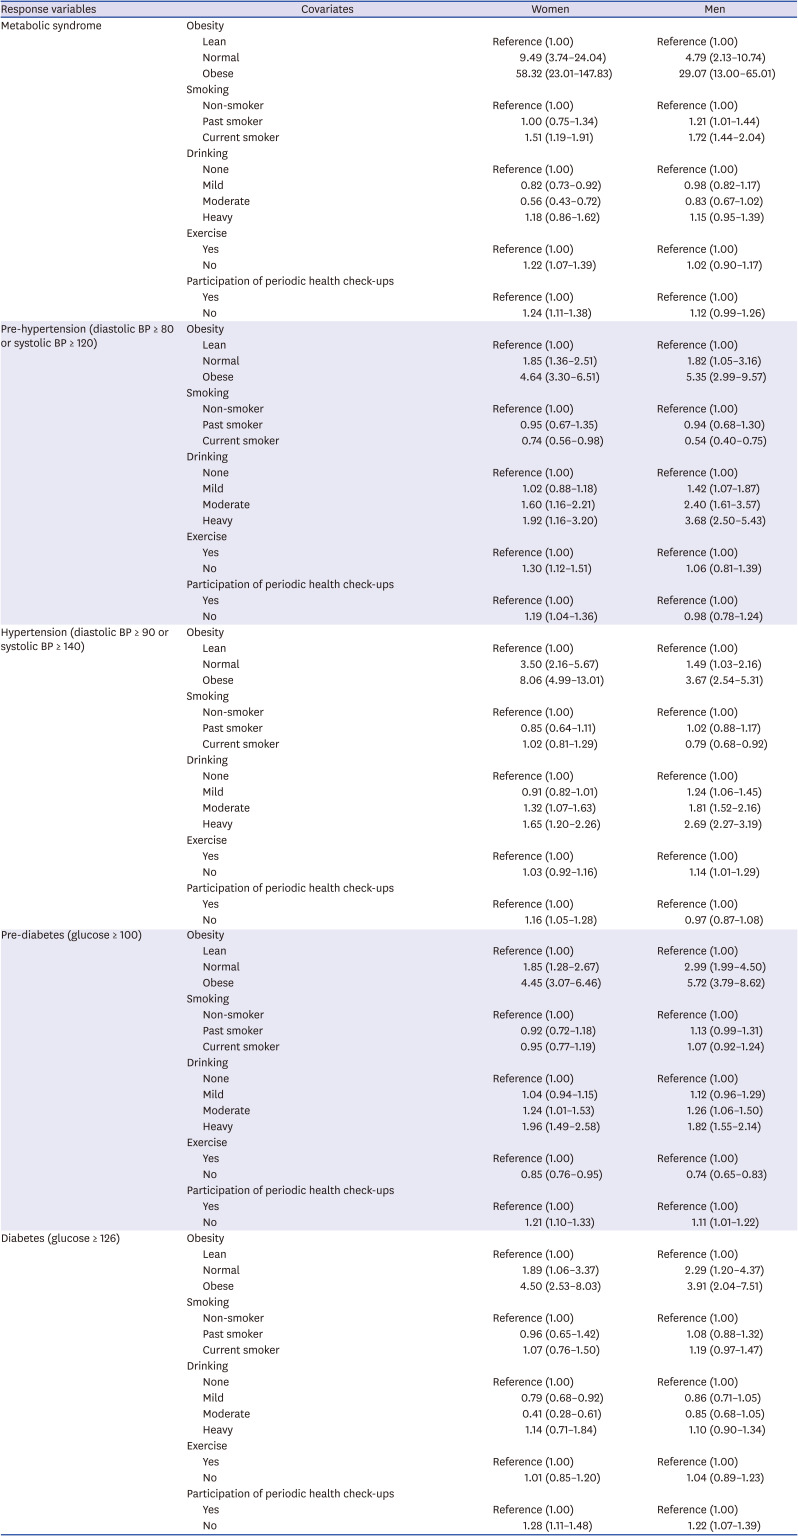
Obese men and women were more likely to have MetS, pre-hypertension, hypertension, pre-diabetes, and diabetes after adjustment for covariates. Smoking men and women, and men who did not perform exercise were more likely to have MetS. Smoking men and women were less likely to have pre-hypertension. Smoking women were less likely to have hypertension. Moderate and heavy alcohol consumers were more likely to have pre-hypertension and hypertension. Men who did not perform exercise were more likely to have pre-hypertension, and women who did not perform exercise were more likely to have hypertension. Moderate and heavy alcohol consumers were more likely to have pre-diabetes.
DISCUSSION
This study showed that demographic factors, health-related behaviors, and lower socioeconomic status (education level and income) was associated with decreased participation in health check-ups in Korea. These findings are in agreement with previous studies, which showed that low socioeconomic status (income and education level) are associated with decreased utilization of health care services.121617 Previous studies also found that certain demographic factors and health-related behaviors affected participation in health check-ups.5618
Our multiple logistic regression analysis, which adjusted for demographic factors, socioeconomic factors, and health-related behaviors, indicated that woman non-participants were more likely to have MetS, pre-hypertension, hypertension, pre-diabetes, and diabetes, and man non-participants were more likely to have pre-diabetes and diabetes. These results are in agreement with previous studies. For example, Khan et al.19 found an inverse relationship between health screening and all-cause mortality; Ikeda et al.20 reported an inverse relationship between participation in health screening and all-cause and cause-specific mortality in women; and Hozawa4 found that mortality rates were lower among participants than non-participants in Japanese health check-ups using propensity score matched cohort analyses.
Furthermore, we found that gender affected participation in health check-ups and morbidity. Woman non-participants had more morbidities than man non-participants. This difference may be because women have a higher awareness of disease prevention and early detection and treatment of diseases. They give birth to children, and are more likely to raise children, manage family health, and function as family health care managers and health educators.21
The present study has several public health implications. First, our findings suggest that individuals who participate in regular health check-ups—especially women—had fewer risk factors for CVDs than non-participants. Thus, encouraging non-participants to attend health check-ups will likely decrease their risk for CVDs. Second, our results documented lower participation in health check-ups by those who had lower socioeconomic status, those who were 40 to 49 years-old or 70 years-old or more, and those had unhealthy behaviors such as heavy alcohol consumption and lack of exercise. Further in-depth studies should examine the reasons for non-participation in health check-ups in these different groups. For example, some individuals with higher incomes and education levels who lived in Seoul metropolitan city tended to prefer expensive private comprehensive health check-ups rather than national periodic health check-ups. Third, the reason why waged employees are more likely to receive periodic health check-ups than others is because the Occupational Safety and Health Act requires employers to provide these workers with periodic general health check-ups. However, workplaces with fewer than 50 employees are not obligated to appoint a workplace health manager, so these workers do not receive proper consultation about the results of periodic health check-ups. Thus, more attention should be devoted to the national periodic health check-ups to improve prevention of CVDs, because a large portion of the periodic health examinees are office workers.
Our study had several strengths. First, we examined a large and representative sample of the Korean working population and used rigorous quality-control procedures. Second, we examined the physical health status of participants and non-participants in health check-ups after adjustment for confounding by age, marital status, socioeconomic factors (education, income, and residence area, region), and health-related factors (smoking, alcohol consumption, regular exercise, and BMI).
Our study also had several limitations. First, our results are based on cross-sectional analysis. Therefore, we did not identify temporal relationships of the different variables with participation in health check-ups and cannot establish causality for the reported associations. Second, the possibility of self-selection bias may have affected the results. In particular, the decision of whether to undergo a health check-up is mainly determined by each individual. Several factors are considered in this decision-making process, some of which were not observed, but were nonetheless potentially correlated with health outcomes.22 For example, compared with individuals who are not concerned about their health, those who are concerned about their health are more likely to exercise, to eat a healthy diet, and attend health check-ups, and are less likely to smoke and drink alcohol. In addition, individuals with diseases may be more likely to participate in health checkups than those without diseases. Although we adjusted for confounding by age, marital status, socioeconomic factors, and health-related behaviors, there may have been selection bias due to unobserved characteristics.2223 For example, the risk of CVDs may be different among those who did not feel the need for a health check-up and who wanted a checkup, but did not have the time.24 We did not address differences in the reasons for non-participation in health check-ups, so our results should be interpreted with caution.
In conclusion, our major finding is that Korean women who did not participate in periodic health check-ups were more likely to have MetS, pre-hypertension, hypertension, prediabetes, and diabetes after adjustment for demographic and socioeconomic factors, and health-related behaviors. Man non-participants were more likely to have pre-diabetes and diabetes.
 XML Download