

 PDF
PDF Citation
 Print
Print


INTRODUCTION
Cancer cachexia is frequently observed in cancer patients, especially in their advanced stages. Cachexia is related to adverse clinical outcomes and survival among cancer patients. The mechanism of cachexia is not clear but anorexia and anemia were related. Change in body composition is another insight affecting cancer prognosis, other than weight loss.1 Sarcopenia is a loss of skeletal muscle mass lower than two standard deviations of that of healthy adults and was initially described as an age-related phenomenon. Skeletal muscle mass depletion is reported to be associated with increased delayed postoperative recovery and poor survival in patients with gastrointestinal, lung, urothelial, breast, and ovarian cancers. Intriguingly, obese individuals with sarcopenia are reported to be at a higher risk of tumor progression than those without sarcopenia. The mechanism through which sarcopenia influences malignancy is not clear but chronic inflammation is a strong candidate.23456
Despite a decade-long effort since the introduction of taxane-platinum combination chemotherapy, ovarian cancer is still a deadly disease. More than 150,000 individuals succumb from the disease worldwide annually, and the overall 5-year survival is < 45%.7 Recent reports showed that skeletal muscle depletion may play as a prognostic factor in advanced ovarian cancer.68910 However, others directly contradicted this finding, and the idea of sarcopenia as a prognosticator for ovarian cancer remained unclear.11 Ubachs et al.12 systematically reviewed and reported that a low skeletal muscle volume is associated with survival in ovarian cancer patients, but argued that the source data were of low quality.
Imaging modalities including dual energy X-ray absorptiometry (DXA), ultrasound, and bioelectric impendence were suggested to quantify skeletal muscle volume. Computed tomography (CT) has an advantage for evaluating skeletal muscle volume in ovarian cancer patients because it is widely used in the initial disease evaluation. Cross-sectional CT images of the third lumbar vertebra (L3) have been adopted for measuring skeletal muscle volume in previous reports.813
Ovarian cancer lacks symptom in its early stages, making its diagnosis hard. If it is diagnosed early, the prognosis is much better than in its later stages; hence, 5-year survival is reported to be 89% and 71% in International Federation of Gynecology and Obstetrics (FIGO) stages I and II, respectively.14 Previous reports of sarcopenia in ovarian cancer predominantly focused on advanced stages, and the positive correlations between sarcopenia and survival were noted for advanced ones. Sarcopenia has received interest as a prognosticator and also for its potentially correctible nature. Thus, we aimed to identify sarcopenia as a predictive prognostic factor of ovarian cancer in terms of survival outcome in patients with early-stage ovarian cancer.
METHODS
Patients
Patient medical data from March 2002 to December 2017 in Konkuk University Medical Center were reviewed. Patients diagnosed with ovarian cancer with FIGO stage I/II and who had underwent CT in the initial work-up were included. CT scans were taken within 30 days before primary surgery or neoadjuvant chemotherapy. Either primary or interval debulking surgery after neoadjuvant chemotherapy was allowed. The exclusion criteria were those lost to follow-up after the first visit, did not undergo initial CT imaging, no documented information regarding their first cancer-related surgery, or diagnosed with a Krukenberg tumor or primary colorectal, primary breast, or synchronous cancer. Patients with a history of heart disease, pulmonary embolism, stroke, kidney failure, or bronchiectasis that might affect survival were excluded. Those with advanced stage (FIGO stage III/IV) ovarian cancer were also excluded (Fig. 1). Pathologic reports including histologic type, grade, and stage were obtained postoperatively. Ovarian cancer was staged based on the FIGO system.15 Optimal surgery was defined as complete resection without microscopic residual tumor, and surgery was defined as an incomplete resection when residual tumor was visible.
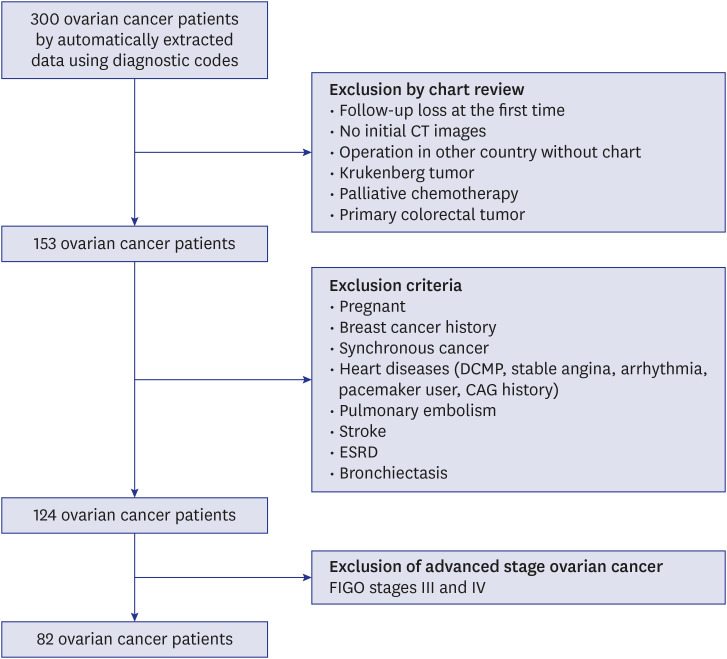
Image analysis
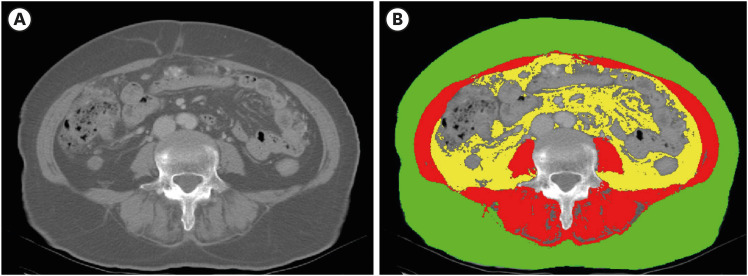
CT (General Electric, Boston, MA, USA) was performed not earlier than 30 days before the primary surgery for diagnosing ovarian cancer. CT images were analyzed by two trained physicians using the SliceOmatic software (version 5.5; TomoVision, Magog, QC, Canada). For each patient, two consecutive transverse CT images were selected from the third lumbar vertebra (L3) in axial view. Areas of skeletal muscle, subcutaneous adipose tissue, and visceral adipose tissue (cm2) from the two transverse CT images were averaged (Fig. 2A). Skeletal muscle in the L3 region included the psoas, erector spinae, quadratus lumborum, transversus abdominis, external and internal obliques, and rectus abdominis. The skeletal muscle, subcutaneous adipose, and visceral adipose areas were identified by a Hounsfield unit threshold of −29 to +150, −190 to −30, and −150 to −50, respectively.16
Fig. 2B shows skeletal muscle, subcutaneous adipose tissue, and visceral adipose tissue sections color-coded by red, green, and yellow, respectively. The SliceOmatic software coded the pixels by color and calculated the area automatically. Those three areas were adjusted by height, yielding the following indices:
Definitions
Patients were divided into two groups according to their SMI.13 The sarcopenia group included those with SMI ≤ 38.7 cm2/m2. Overall survival (OS) was defined as the time interval between diagnosis and tumor-associated death, whereas disease-free survival (DFS) was defined as the time between diagnosis and the first ovarian cancer recurrence. Overall observation time was the time interval between diagnosis and last contact or date of death. A patient whose cancer did not recur, had no disease progression, or whose death was not cancer-related was censored at the time of the last visit. Body mass index (BMI) was calculated as patient weight (kg)/height (m2), which was assessed at the time of the initial cancer diagnosis. BMI was categorized based on the Asian ethnic region as recommended by the World Health Organization.17
Statistical analysis
Continuous variables were evaluated using Shapiro-Wilk test, Kolmogorov-Smirnov test, and Q-Q plot. Depending on the normality of the distribution of continuous variables, Student's t-test or Mann-Whitney U test was used to compare median values. Chi-squared or Fisher's exact test was used for categorical variables. Survival curves were plotted using Kaplan-Meier method, and statistical significance was assessed with log-rank test. Hazards ratios (HRs) of death were analyzed using Cox proportional hazards model and calculated with 95% confidence intervals (CIs). P < 0.05 was considered significant. Statistical analyses were performed with the IBM SPSS Statistics software (version 17.0; IBM Corp., Armonk, NY, USA) and Medcalc software (version 19.1.6; MedCalc Software, Mariakerke, Belgium).
RESULTS
Patient characteristics
Eighty-two patients with early-stage ovarian cancer (FIGO stage I/II) were included. With a cutoff of ≤ 38.7 cm2/m2, patients were classified by SMI into the non-sarcopenia (n = 65) and sarcopenia (n = 17) groups. Non-epithelial cancers included granulosa cell tumors (n = 2), dysgerminomas (n = 3), endodermal sinus tumors (n = 2), choriocarcinoma (n = 1), sertoliform endometrioid carcinoma (n = 1), fibrosarcomas (n = 4), malignant Brenner tumor (n = 1), and malignant struma ovarii (n = 1). Comparison of the basic characteristics between the non-sarcopenia and sarcopenia groups is shown in Table 1. Median ages were 52 (range, 18–83) and 53 (27–76) years in the non-sarcopenia and sarcopenia groups, respectively. Median BMI was 23.1 (16.3–43.6) and 21.1 (16.5–25.4) kg/m2, respectively (P = 0.004). Anemia (< 12 g/dL) at diagnosis was documented in 40.0% (26/65) and 76.5% (13/17) of cases, respectively (P = 0.013). The albumin level was slightly lower in the sarcopenia group (4.2 [2.9–5.1] vs. 3.8 [2.3–4.5] g/dL; P = 0.007). C-reactive protein (CRP) level and erythrocyte sedimentation rate (ESR) were higher in the sarcopenia group (CRP: 2.5 [0.1–12.4] vs. 6.8 [0.1–25.5] g/dL, P = 0.047; ESR: 17.5 [2.0–64.0] vs. 62.9 [18.0–118.0] mm/hr, P = 0.001).
Table 1
Characteristics of patients
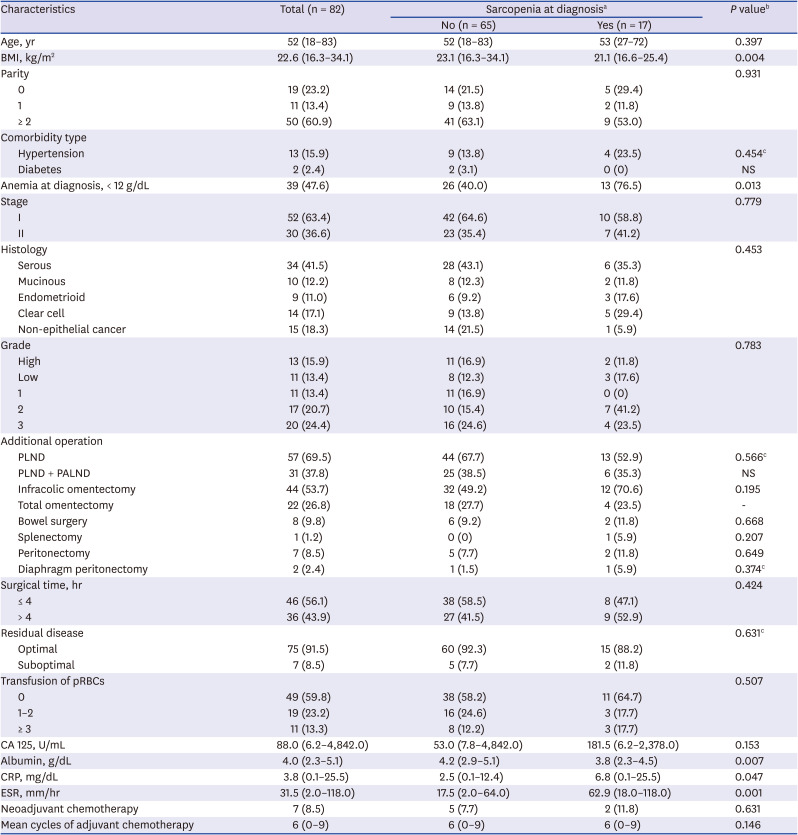
Data are presented as median (range) or number (%).
BMI = body mass index, pRBCs = packed red blood cells, CA 125 = cancer antigen 125, PLND = pelvic lymph node dissection, PALND = para-aortic lymph node dissection, CRP = C-reactive protein, ESR = erythrocyte sedimentation rate, NS = not significant.
aSarcopenia ≤ 38.7 cm2/m2; bMann-Whitney U test, χ2 test where appropriate; cFisher's exact test.
Oncologic outcomes and survival
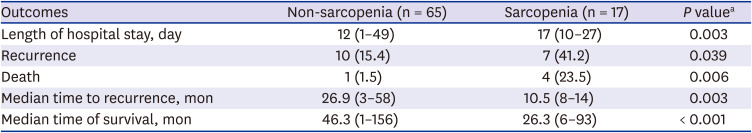
Table 2 shows the oncologic clinical outcomes of the two groups. Median hospital stay was 12 (1–49) and 17 (10–27) days for the non-sarcopenia and sarcopenia groups, respectively (P = 0.003). Number of deaths and recurrence was statistically different between the two groups (deaths: 1.5% vs. 23.5%, P = 0.006; recurrence: 15.4% vs. 41.2%, P = 0.039; non-sarcopenia vs. sarcopenia group).
Table 2
Clinical outcomes
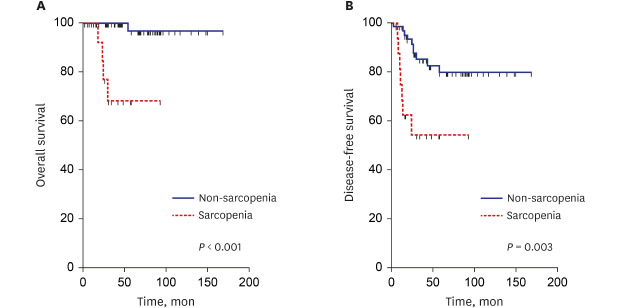
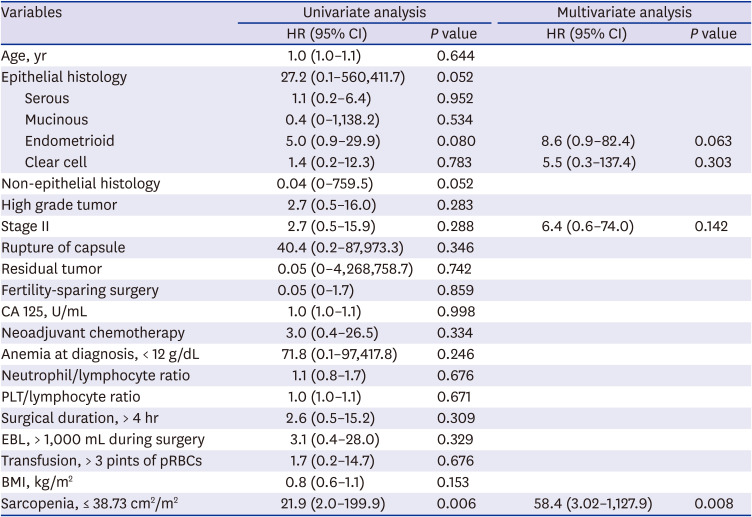
Kaplan-Meier analysis showed a significant survival disadvantage for patients with sarcopenia (P < 0.001; log-rank test) (Fig. 3A). Sarcopenia-predicted OS (HR, 58.4; 95% CI, 3.02–1,127.9; P = 0.008) was the only statistically significant variable (Table 3). DFS showed a disadvantage for patients with sarcopenia (P < 0.001; log-rank test) (Fig. 3B).
Fig. 3
Kaplan-Meier survival curves and log-rank tests. (A) Overall survival in patients with early-stage (FIGO stage I/II) ovarian cancer according to SMI. (B) Disease-free survival in patients with advanced ovarian cancer (FIGO stage I/II) according to SMI.
FIGO = International Federation of Gynecology and Obstetrics, SMI = skeletal muscle index.
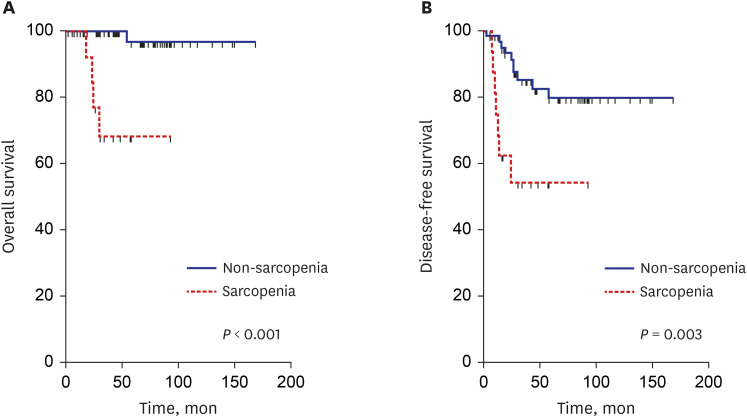
Table 3
Clinical variables affecting survival
DISCUSSION
We found a strong association of presurgical sarcopenia (SMI ≤ 38.7 cm2/m2) with both OS and DFS. Median OS of sarcopenic patients was nearly half of that of nonsarcopenic patients.
Cachexia is a common manifestation in chronic debilitating diseases such as cancer; changes in body composition may commence long before the disease fully develops. Ascites is frequently formed in advanced ovarian cancer, masking cachexia, and sarcopenia has received more interest in a hope to foretell prognosis earlier.13
Shen et al.18 first observed the skeletal muscle volume on cross-sectional CT images while evaluating adipose tissue distribution. A decade later, Martin et al.19 reported that skeletal muscle depletion evaluated on CT predicted survival of lung or gastrointestinal cancers, regardless of obesity. Other reports investigated the impact of sarcopenia on predicting prognosis of cancers from multiple sites including lung, gastrointestinal tract, kidney, and breast.245 In 2015, Aust et al.6 firstly reported that skeletal muscle depletion was an important prognosticator of ovarian cancer (HR, 2.25; P = 0.028). However, others recently contradicted the idea of sarcopenia as a prognostic factor of ovarian cancer, making this issue unresolved.11 Notably, Ubachs et al.12 conducted a meta-analysis and reported that sarcopenia is associated with ovarian cancer survival, adding that the source data were mainly retrospective in nature and of low quality. The current study showed that OS of ovarian cancer patients was poor when they had sarcopenia even in the early stages; the result of which is unprecedented in previous studies for ovarian cancer.
Interestingly, BMIs were different between the sarcopenia and non-sarcopenia groups, however BMI per se was not associated with OS in the current study. Obesity is another prognostic factor considered for cancer.20 Moreover, the association between obesity and cancer survival shows a U- or J shape that it is referred to as ‘obesity paradox’.21 It is unclear whether this survival benefit of extra-weight is from the selection bias or counteraction of necessary muscle and adipose reserve to the negative metabolic consequences of cancer.2223 In advanced ovarian cancer, some argued that body composition such as sarcopenia may better reflect the nutritional status than body mass because ascites disguises malnourishment.8 Ascites is relatively scarce in early ovarian cancer, adding yet another benefit to body composition, as a prognosticator.
The mechanism of sarcopenia has still not been fully elucidated but its potential causes, including inflammatory reaction, inactivity, nutritional factors, or aging, have been proposed. Sarcopenia is frequently observed in chronic inflammatory conditions, such as autoimmune diseases and advanced cancers. Muscle catabolism is mediated by cytokines, such as interleukin-6, tumor necrosis factor-alpha, and transforming growth factor beta.2425 Myokines, also known as interleukin-15, are skeletal muscle-derived cytokines and growth factors. Myostatin, a representative myokine, is found to be related to both osteoporosis and sarcopenia according to genome-wide association studies.26 CRP was consistently elevated in cancer patients with sarcopenia from multiple reports.272829 The current study showed relevant results that CRP was higher in sarcopenia patients, supporting that the condition was caused by chronic inflammation. Ovarian function may directly affect the body composition. When young ovarian tissues were transplanted to post-reproductive-age mice, sarcopenia was restored.30 This experiment suggests that sarcopenia in ovarian cancer, even in its early stage, may be induced by destruction and decreased ovarian function.
The most common imaging technique to evaluate muscle mass or lean body mass are DXA, CT scan and magnetic resonance imaging (MRI). DXA is a safe and accurate imaging modality for estimating skeletal muscle mass advocated by many but not all as the gold standard.31 In a study to validate the accuracy of body composition prediction, DXA showed high accuracy in predicting appendicular skeletal muscle mass while tended to be affected by body thickness and abnormalities in hydration status (e.g., water retention such as ascites, heart, kidney, or liver failure) in measuring muscle mass.32 CT is widely used pre-operatively for evaluating ovarian tumor, and is an indispensable imaging modality especially when ovarian malignancy is forecasted. CT was the first method introduced that could quantify regional skeletal muscle mass with high accuracy.33 Lee et al.34 reviewed the diagnostic techniques characterizing sarcopenia, and data on error of lean body mass estimate were DXA < 5%, CT < 8.5%, and MRI 6%–8.5%. Notably, CT showed high correlation to DXA (correlation between DXA and CT in bio-impedance at level of L3 alone and whole body: r = 0.84 and 0.83, respectively). CT is a practical and precise approach to quantification of body composition in ovarian cancer patients during routine care.16
Although most authors adopted the measurement of skeletal muscle volume by digital quantification in cross-sectional images of L3,683536 Rutten et al.37 contradicted the previous finding of the psoas area as a representative skeletal muscle volume in ovarian cancer. They found that the correlation between total skeletal muscle and psoas muscle areas was weak (r = 0.52). The lower vertebral level supposedly represents the bulkiest area of the back muscles. However, this may not be applicable in patients with ascites whose body figure is distorted. In early ovarian cancer, L3 is still the best candidate level for measuring skeletal muscle volume because ascites is not common.
The cutoff value of SMI for defining sarcopenia has not been definitively determined. Previous reports were not consistently clear enough regarding whether SMI affects OS or patients' prognosis, and the optimal cutoff point of SMI was inconsistent. Bronger et al.36 defined sarcopenia as SMI ≤ 38.5 cm2/m2 in ovarian cancer patients and showed that sarcopenia significantly reduced progression-free survival (HR, 2.52; 95% CI, 1.10–5.81; P = 0.030) and OS (HR, 2.89; 95% CI, 1.11–7.54; P = 0.031) in the multivariate analysis. The pivotal trial by Prado et al.2 demonstrated that sarcopenia patients with SMI cutoff value of 38.5 cm2/m2 have significantly poorer OS than non-sarcopenic patients with cancer. Rutten et al.13 defined sarcopenia as SMI ≤ 38.73 cm2/m2 for predicting the survival outcome in ovarian cancer patients who underwent primary debulking surgery; the criteria of which were used in this study as well. Their results showed a significant survival disadvantage for sarcopenia patients compared to non-sarcopenia patients in the Kaplan-Meier analysis (P = 0.010). Sarcopenia negatively affected OS (HR, 1.536; 95% CI, 1.105–2.134; P = 0.011) in the univariate analysis, but the difference was not significant in the multivariate analysis (HR, 1.362; 95% CI, 0.968–1.916; P = 0.076).13 In the meta-analysis by Ubachs et al.,12 the SMI cutoff value varied from 38.5 to 41.5 cm2/m2. There were significant associations between SMI and OS in both univariate (HR, 1.11; 95% CI, 1.03–1.20; P = 0.007) and multivariate analyses (HR, 1.17; 95% CI, 1.03–1.33; P = 0.020). However, grading of recommendations of assessment, development, and evaluation (GRADE) assessment of OS based on SMI was very low, and multivariate data were likely to be lower than those of other studies. They also discussed the weakness of a meta-analysis involving studies using different cutoff points to define sarcopenia, leading to heterogeneity of sarcopenia prevalence. They recommended future assessments of sarcopenia and ovarian cancer survival with lower cutoff values between 38.5 and 38.73 cm2/m2.
Currently, Food and Drug Administration has not approved any agent for treating or preventing sarcopenia and novel therapies are in clinical development. Selective androgen receptor modulators (SARMs) are among those of interest. SARMs activates androgenic signaling in tissue a specific way, and gains in skeletal muscle mass and strength without dose-limiting adverse events was reported.38 Nutrition and exercise are cornerstone in management of sarcopenia. High protein intake above the Recommended Daily Allowance (in the range of 1.2 to 1.6 g/kg per day) was suggested to prevent age-related sarcopenia.39 Both resistance training and strength training of muscles have been shown to be successful interventions for sarcopenia.40 A meta-analysis revealed benefit of using combined approach of dietary supplementations and exercise.41
The current study exclusively included a Korean population, and ethnicity may potentially affect the SMI cutoff value. Standard BMI of Asians differ from that of Western populations. BMI is among the methods of measuring body compositions, and SMI is similar to BMI, as it measures body composition as well. Yoshikawa et al.35 suggested that psoas muscle volume affects peripheral neurotoxicity after primary chemotherapy in the Japanese population. The cutoff value for sarcopenia among Asians with different body configurations from those of Western populations should be reevaluated in future analysis.
The main limitation of this study was its retrospective nature and the relatively small number of subjects from a single institution. Second, 20 patients had follow-up time gaps of 1 to 6 years at the time of data collection. It might influence the OS or PFS, but the time gap of the last follow-up was no longer than 7 years. Third, the follow-up time was median 42 months in this study, which is not enough to predict the whole life time of early stage ovarian cancer.
In conclusion, our data showed marked survival difference in patients with ovarian cancer according to the presence of sarcopenia, even in their early stages. This study is the first to identify sarcopenia as a predictor of survival in patients with early-stage ovarian cancer. Considering that the grave prognosis of ovarian cancer largely originates from its covertness, early identification of women at a higher risk would improve the prognosis of this notoriously fatal disease.
 XML Download