Journal List > J Korean Med Sci > v.35(13) > 1146282

Choi, Song, Kim, Kim, and Moon: The Utility of the Random Urine Uric Acid-to-Creatinine Ratio for Patients with Gout Who Need Uricosuric Agents: Retrospective Cross-Sectional Study

Abstract

Background

The 24-hour uric acid excretion measurement is important in assessing disease status and helping to select the appropriate uric acid-lowering agent for patients with gout, however, it is inconvenient. The authors investigated the efficacy of the random urine uric acid-to-creatinine (UA/CR) ratio to screen the patients who under-secreted 24-hour urine uric acid.

Methods

This was a retrospective cross-sectional study. Ninety patients with gout, without undergoing uric acid-lowering treatment were enrolled. Twenty-four-hour urine and random urine samples were obtained on the same day. Six hundred mg of uric acid in the 24-hour urine sample was used as a standard for distinguishing between over and under-excretion groups.

Results

The random urinary UA/CR ratio showed positive correlation with 24-hour urine uric acid excretion (γ = 0.398, P < 0.001). All the patients with the random UA/CR less than 0.2 excreted less than 600 mg uric acid in 24-hour urine collection. When the random urine UA/CR ratio < 0.2 was regarded as a positive result, the positive predictive value, negative predictive value, sensitivity, and specificity in the uric acid under-excretion were 100% (8 of 8), 64.6% (53 of 82), 21.6% (8 of 37), and 100% (53 of 53), respectively.

Conclusion

There is a moderate positive correlation between the random urinary UA/CR ratio and 24-hour urine uric acid excretion, so that UA/CR ratio may not be a good predictor of 24-hour urine uric acid excretion. However, the random urine UA/CR ratio 0.2 can be a useful predictor to screen the gouty patients who need to be treated with uricosuric drugs.

Graphical Abstract

jkms-35-e95-abf001.jpg

INTRODUCTION

Gout is one of a heterogeneous group of diseases related to hyperuricemia. The causes of uric acid elevation can be divided into either excessive uric acid production or decreased uric acid excretion. Xanthine oxidase inhibitors that block uric acid production are the usual first-choice of urate-lowering therapy,12 but uricosuric drugs, such as probenecid, benzbromarone and sulfinpyrazone, are also effective at reducing serum uric acid levels. However, uricosuric agents can be used in patients with good renal function who excrete uric acid of < 600 mg/day,3 because higher concentrations of uric acid in the collecting tubules can predispose to uric acid stone formation.4 The most effective method to measure the amount of urinary uric acid excretion is the 24-hour urine collection. However, there are several disadvantages in 24-hour urine collection, that is, it is cumbersome, inconvenient, and sometimes unreliable because of errors in sample collection. Therefore, the authors investigated the efficacy of the random urine uric acid-to-creatinine (UA/CR) ratio, as a simpler alternative to the 24-hour urine collection, to screen the patients with gout who excrete 24-hour urine uric acid less than 600 mg/day.

METHODS

Study design and patient population

This retrospective cross-sectional study included 90 patients with gout. Gout was diagnosed in accordance with the 2015 American College of Rheumatology/European League Against Rheumatism diagnostic criteria.5 Consecutive patients with gout were enrolled from inpatient and outpatient clinics at Chung-Ang University Hospital in Seoul, Korea between January 2015 and June 2017. All patients were ≥ 18 years of age with a diagnosis of gout. The patients with neoplasms, infectious diseases, thyroid diseases and other autoimmune rheumatic comorbidities, such as rheumatoid arthritis and systemic lupus erythematosus were excluded in this study.

Sample collection

Clinical and laboratory data were collected at the blood sampling. Serum glucose, uric acid, blood urea nitrogen, creatinine (Cr), cholesterol profile, and other laboratory investigations were performed in all participants. The estimated glomerular filtration rate (eGFR) was calculated using the modification of diet in renal disease (MDRD) formula: eGFR (mL/min/1.73 m2) = 175 × serum Cr (exp [−1.154]) × age (exp [−0.203]) × (0.742 if women) × (1.21 if black).6 Chronic kidney disease (CKD) was defined as a GFR of < 60 mL/min/1.73 m2.
For the evaluation of uric acid excretion and renal function, patients were required to collect 24-hour urine samples. Random urine uric acid and Cr specimens were obtained on the same day as the 24-hour urine sample collection. There were no dietary restrictions, other than for alcoholic beverages, throughout the 24-hour urine collection period. None of the patients was undergoing any kind of uric acid-lowering agent treatment nor taking diuretics at the time of enrollment into the study. Six hundred mg of uric acid in the 24-hour urine sample was used as the standard for dividing over- and under-excretion groups.3 Random urine uric acid and Cr concentrations were measured using an enzymatic color test and a kinetic color test, respectively, with commercial kits (AU Uric Acid reagent, AU Cr reagent, Beckman CoulterTM, Brea, CA, US). The random urine UA/CR ratio was calculated as (random urine uric acid)/(random urine Cr).

Statistical analysis

Continuous variables were expressed as mean ± standard deviation (SD), and categorical variables as absolute numbers with percentages. All data were tested for normality before the statistical analysis. The Shapiro-Wilk test was performed to determine the normality of the distribution of the parameters. Comparisons between the groups were performed using student's t-test for continuous variables with normal distribution, and the χ2 test or Fisher's exact test for categorical variables. Data that did not show a normal distribution were presented as medians with an interquartile range and were compared using the Mann-Whitney U-test. The correlation between two variables was analyzed using Person's correlation coefficient. A linear regression analysis was used to evaluate the relative contribution of the random urine UA/CR ratio. Receiver operating characteristic (ROC) curve was plotted, and the area under the curve (AUC) was considered to indicate the predictive value of UA/CR ratio in distinguishing uric acid under-excretion group. In addition, the best discrimination cutoff value for UA/CR ratio was explored, which corresponds to the value where sensitivity plus specificity is maximized. In all analyses, a P value of < 0.05 was considered to be statistically significant. All statistical analyses were conducted using SPSS Statistics version 20.0 (SPSS Corp., Armonk, NY, USA).

Ethics statement

This study was approved by the Institutional Review Board (IRB) of Chung-Ang University Hospital (IRB No. 1708-004-16090), and informed consent was waived.

RESULTS

Clinical characteristics of participants

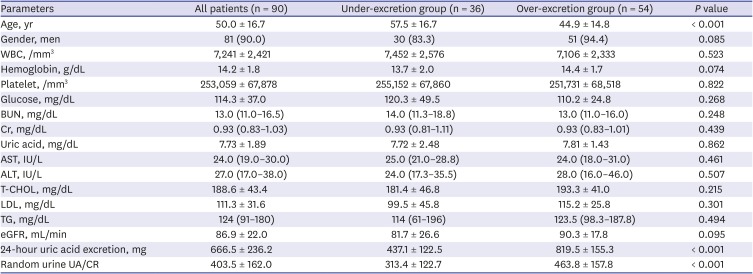
The baseline characteristics of the participants are summarized in Table 1. The mean age was 50.0 ± 16.7 years old and men patients comprised 90.0% (81/90) of all participants. The mean serum Cr and uric acid levels were 0.96 ± 0.28 mg/dL and 7.73 ± 1.89 mg/dL, respectively, and the mean 24-hour urinary uric acid excretion was 666.5 ± 236.2 mg. The number of patients with uric acid over-excretion was 54 (60.0%). The mean 24-hour urinary acid excretion of uric acid in the over-excretion and under-excretion groups was 819.5 ± 155.3 mg and 437.1 ± 122.5 mg, respectively (P < 0.001). Apart from age, there was no difference in gender, serum uric acid level, or renal function between the two groups. The number of patients with CKD was 8 (8.9%).
Table 1

Baseline clinical characteristics and laboratory findings of the study participants

jkms-35-e95-i001
Parameters All patients (n = 90) Under-excretion group (n = 36) Over-excretion group (n = 54) P value
Age, yr 50.0 ± 16.7 57.5 ± 16.7 44.9 ± 14.8 < 0.001
Gender, men 81 (90.0) 30 (83.3) 51 (94.4) 0.085
WBC, /mm3 7,241 ± 2,421 7,452 ± 2,576 7,106 ± 2,333 0.523
Hemoglobin, g/dL 14.2 ± 1.8 13.7 ± 2.0 14.4 ± 1.7 0.074
Platelet, /mm3 253,059 ± 67,878 255,152 ± 67,860 251,731 ± 68,518 0.822
Glucose, mg/dL 114.3 ± 37.0 120.3 ± 49.5 110.2 ± 24.8 0.268
BUN, mg/dL 13.0 (11.0–16.5) 14.0 (11.3–18.8) 13.0 (11.0–16.0) 0.248
Cr, mg/dL 0.93 (0.83–1.03) 0.93 (0.81–1.11) 0.93 (0.83–1.01) 0.439
Uric acid, mg/dL 7.73 ± 1.89 7.72 ± 2.48 7.81 ± 1.43 0.862
AST, IU/L 24.0 (19.0–30.0) 25.0 (21.0–28.8) 24.0 (18.0–31.0) 0.461
ALT, IU/L 27.0 (17.0–38.0) 24.0 (17.3–35.5) 28.0 (16.0–46.0) 0.507
T-CHOL, mg/dL 188.6 ± 43.4 181.4 ± 46.8 193.3 ± 41.0 0.215
LDL, mg/dL 111.3 ± 31.6 99.5 ± 45.8 115.2 ± 25.8 0.301
TG, mg/dL 124 (91–180) 114 (61–196) 123.5 (98.3–187.8) 0.494
eGFR, mL/min 86.9 ± 22.0 81.7 ± 26.6 90.3 ± 17.8 0.095
24-hour uric acid excretion, mg 666.5 ± 236.2 437.1 ± 122.5 819.5 ± 155.3 < 0.001
Random urine UA/CR 403.5 ± 162.0 313.4 ± 122.7 463.8 ± 157.8 < 0.001
Data are presented as mean ± standard deviation or median (interquartile range) or number (%).
WBC = white blood cell, BUN = blood urea nitrogen, Cr = creatinine, AST = aspartate aminotransferase, ALT = alanine aminotransferase, T-CHOL = total cholesterol, LDL = low-density lipoprotein cholesterol, TG = triglyceride, eGFR = estimated glomerular filtration rate, UA/CR = uric acid-to-creatinine ratio.

Effectiveness of the random urine UA/CR ratio in distinguishing uric acid under-excretion

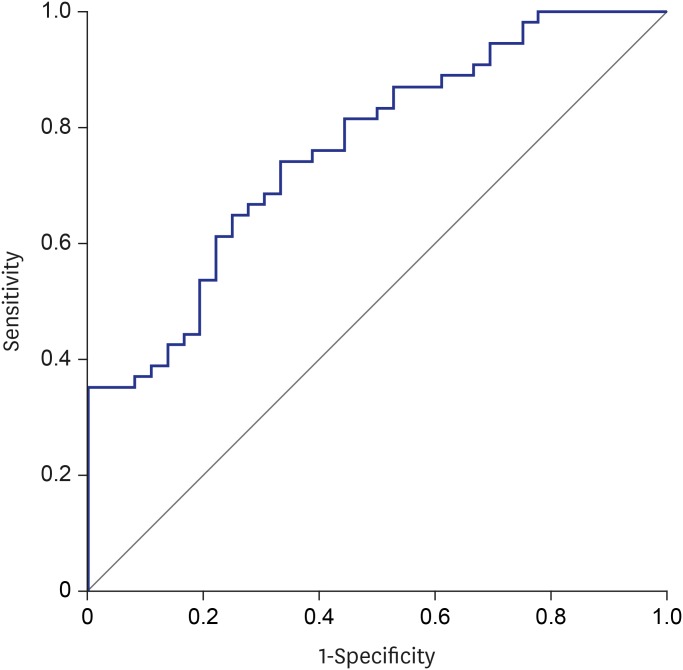
ROC plots were used to determine the cut-off value of the random urine UA/CR ratio in distinguishing uric acid under-excretion (< 600 mg/day) patients. The best cut-off value of the random urine UA/CR ratio was 0.342, with a sensitivity of 74.1%, specificity of 66.7%. The areas under the curves (AUCs) of the random urine UA/CR ratio was 0.763 (95% confidence interval [CI], 0.665–0.861; P < 0.001) (Fig. 1).
Fig. 1

Receiver operation characteristic curves for the random urine uric acid-to-creatinine ratio to discriminate 24-hour urine uric acid excretion > 600 mg.

jkms-35-e95-g001

The relationship between 24-hour urine uric acid excretion and the random urine uric acid-to-Cr ratio

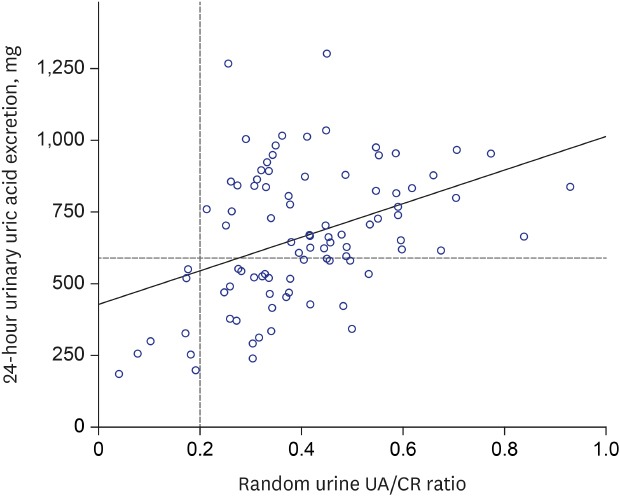
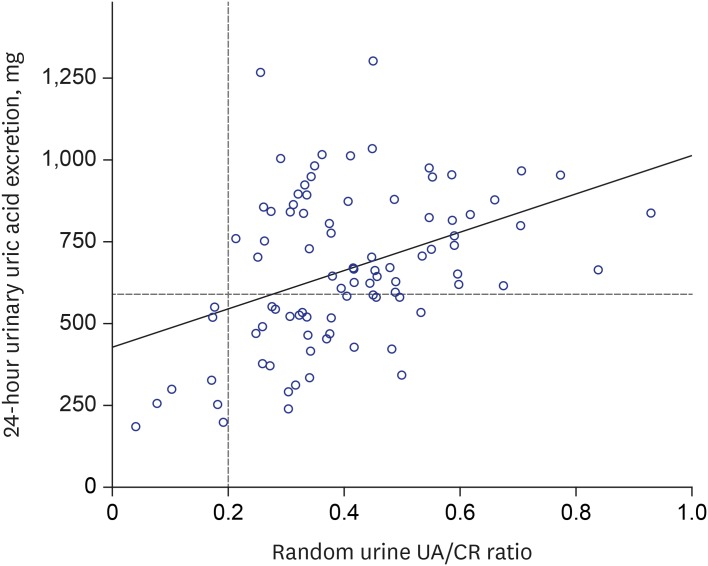
The random urinary UA/CR ratio showed a moderate positive correlation with 24-hour urine uric acid excretion (γ = 0.398, P < 0.001) (Fig. 2). Correlation between these two variables was also found in the patients with CKD (γ = 0.762, P = 0.028). In the linear regression analysis, absolute 24-hour urine uric acid excretion was estimated to be 581 × (random urinary UA/CR) + 432 (P < 0.001, adjusted R2 = 0.398).
Fig. 2

The correlations between 24-hour urine uric acid excretion and the random urine UA/CR.

UA/CR = uric acid-to-creatinine ratio.
jkms-35-e95-g002
As shown in Fig. 2, all the patients with the random UA/CR less than 0.2 excreted less than 600 mg uric acid in 24-hour urine collection. When the random urine UA/CR ratio < 0.2 was regarded as a positive result, the positive predictive value, negative predictive value, sensitivity, and specificity in the uric acid under-excretion were 100% (8 of 8), 64.6% (53 of 82), 21.6% (8 of 37), and 100% (53 of 53), respectively.

DISCUSSION

In our study, we found a moderate correlation between the random urine UA/CR ratio and 24-hour urine uric acid excretion. We detected the uric acid under-excretion group, with a cut-off value of urine UA/CR ratio 0.342. However, the random UA/CR less than 0.2 detected all the patients less than 600 mg uric acid in 24-hour urine collection (the positive predictive value, 100%). Therefore, this study suggests that UA/CR 0.2 would be a useful predictor to screen gouty patients who can be treated with uricosuric drugs.
There has been one previous study comparing the spot UA/CR ratio with 24-hour urine uric acid excretion in patients with gout and it evaluated whether the spot UA/CR ratio is useful for the estimation of urine uric acid over-excretion.7 Moriwaki et al.7 showed a statistically significant correlation between 24-hour urine uric acid excretion and the spot urine UA/CR ratio. They defined over-excretion as above 1,000 mg/day, and the cutoff value was defined as a mean + 2 SD. The cutoff value of the spot urine UA/CR ratio was 0.63, and the diagnostic accuracy of uric acid over-excretion was 87.2%, but the sensitivity was 25.0%. The sensitivity was so low in that study that the possibility of uric acid over-excretion could not be ruled out. Therefore, it was concluded the UA/CR ratio using spot urine was not an accurate indicator of uric acid over-excretion in patients with gout.
That previous study had similar findings to our study. Our study showed the random urinary UA/CR ratio correlated with the 24-hour urine uric acid excretion. Furthermore, the correlation between them was similar in CKD patients with a GFR < 60 mL/min/1.73 m2. There are many cases of decreased renal function among patients with gout, so that this result suggests that the random urine UA/CR ratio may be useful even for CKD patients. In contrast, our study defined uric acid over-excretion as 600 mg/day. There are various opinions about the standard of uric acid over excretion from 600 mg to 700 mg, 800 mg and 1,000 mg.3789 There is not the exact standard of uric acid over excretion. The paper of Perez-Ruiz et al.8 showed that mean and median uric acid excretion in healthy subjects for 24 hours were 594 ± 143 mg, and 605 mg/day/1.73 m2, respectively. However, any authors of the above papers including the Harrison's textbook did not explain how and why to set those values as the standards for uric acid over-excretion in detail.3789 In the present study, the authors looked for a minimal cut-off value that could safely use the uricosuric agent. Therefore, the research was carried out based on 600 mg, the lowest risk of uric acid stone formation.
Recently, there has been a study on the correlation between 24-hour urine uric acid excretion and UA/CR ratio in random and morning urine for individuals regardless of gout.10 In that study, the correlation coefficients were 0.193 in random urine and 0.219 in morning urine, which were slightly lower than the result of our study.
The random urine UA/CR ratio showed positive correlation with 24-hour uric acid excretion, but less correlation compared to the results of the random urine protein-to-Cr ratio and 24-hour urine protein excretion.111213 One study showed the correlation coefficient (r) was 0.9 between the random urine protein-to-Cr ratio and 24-hour urine protein excretion.12
A question emerges as to why the correlation coefficient of our study was relatively lower than that of the study on the urine protein-to-Cr ratio, for which there are several possible answers. First, there is the difference in the mechanism in which uric acid and protein are excreted in the kidney. Renal excretion of uric acid represents approximately 60% to 70% of total uric acid excretion from the body.14 A smaller proportion of uric acid is secreted in the intestine and is further metabolized by resident gut bacteria.14 Most uric acid is freely filtered in the kidney, and tubular secretion and reabsorption coexist along the entire length of the proximal tubule.15 Roughly 90% of the filtered load is normally reabsorbed along the nephron, so that the fractional excretion of uric acid averages 5% to 10%.16 URAT1 and GLUT5 are considered as the main pathways of urate reabsorption, and ABCG2 is the major efflux pathway on the apical side.17 Drugs such as probenecid and losartan inhibit URAT1, accounting for their uricosuric effect.1819 In contrast, most of the proteins, especially albumin, that are filtered from the kidney are excreted in the urine.
Additionally, the range of daily proteinuria was very wide, ranging from 0.03 to 10 g. However, the range of daily urinary uric acid excretion was approximately 0.02 to 1.5 g. As the range of uric acid excretion was narrower compared with the proteinuria range, a small error in the measured value may also have caused a statistical difference.
Our study was performed as a retrospective study, so we could not collect the urine samples at the same time of the day, unfortunately. We did not attempt to limit the time to collect random urine, or food consumption or the ordinary activities of daily life. Several factors affect urinary uric acid concentration, including circadian rhythm, eating habits, and physical activity.720 The highest uric acid concentration in healthy participants has been reported between 5 a.m. and 8 a.m. and the lowest between 11 p.m. and 2 a.m.20 We did not attempt to limit the time to collect random urine, or food consumption or the ordinary activities of daily life. This is a weak point of this study. The second limitation of this study is the lack of healthy control. However, it is known that there is a difference in uric acid excretion between healthy and gouty patients.821 Therefore, this study was focused on the patients with gout and was intended to evaluate whether the random urine UA/CR ratio could be helpful for the screening in patients with gout planning to use uricosuric agents. Finally, our study involved a small population. If more patients had been enrolled, more accurate results might have been obtained. Therefore, further research needs to be done involving more patients.
In conclusion, the random urine UA/CR ratio weakly correlated with 24-hour urine uric acid excretions in patients with gout. However, the random urine UA/CR ratio 0.2 would be a useful predictor to screen the gouty patients who excrete 24-hour urine uric acid less than 600 mg/day, so that, need to be treated with uricosuric drugs.

Notes

Presentation: The preliminary version of this paper was presented at the annual European League Against Rheumatism (EULAR) meeting under the following title: Choi ST, Moon SJ, Kang EJ, Lee KH. Validity of random urinary uric acid-to-creatinine ratio for estimating 24-hour urine uric acid excretion in patients with gout. Ann Rheum Dis 2018;77(Suppl 2):664. https://ard.bmj.com/content/77/Suppl_2/664.2.

Funding: This research was supported by Basic Science Research Program through the National Research Foundation of Korea (NRF) funded by the Ministry of Education, Korea (2018R1D1A1B07049248).

Disclosure: The authors have no potential conflicts of interest to disclose.

Author Contributions:

  • Conceptualization: Choi ST, Moon SJ.

  • Data curation: Choi ST, Song JS.

  • Formal analysis: Choi ST, Kim SJ, Kim CH.

  • Investigation: Moon SJ, Kim SJ, Kim CH.

  • Methodology: Choi ST, Moon SJ.

  • Software: Choi ST.

  • Validation: Choi ST, Moon SJ.

  • Writing - original draft: Choi ST.

  • Writing - review & editing: Moon SJ.

References

1. Khanna D, Fitzgerald JD, Khanna PP, Bae S, Singh MK, Neogi T, et al. 2012 American College of Rheumatology guidelines for management of gout. Part 1: systematic nonpharmacologic and pharmacologic therapeutic approaches to hyperuricemia. Arthritis Care Res (Hoboken). 2012; 64(10):1431–1446. PMID: 23024028.
crossref
2. Richette P, Doherty M, Pascual E, Barskova V, Becce F, Castañeda-Sanabria J, et al. 2016 updated EULAR evidence-based recommendations for the management of gout. Ann Rheum Dis. 2017; 76(1):29–42. PMID: 27457514.
crossref
3. Schumacher HR, Chen LX. Gout and other crystal-associated arthropathies. In : Kasper DL, Fauci AS, Hauser SL, Longo DL, Jameson JL, Loscalzo J, editors. Harrison's Principles of Internal Medicine. 19th ed. New York, NY: McGraw-Hill Education;2015. p. 2234.
4. Perez-Ruiz F, Hernandez-Baldizon S, Herrero-Beites AM, Gonzalez-Gay MA. Risk factors associated with renal lithiasis during uricosuric treatment of hyperuricemia in patients with gout. Arthritis Care Res (Hoboken). 2010; 62(9):1299–1305. PMID: 20506124.
crossref
5. Neogi T, Jansen TL, Dalbeth N, Fransen J, Schumacher HR, Berendsen D, et al. 2015 Gout Classification Criteria: an American College of Rheumatology/European League Against Rheumatism collaborative initiative. Arthritis Rheumatol. 2015; 67(10):2557–2568. PMID: 26352873.
crossref
6. Levey AS, Bosch JP, Lewis JB, Greene T, Rogers N, Roth D, et al. A more accurate method to estimate glomerular filtration rate from serum creatinine: a new prediction equation. Ann Intern Med. 1999; 130(6):461–470. PMID: 10075613.
crossref
7. Moriwaki Y, Yamamoto T, Takahashi S, Yamakita J, Tsutsumi Z, Hada T. Spot urine uric acid to creatinine ratio used in the estimation of uric acid excretion in primary gout. J Rheumatol. 2001; 28(6):1306–1310. PMID: 11409124.
8. Perez-Ruiz F, Calabozo M, Erauskin GG, Ruibal A, Herrero-Beites AM. Renal underexcretion of uric acid is present in patients with apparent high urinary uric acid output. Arthritis Rheum. 2002; 47(6):610–613. PMID: 12522834.
crossref
9. Simkin PA, Hoover PL, Paxson CS, Wilson WF. Uric acid excretion: quantitative assessment from spot, midmorning serum and urine samples. Ann Intern Med. 1979; 91(1):44–47. PMID: 464453.
crossref
10. Shojaei-Far Z, Razi F, Bandarian F, Rambod C, Qorbani M. A detailed comparison of morning and random urine specimen levels with 24 hour urinary excretion levels of seven biochemical parameters with a proposed formula. Ann Clin Lab Sci. 2017; 47(2):201–207. PMID: 28442523.
11. Rodby RA, Rohde RD, Sharon Z, Pohl MA, Bain RP, Lewis EJ, et al. The urine protein to creatinine ratio as a predictor of 24-hour urine protein excretion in type 1 diabetic patients with nephropathy. Am J Kidney Dis. 1995; 26(6):904–909. PMID: 7503064.
crossref
12. Ruggenenti P, Gaspari F, Perna A, Remuzzi G. Cross sectional longitudinal study of spot morning urine protein:creatinine ratio, 24 hour urine protein excretion rate, glomerular filtration rate, and end stage renal failure in chronic renal disease in patients without diabetes. BMJ. 1998; 316(7130):504–509. PMID: 9501711.
crossref
13. Inker LA, Schmid CH, Tighiouart H, Eckfeldt JH, Feldman HI, Greene T, et al. Estimating glomerular filtration rate from serum creatinine and cystatin C. N Engl J Med. 2012; 367(1):20–29. PMID: 22762315.
crossref
14. Rees F, Hui M, Doherty M. Optimizing current treatment of gout. Nat Rev Rheumatol. 2014; 10(5):271–283. PMID: 24614592.
crossref
15. So A, Thorens B. Uric acid transport and disease. J Clin Invest. 2010; 120(6):1791–1799. PMID: 20516647.
crossref
16. Maesaka JK, Fishbane S. Regulation of renal urate excretion: a critical review. Am J Kidney Dis. 1998; 32(6):917–933. PMID: 9856507.
crossref
17. Enomoto A, Kimura H, Chairoungdua A, Shigeta Y, Jutabha P, Cha SH, et al. Molecular identification of a renal urate anion exchanger that regulates blood urate levels. Nature. 2002; 417(6887):447–452. PMID: 12024214.
18. Miyazaki H, Sekine T, Endou H. The multispecific organic anion transporter family: properties and pharmacological significance. Trends Pharmacol Sci. 2004; 25(12):654–662. PMID: 15530644.
crossref
19. Hamada T, Ichida K, Hosoyamada M, Mizuta E, Yanagihara K, Sonoyama K, et al. Uricosuric action of losartan via the inhibition of urate transporter 1 (URAT 1) in hypertensive patients. Am J Hypertens. 2008; 21(10):1157–1162. PMID: 18670416.
crossref
20. Vahlensieck EW, Bach D, Hesse A. Circadian rhythm of lithogenic substances in the urine. Urol Res. 1982; 10(4):195–203. PMID: 7179612.
crossref
21. Puig JG, Torres RJ, de Miguel E, Sánchez A, Bailén R, Banegas JR. Uric acid excretion in healthy subjects: a nomogram to assess the mechanisms underlying purine metabolic disorders. Metabolism. 2012; 61(4):512–518. PMID: 22001332.
crossref
TOOLS
Similar articles