

 PDF
PDF Citation
 Print
Print


INTRODUCTION
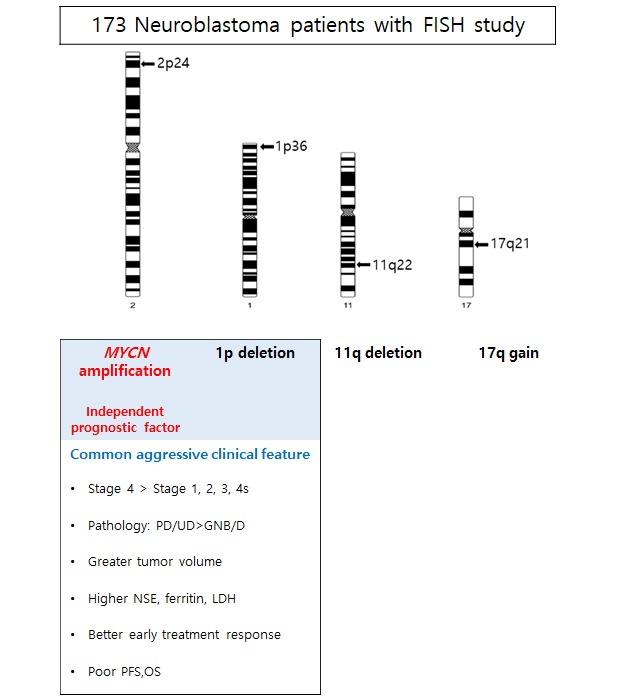
Neuroblastoma is known for its complex behavior from a very benign tumor to a highly aggressive metastatic tumor with poor prognosis. Traditionally, patients with neuroblastoma have been stratified into different risk groups according to age, stage, pathology, and segmental chromosomal aberrations (SCAs).1 Since it was first reported in 1983, MYCN has become the most well studied SCA.2
MYCN amplification has been confirmed as a poor risk factor in many previous studies including ours.3456 In addition to MYCN amplification, the clinical significance of other SCAs, including 1p deletion, 11q deletion, and 17q gain, has also been studied.7891011121314 From previous reports, 1p deletion, 11q deletion, and 17q gain are generally known for adverse prognostic factors, but there are still some controversies.91012 With this background, MYCN amplification and 11q deletion are included as risk factors in the International Neuroblastoma Risk Group (INRG) stratification.15 While many Western studies have reported the incidence and clinical significance of SCAs in neuroblastoma, there is no study in Korean neuroblastoma patients. For this reason, we analyzed the incidence and clinical significance of four SCAs (MYCN amplification, 1p deletion, 11q deletion, and 17q gain) in Korean patients diagnosed with neuroblastoma.
Go to : 
METHODS
Patients
Patients diagnosed with neuroblastoma from 2012 to 2018 at Samsung Medical Center were included for retrospective medical review.
Patients transferred from other hospitals with inappropriate tumor specimens for fluorescence in situ hybridization (FISH) were excluded from the analysis. Patients were staged according to the International Neuroblastoma Staging System.16 Pathologic results were classified as ganglioneuroblastoma/differentiating neuroblastoma or poorly differentiated/undifferentiated neuroblastoma. Serum lactic dehydrogenase (LDH), ferritin, neuron-specific enolase (NSE), and urine vanillylmandelic acid (VMA) were routinely measured at diagnosis. Patients were stratified into low-risk, intermediate-risk, and high-risk groups based on age at diagnosis, stage, and MYCN status. In brief, stage 1, 2, and 4S tumors without MYCN amplification were stratified as low-risk tumors, whereas stage 4 tumors in patients older than 18 months or any tumors with amplified MYCN were stratified as high-risk tumors. All other tumors were stratified as intermediate-risk.17
FISH
MYCN amplification, 1p deletion, 11q deletion, and 17q gain were determined using FISH from paraffin-embedded tissue obtained by biopsy or surgery at initial diagnosis. For each FISH study, 50 non-overlapping nuclei were counted and the following probes were used: Vysis LSI N-MYC (2p24) SpectrumGreen/CEP2 SpectrumOrange, Vysis LSI ATM (11q22) SpectrumOrange/CEP11 SpectrumGreen, Vysis TOP2A (17q21)/CEP17 FISH (Abbott Molecular), and ZytoLight SPEC 1p36/1q25 Dual Color probe by Zytovision. The guidelines by the INRG biology committee were used to define SCAs. A four or more-fold increase in the MYCN signal number compared to the reference probe located on chromosome 2q was interpreted as an MYCN amplification. An unbalanced ratio of signal numbers between regions of interest versus reference was interpreted as a deletion while a four or more-fold excess of the region of interest was read as a gain.18
Treatment
An excisional biopsy of the primary tumor was performed at diagnosis if the tumor was resectable. Otherwise, an incisional biopsy was performed, and definitive surgery was deferred until after six or more cycles of chemotherapy. Chemotherapy consisted of two alternating regimens, CEDC (cisplatin, etoposide, doxorubicin, and cyclophosphamide) and ICE (ifosfamide, carboplatin, and etoposide) as described in a previous study.19 In low-risk patients, the primary treatment was surgery with (stage 2) or without (stage 1) six cycles of chemotherapy. Intermediate-risk patients received nine cycles of chemotherapy and 13-cis-retinoic acid differentiating treatment with or without adjuvant local radiotherapy, depending on whether viable residual tumor existed at the end of chemotherapy. In high-risk patients, tandem high-dose chemotherapy with autologous stem cell transplantation was routinely given as consolidation therapy following induction treatment which included nine cycles of chemotherapy and surgery.20 All high-risk patients received local radiotherapy and differentiating therapy.
Measurement of early response
Early response to chemotherapy was determined by the reduction in primary tumor volume and NSE level after three cycles of chemotherapy. The volume of the primary tumor was measured at diagnosis and after three cycles of induction chemotherapy as previously reported.21 In brief, tumor areas were defined by manual drawing on each slice of stacked computed tomography and magnetic resonance imaging. The tumor volume was calculated by summing the areas of the slice multiplied by the slice thickness using computer software (Advantage Workstation, Volume Share version 2.0; GE Healthcare, Little Chalfont, UK). Absolute tumor volume and the percentage of tumor volume after three cycles of chemotherapy compared with the tumor volume at diagnosis were calculated. Percent NSE levels after three cycles of chemotherapy compared with the NSE level at diagnosis were also calculated.
Statistics
A χ2 test was used for analyzing the difference in categorical variables, and the Mann-Whitney U test was used for comparing the difference in continuous variables. Progression-free survival (PFS) and overall survival (OS) along with standard error were estimated by the Kaplan-Meier method. PFS was calculated from the date of diagnosis until the occurrence of relapse/progression or last contact if the patient remained progression-free. OS was calculated from the date of diagnosis until death from any cause. The log-rank test was used to compare survival rates. All the covariates with P < 0.1 from univariate analysis were used for multivariate analysis. Multivariate analysis for survival was performed with the Cox proportional hazards model. P value < 0.05 was accepted as statistically significant and SPSS ver. 25.0 (IBM Corp., Armonk, NY, USA) was used for all statistical analyses.
Ethics statement
This study was approved by the Institutional Review Board (IRB) of Samsung Medical Center and the requirement for informed consent was waived (IRB 2019-07-153).
Go to :
RESULTS
Incidence of SCAs
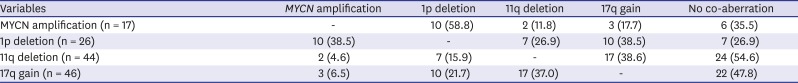
Among 212 patients diagnosed with neuroblastoma between January 2012 and December 2018, FISH results were available in 173 patients. Ninety-two (53.2%) patients had at least one of four SCAs. The numbers of patients with 17q gain, 11q deletion, 1p deletion, and MYCN amplification were 46 (27.1%), 44 (25.6%), 26 (15.2%), and 17 (9.8%), respectively. Twenty-five (14.5%) patients had two co-aberrations and eight (4.6%) had three co-aberrations. Table 1 shows the pattern of co-aberrations. Among 17 patients with MYCN amplification, 11 (64.7%) had co-aberrations, which were 1p deletion (n = 10, 58.8%), 11q deletion (n = 2, 11.8%), and 17q gain (n = 3, 17.7%) (Fig. 1A). Forty-five (67.2%) patients in the high-risk group had at least one of four SCAs, while intermediate-risk group and low-risk group had 28 (58.3%) and 19 (32.8%) patients, respectively (Fig. 1B).
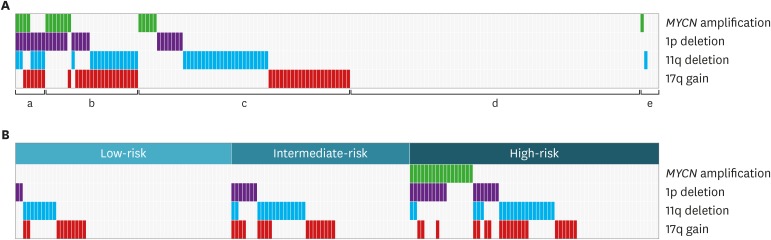 | Fig. 1Incidence of SCAs. (A) Proportion of co-aberration. (a) Three aberrations (n = 8, 4.6%), (b) two aberrations (n = 25, 14.5%), (c) one aberration (n = 7, 32.9%), (d) no aberration (n = 78, 45.1%), and (e) incomplete analysis (n = 5, 2.9%). (B) Incidence of SCAs according to risk group.SCA = segmental chromosomal aberration.
|
Table 1
Pattern of co-aberrations
![]()
Clinical characteristics according to SCAs
Table 2 shows clinical characteristics according to the presence/absence of each SCA. MYCN amplified tumors were associated with higher frequencies of abdomen tumor (94.1% vs. 69.9%, P = 0.043), poorly differentiated/undifferentiated pathology (94.1% vs. 45.8%, P < 0.001), and metastatic tumor (82.4% vs. 48.1%, P = 0.007), bigger tumor size (460 mL vs. 60 mL, P < 0.001), higher LDH level (5,193 IU/L vs. 698 IU/L, P < 0.001), higher ferritin level (323 ng/mL vs. 116 ng/mL, P = 0.006), higher NSE level (424.5 ng/mL vs. 30.8 ng/mL, P < 0.001), and lower 24-hour urine VMA level (1.7 mg/day vs. 8.7 mg/day, P = 0.009) compared to MYCN non-amplified tumors. Patients with 1p deletion had similar clinical features as those with MYCN amplification except urine VMA level. The 11q deletion was more often detected in male patients (72.7% vs. 42.2%, P < 0.001) and was associated with higher LDH level, higher NSE level, and higher 24-hour urine VMA level. A 17q gain was associated with a higher frequency of metastatic diseases and higher 24-hour urine VMA level.
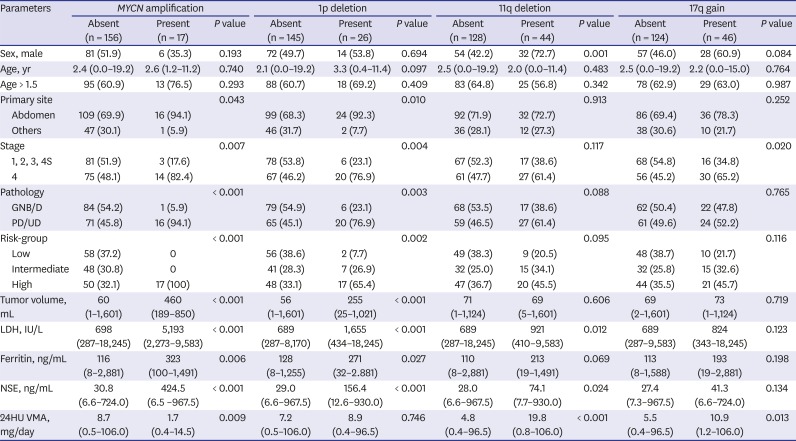
Table 2
Patient characteristics at diagnosis according to cytogenetics
Values are presented as median (range) or number (%).
GNB/D = ganglioneuroblastoma/differentiating neuroblastoma, PD/UD = poorly differentiated/undifferentiated neuroblastoma, LDH = lactic dehydrogenase, NSE = neuron-specific enolase, 24HU VMA = 24-hour urine vanillylmandelic acid.
![]()
Early response to chemotherapy
As a surrogate marker of early tumor response, residual primary tumor volume and reduction in serum NSE levels after three cycles of chemotherapy were compared according to the presence/absence of each SCA (Fig. 2). The percent residual tumor volume (12.9% vs. 42.1%, P = 0.003) and NSE level (4.8% vs. 38.9%, P < 0.001) were lower in patients with MYCN amplification than those without (Fig. 2A and B). The 1p deletion was associated with a lower NSE level (10.4% vs. 38.9%, P = 0.006); however, there was no difference in residual tumor volume (Fig. 2E and F). There was no difference in early response according to 11q deletion and 17q gain (Fig. 2I, J, M, and N).
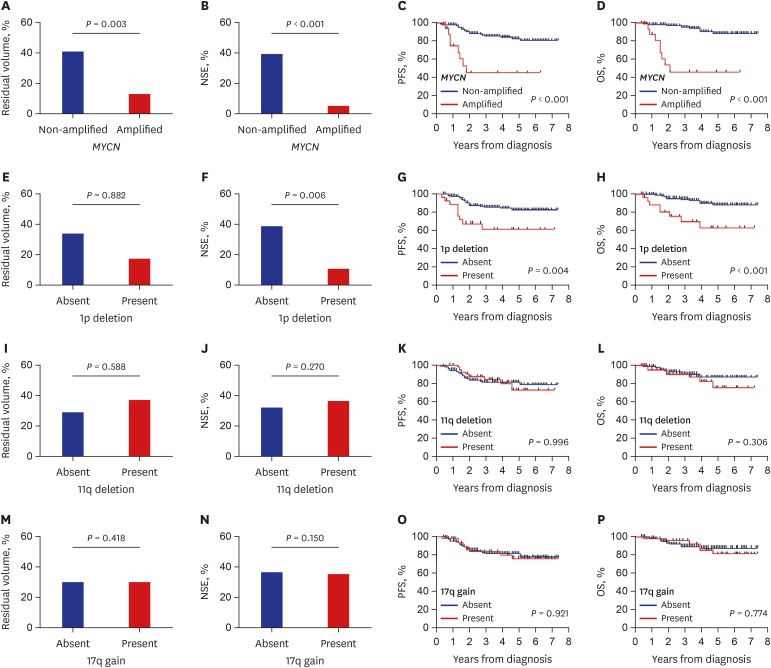 | Fig. 2Early response and final outcome in all patients. (A, B, E, F, I, J, M, and N) Reduction in tumor volume and serum NSE level after three cycles of chemotherapy compared with those at diagnosis. (C, D, G, H, K, L, O, and P) PFS and OS according to each SCA.NSE = neuron-specific enolase, SCA = segmental chromosomal aberration, PFS = progression-free survival, OS = overall survival.
|
Survival
Patients with MYCN amplification had poor survival outcome (5-year PFS: 45.2% ± 13.3% vs. 82.8% ± 3.6%, P < 0.001; 5-year OS: 46.2% ± 13.1% vs. 88.6% ± 3.4%, P < 0.001) (Fig. 2C and D). Patients with 1p deletion also had poor survival outcome (5-year PFS: 61.2% ± 10.4% vs. 82.1% ± 3.9%, P = 0.004, 5-year OS: 62.7% ± 11.0% vs. 88.1 ± 3.6%, P < 0.001) (Fig. 2G and H). However, there was no difference in survival rates according to 11q deletion or 17q gain (Fig. 2K, L, O, and P). In multivariate analysis for PFS and OS, age over 18 months (PFS: hazard ratio [HR], 4.20, P = 0.009; OS: HR, 3.84, P = 0.037), stage 4 (PFS: HR, 2.94, P = 0.035; OS: HR, 6.01, P = 0.024), and MYCN amplification (PFS: HR, 3.10, P = 0.020; OS: HR, 5.25, P = 0.003) were independent worse prognostic factors (Table 3).
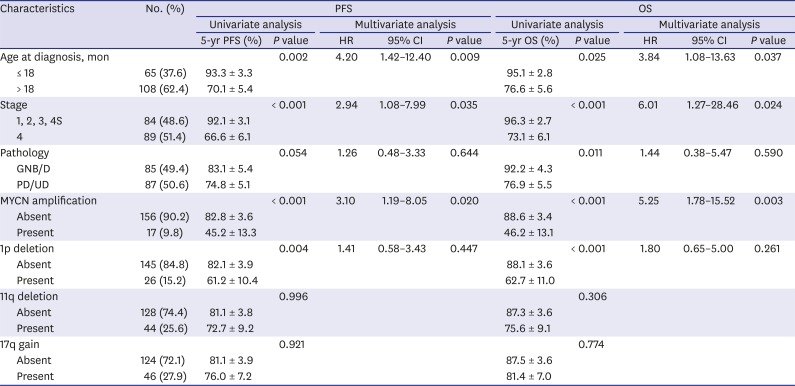
Table 3
Multivariate analysis for PFS and OS in all patients
GNB/D = ganglioneuroblastoma/differentiating neuroblastoma, PD/UD = poorly differentiated/undifferentiated neuroblastoma, PFS = progression-free survival, OS = overall survival, HR = hazard ratio, CI = confidence interval.
![]()
Analysis of patients with MYCN non-amplified tumors
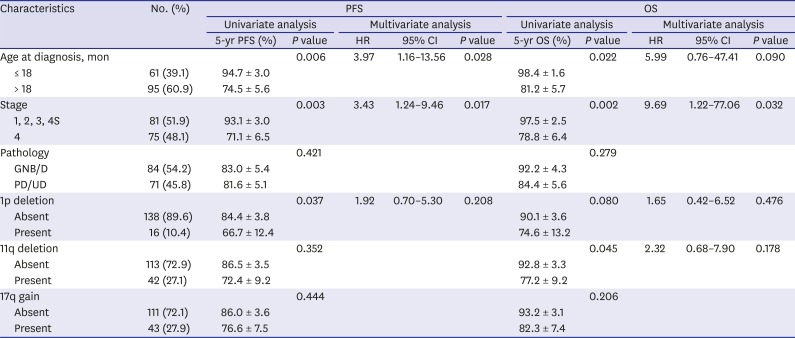
Among the four SCAs, MYCN amplification had dominant prognostic significance as shown above. However, over 90% of patients did not have MYCN amplification; thus, we evaluated the prognostic significance of the remaining three SCAs in patients with MYCN non-amplified tumors. There was no difference in the early tumor response according to the three SCAs (Fig. 3) except for a greater reduction in NSE level in patients with 17q deletion. Patients with 1p deletion showed worse survival (5-year PFS: 66.7% ± 12.4% vs. 84.4% ± 3.8%, P = 0.037; 5-year OS: 74.6% ± 13.2% vs. 90.1% ± 3.6%, P = 0.080) than those without although it was not significant in multivariate analysis (Table 4). Otherwise, there was no difference in survival according to SCAs in patients with MYCN non-amplified tumors.
 | Fig. 3Early response and final outcome in patients with non-amplified MYCN. (A, B, E, F, I, and J) Reduction in tumor volume and serum NSE level after three cycles of chemotherapy compared with those at diagnosis. (C, D, G, H, K, and L) PFS and OS according to each SCA.NSE = neuron-specific enolase, PFS = progression-free survival, OS = overall survival, SCA = segmental chromosomal aberration.
|
Table 4
Multivariate analysis for PFS and OS in MYCN non-amplified patients
GNB/D = ganglioneuroblastoma/differentiating neuroblastoma, PD/UD = poorly differentiated/undifferentiated neuroblastoma, PFS = progression-free survival, OS = overall survival, HR = hazard ratio, CI = confidence interval.
![]()
Go to :
DISCUSSION
This is the first study reporting the incidence and clinical significance of SCAs in Korean children with neuroblastoma. This is also the first study evaluating the early response to chemotherapy according to SCAs. Unlike previous reports where patients were treated with various protocols at multiple centers, patients in this study were treated with a similar treatment scheme at a single center.
The MYCN amplification has been the most studied SCA in neuroblastoma since it was first reported by Schwab in 1983.2
MYCN amplification is strongly associated with advanced stages, and its adverse prognostic significance was first reported in 1984.3 In our previous study, we reported a better early response but a worse survival outcome in patients with the MYCN amplification than in those without.6 Since MYCN is an oncogene, the tumor has aggressive features if it is amplified.4
MYCN amplification is critical in the maintenance of the pluripotent state, which is associated with activated proliferation and apoptosis. Therefore, it is known to contribute to metastasis from the primary site and also explains why MYCN amplified tumors have a better early response to chemotherapy than non-amplified tumors. However, if MYCN amplified tumors progress or relapse, mutations in p53 or the p53 pathway may be present, resulting in therapy resistance. Eventually, MYCN amplified tumor have a worse outcome.22
The incidence of each SCA in previous studies varied by a wide range and various analyzing methods were used to detect SCAs. The techniques recommended by INRG to detect SCAs are FISH, polymerase chain reaction, array-based methods, and multiplex ligation-dependent probe amplification.18 FISH was commonly used but other techniques were also used in previous reports from different study groups.79101112131423 We used the FISH method and followed the INRG recommendation in the interpretation of SCAs. The incidence of MYCN amplification in this study seems to be lower than in previous reports by different groups using various detection methods (Table 5). Gehring et al.9 considered the methods used to detect the SCAs as one of the reasons for this difference. Another possible reason for this difference might be ethnicity. While previous reports included various ethnic groups, our study only included Korean patients. Further research is needed to elucidate the reason for the difference in the incidence of MYCN amplification according to study groups.
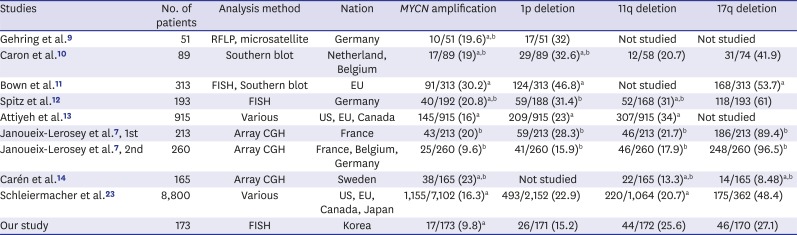
Table 5
Incidence of segmental chromosome aberrations
| Studies | No. of patients | Analysis method | Nation | MYCN amplification | 1p deletion | 11q deletion | 17q deletion |
|---|---|---|---|---|---|---|---|
| Gehring et al.9 | 51 | RFLP, microsatellite | Germany | 10/51 (19.6)a,b | 17/51 (32) | Not studied | Not studied |
| Caron et al.10 | 89 | Southern blot | Netherland, Belgium | 17/89 (19)a,b | 29/89 (32.6)a,b | 12/58 (20.7) | 31/74 (41.9) |
| Bown et al.11 | 313 | FISH, Southern blot | EU | 91/313 (30.2)a | 124/313 (46.8)a | Not studied | 168/313 (53.7)a |
| Spitz et al.12 | 193 | FISH | Germany | 40/192 (20.8)a,b | 59/188 (31.4)b | 52/168 (31)a,b | 118/193 (61) |
| Attiyeh et al.13 | 915 | Various | US, EU, Canada | 145/915 (16)a | 209/915 (23)a | 307/915 (34)a | Not studied |
| Janoueix-Lerosey et al.7, 1st | 213 | Array CGH | France | 43/213 (20)b | 59/213 (28.3)b | 46/213 (21.7)b | 186/213 (89.4)b |
| Janoueix-Lerosey et al.7, 2nd | 260 | Array CGH | France, Belgium, Germany | 25/260 (9.6)b | 41/260 (15.9)b | 46/260 (17.9)b | 248/260 (96.5)b |
| Carén et al.14 | 165 | Array CGH | Sweden | 38/165 (23)a,b | Not studied | 22/165 (13.3)a,b | 14/165 (8.48)a,b |
| Schleiermacher et al.23 | 8,800 | Various | US, EU, Canada, Japan | 1,155/7,102 (16.3)a | 493/2,152 (22.9) | 220/1,064 (20.7)a | 175/362 (48.4) |
| Our study | 173 | FISH | Korea | 17/173 (9.8)a | 26/171 (15.2) | 44/172 (25.6) | 46/170 (27.1) |
Corresponding patients number/studied patients number (%).
RFLP = restriction fragment length polymorphism, FISH = fluorescence in situ hybridization, CGH = comparative genomic hybridization.
aAdverse effect; bPercentage was calculated from reported patient numb.
![]()
After MYCN amplification has been reported as a significant poor prognostic marker in neuroblastoma, other SCAs have been studied for clinical significance. There have been controversies associated with the prognostic significance of SCAs other than the MYCN amplification. Some studies have reported the 1p deletion, 11q deletion, and 17q gain as worse prognostic factors101324 whereas in other studies they were not reliable prognostic markers.912 At present, the reason for this difference is unclear.
In the present study, 1p deletion was associated with unfavorable clinical characteristics and worse outcome in the univariate analysis. However, more than half of the patients with 1p deletion also had MYCN amplification, and 1p deletion was not an independent worse prognostic factor in multivariate analysis. Even when the analysis was confined only to patients with MYCN non-amplified tumors, the 1p deletion was not an independent prognostic factor in multivariate analysis.
Neither 11q deletion nor 17q gain was a significant risk factor for survival in this study. In the INRG risk stratification, the 17q gain was excluded from analysis because data were only available for less than 5% of the patients and the 1p deletion was not a significant factor for OS. Therefore, only the 11q deletion was additionally included in the INRG risk stratification.15 However, we could not find any prognostic significance associated with the 11q deletion and this is consistent with previously reported study with limited number of patients.10 Patients with SCAs other than MYCN amplification was not included in high risk group, but if the patients were not high-risk, the chemotherapy for such patients were varied upon the studies. These are likely to cause a difference in survival outcomes. Here again, further studies with larger cohorts of patients are needed.
In conclusion, this is the first study reporting the incidence and clinical significance of SCAs in Korean children who were treated with essentially the same treatment protocol at a single center. Although both the MYCN amplification and 1p deletion were associated with aggressive clinical features at diagnosis and faster early response but worse survival, MYCN amplification was the only SCA with independent prognostic significance. A further study in a larger cohort of patients with longer follow-up is needed to evaluate whether there are differences in the incidence and clinical significance of SCAs according to ethnic group.
Go to :
 XML Download