

 PDF
PDF Citation
 Print
Print


The novel coronavirus disease 2019 (COVID-19), which originated in Wuhan, China, became a global pandemic very quickly.1 The unexpected spread of COVID-19 was due to the pre-symptomatic phase, which led to increased transmission rates and shorter serial intervals than other viruses.2 Therefore, many studies have attempted to estimate the intervals of transmission3456789 and the results ranged from 3.7 to 7.5 days. However, the estimations in previous studies include some limitations. First of all, most studies used confirmed date instead of symptom onset date. Calculating only serial intervals by confirmed date instead of the date of symptom onset cannot reflect the activity of viruses concisely since the confirm date could be strongly associated with the capacity of test or epidemiologic investigations. Second, studies mostly did not include causal contacts as considerations, which is crucial to reveal actual infection chains of the disease. Also, because not every investigation provides the infector as the index case, researchers should arrange the relationship of the infector and the infectee through their symptom onset and contact date, but this procedure is neglected. The purpose of this study was to estimate the mean serial interval for COVID-19 using data from the Korean COVID-19 contact tracing system.10
Baseline demographic characteristics and epidemiological features of matched pairs of COVID-19 patients were derived from the COVID-19 reporting and contact tracing system run by the Korea Centers for Disease Control and Prevention (KCDC). We investigated all confirmed cases in Korea from January 20 to August 3, 2020 (COVID-19 National Emergency Response Center, Korea, 2020). Confirmed cases were defined by a real-time reverse transcriptase-polymerase chain reaction (RT-PCR) test. Symptoms include respiratory or systemic ones such as fever, myalgia, headache, cough, sore throat, and shortness of breath.
The serial interval is defined as the time interval between the onset dates of symptom(s) in the infector and the infectee. The baseline characteristics and the mean serial intervals were estimated. Mean serial intervals by symptom onset in infectors were also reported. The estimated mean values were reported as a total and then reported with only the specific church cluster in Daegu and without it, since the contact relationships may be inaccurate in this region because of the massive transmission. The different serial intervals of the various groups were evaluated statistically with t-tests or analysis of variance tests. All data management or analyses were performed in R-3.5.3 (R Foundation for Statistical Computing, Vienna, Austria).
Among the initial matched pairs, infectees with duplicate infectors or asymptomatic infectors or infectees with unconfirmed serial intervals were excluded (232 pairs) for the analysis. As a result, 1,567 symptomatic pairs were used in the calculation, including 969 infectors and 1,567 infectees. The mean ages of the infectors and the infectees were 49.43 (standard deviation [SD], 17.98) and 47.37 (SD, 20.04) years, respectively. The proportion of women to men favoured women in both groups, at 55.11% and 52.71%.
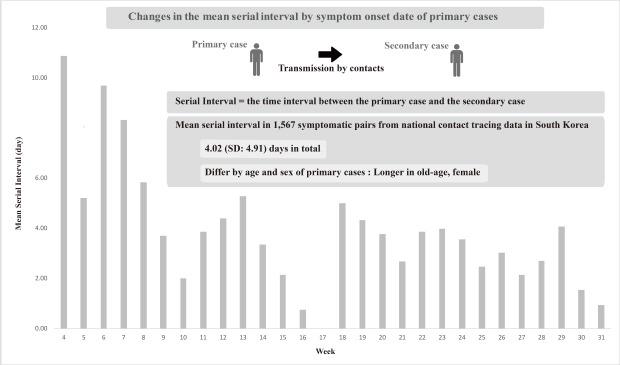
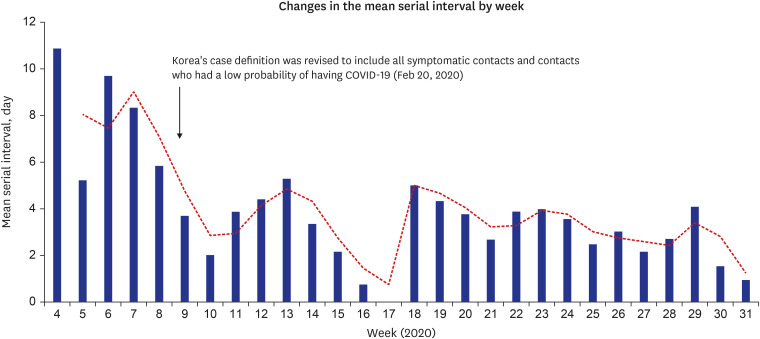
The mean serial interval of the total population was 4.02 (SD, 4.91) days. The median of the serial interval was 3 days. Of total, 12.7% (199 pairs) of serial intervals were negative. Fig. 1 shows the trend of serial intervals based on the onset date of the infectors. With time, a later onset of symptoms seems to have shorter serial intervals. The mean serial interval became stable after February 20, when Korea's case definition was revised. Since before February 20, only imported cases and their clear contactors were suggested to have RT PCR test, community level transmission could have been lost. After February 20, the case definition started to cover all symptomatic contactors or patients for whom the probability of having COVID-19 is doubted by a doctor. The mean serial interval of the first phase (Phase 1) was 6.12 (SD, 5.74) days, and that of the next phase (Phase 2) was 3.93 (SD, 4.86) days.
The mean serial intervals and standard deviations were estimated in two phases by groups (Table 1). In total, the mean serial intervals for men were significantly shorter than those for women, 3.34 (SD, 4.47) and 4.37 (SD, 5.08) days, respectively, in Phase 2. Infectors' age groups showed a significant difference in the mean serial interval in Phase 2, which showed increasing values with higher age groups.
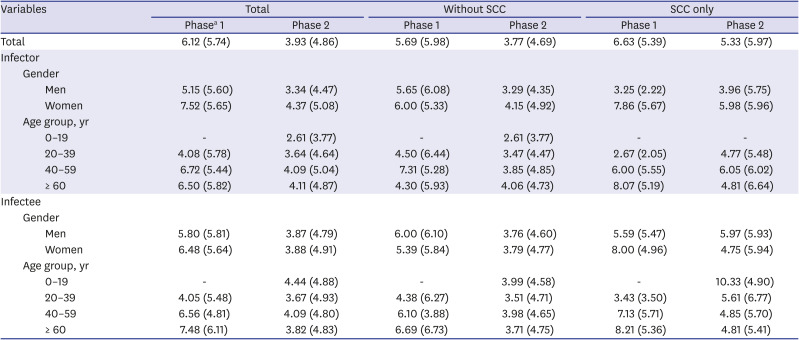
Table 1
Mean serial interval of population by groups
Values are presented as number (%).
SCC = specific church cluster in Daegu, Korea, COVID-19 = coronavirus disease 2019.
aPhase was divided by the date when major changes in case definitions of COVID-19 were established in Republic of Korea. Phase 1: from January 10th to February 20th, 2020. Phase 2: from February 20th to March 25th, 2020.
![]()
The present study explored the mean serial interval of COVID-19, including all symptomatic pairs after the index import case on the national level. Along with this wide coverage, we reviewed contact dates and causes of disease in pairs, attempted to find out the sequential relationship between pairs, and finally used the selected infector-infectee pairs who showed clear relationships. Although 12.7% of serial intervals showed negative values, this figure could be reasonable considering the possibility of pre-symptomatic transmission.3 The mean serial intervals were reported rather than median values for comparability with other studies or considering pre-symptomatic transmissions.
It is not possible to directly correlate the causal relationship between the revision of the case definition on February 20 and the decrease of serial intervals. The number of newly confirmed cases, the capacity of epidemiological investigations, and the effects of other location tracking systems might have a compound effect on the reduction of the mean serial interval. However, it is clear that variation of the mean serial interval was minimized after the revision of case definition, indicating the possibility of the revision as being one of the causes.
Longer serial intervals in women or old age group should be interpreted with concern. Demographical factors may have affected the serial interval by its nature or sociologic difference in behaviors or gathering patterns. Until now, there are lack of studies revealing the difference between sex or age in transmission pattern. Also, because the data were derived from the ongoing pandemic situation, it has potential to be changed, further follow-up studies are needed. Because determining the serial interval of COVID-19 is critical for controlling the pandemic, more contact relationships should be investigated and analyzed.
 XML Download