

 PDF
PDF Citation
 Print
Print


INTRODUCTION
Sleep apnea (SA) is one of the most common sleep disorders, characterized by the presence of repeated apneas and hypopneas. SA is a respiratory event annotated by a complete cessation of airflow (i.e., decreasing amplitude of at least 90%) for at least 10 seconds and continued respiratory effort. A hypopnea is similar to an SA, although the decrease in airflow amplitude is 30%–90% during sleep.1
Healthy and adequate sleep is essential for people of all ages, because sleep is a basic human physiological need that occupies one-third of a person's life. During sleep, the brain organizes learned contents, eliminates toxins, and the body recharges itself.2 Therefore, the quality and quantity of sleep are very important for maintaining good health. However, SA causes oxygen deficiency and disrupts the normal structure of the sleep.3 It is regarded as the main factor influencing sleep fragmentation and sleep efficiency. Furthermore, SA can lead to a variety of illnesses, including fatigue,4 headache,5 cardiovascular disease,6 and decreases in cognitive function7 and immunity.8 Accurate and advance prediction of SA is necessary for people with diagnosed or undiagnosed sleep-related breathing disorders.910
Nocturnal laboratory-based polysomnography (PSG) is commonly used as a tool to diagnose sleep disorders and to prescribe sleep medication. PSG is a multi-signal recorded measurement of the brain, cardiopulmonary, and muscle activity via electroencephalography (EEG), electrooculography (EOG), electrocardiography (ECG), respiratory, pulse oximetry (SpO2), and electromyography (EMG). PSG can provide an objective assessment of sleep disorders, including details on airflow, respiratory effort, and oximetry, and can be used to predict SA.11 However, PSG is not user-friendly; inconvenience arises from the number of sensors required for multichannel recordings. PSG is also costly and requires trained attendants. Furthermore, manual interpretation of PSG recordings is cumbersome and labor-intensive, requiring licensed technicians.
ECG has been used as an alternative physiological signal source for detecting or classifying SA events since the early 2000s.12 SA directly affects ECG through the response of the sympathetic nervous system during sleep. Because of sleep apnea there are some ECG morphology differences including very small variations in amplitude of the R peaks and baseline fluctuation due to respiration, and inter-beat interval decreasing.13 In addition, ECG is relatively easy to measure and can provide vital signs including heartbeat, beat-to-beat intervals, QRS complex, and ECG-derived respiration. Therefore, ECG, especially the single-lead signal, has been used in many studies for automatically detecting, classifying, and screening SA events based on machine learning techniques.
To date, studies have focused on finding and extracting the most informative features from the ECG signal to achieve better performance. For instance, Mendez et al.1415 have proposed a method based on nonlinear and frequency domain analyses for SA screening. They extracted 20 features and applied 10 of them to four different classifiers. Chen et al.16 proposed a systematic route of the conventional signal processing algorithm for the automatic screening of SA events. This method requires only beat-to-beat intervals derived from the ECG signals of suspected SA patients. In addition, these studies not only analyzed and extracted features from normal ECG but apneic ECG signals also. These methods require the applied ECG signal to be only recorded at night. Additionally, the RR interval and heart rate variability (HRV) are derived from the raw ECG signal for at least 5 minutes.
The convolutional neural network (CNN) is one of the most common neural networks derived from the cognitive model of human vision.17 Recently, the CNN has drawn extensive interest because of its demonstrated efficiency as a detector and classifier in the fields of image recognition,18 computer vision,19 and biomedicine.20 Several studies on the detection of SA events or the classification of apnea and hypopnea events have been conducted using the CNN model from a single-lead ECG. For instance, Dey et al.21 demonstrated a deep learning framework for SA detection based on the CNN algorithm using a single-lead ECG signal. In our previous study, we designed a CNN model to classify multiclass SA events such as apnea and hypopnea from a single-lead ECG.22 In these studies, the apneic segment or abnormal segments of the ECG signal were used for the automatic detection and classification of SA.
In this paper, we propose a novel method of automatically identifying SA severity based on a short-term normal ECG signal using a deep learning model. To this end, a CNN model with a deep structure was designed for identifying the severity of SA using the short-term normal ECG. Because of its automatic, high-dimension feature extraction, a deep CNN was selected as the automatic identifier for SA severity from a short-term normal ECG signal. Finally, we trained and evaluated the designed CNN model by using the diagnostic nocturnal PSG dataset containing the training and test sets.
Go to : 
METHODS
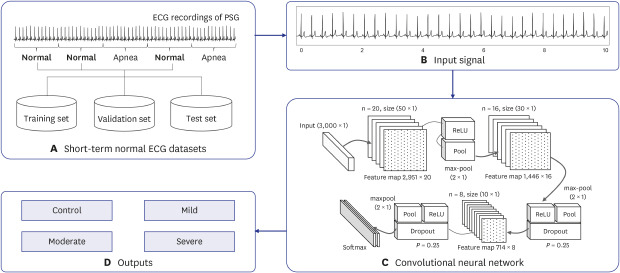
The proposed methodology is composed of four main parts: the short-term normal ECG datasets, input signal, deep learning model, and outputs (Fig. 1). A detailed description of each part is presented in subsequent sections.
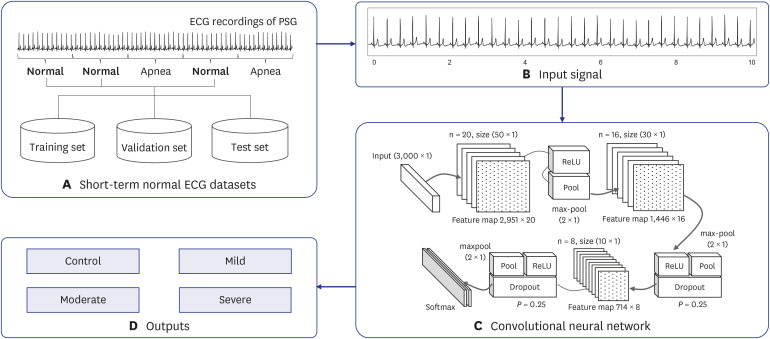 | Fig. 1Proposed method for SA severity identification based on deep learning using a short-term normal ECG. It consists of four main parts: (A) short-term normal ECG datasets, (B) input signal, (C) deep learning model, and (D) outputs.SA = sleep apnea, ECG = electroencephalography, PSG = polysomnography, ReLU = rectified linear unit.
|
Study population
A total of 144 subjects enrolled in the study: fifty-two in a normal group (male: 25, female: 27) and ninety-two in the OSA group (mild: 22, moderate: 38, and severe: 32) (Table 1). All subjects underwent an overnight PSG using a polysomnographic amplifier (Embla N7000; Natus, Kópavogur, Iceland). The test involved EEG, EOG, EMG, ECG, SpO2, chest and abdomen respiration, nasal pressure, airflow, and snoring recordings. The average recording time was 7.2 hours, and mean sleep time was 5.7 hours.
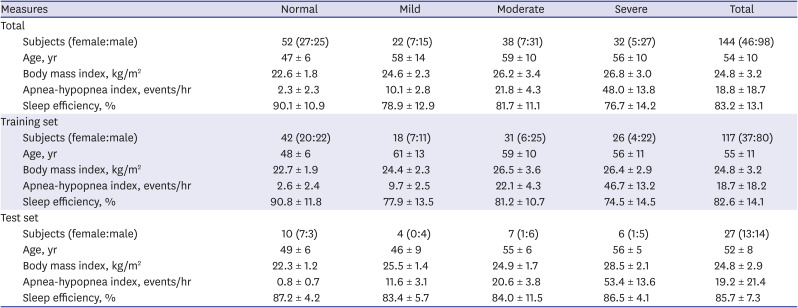
Table 1
Participants' information in detail
![]()
The apnea-hypopnea index (AHI) is compiled based on the averaged frequency of apnea and hypopnea per hour of sleep. In accordance with the criteria proposed by the American Academy of Sleep Medicine (AASM),23 all sleep events from the PSG recordings were manually annotated by licensed and experienced technicians.
Data processing and ECG dataset
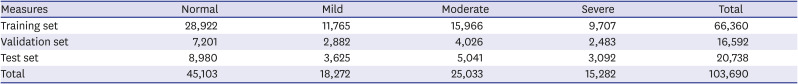
The short-term normal ECG datasets (Table 2) were extracted from the study population presented in Table 1. All participants were randomly divided into two subject groups for the training and test sets. A total of 103,690 segments for the short-term normal ECG dataset of 144 participants was obtained to train and evaluate the proposed method. The training set consisted of 82,952 segments (66,360 training set, 16,592 validation set) from 117 subjects, while the test set had 20,738 segments from 27 subjects (Fig. 1A).
The short-term normal ECG segment was used as the input data. The ECG signal was divided into 30 seconds segments, and the corresponding annotations of the sleep apnea episodes were stored together (Fig. 1B). Because the single-lead ECG signal was recorded at a sampling rate of 200 Hz, each segment consisted of 6,000 samples per segment.
Deep learning model
The CNN is a type of deep learning technique that can extract high-dimensional features from various types of datasets; it demonstrates excellent performance in both learning and testing stages.24 The basic structure of the CNN is a convolutional layer, a pooling layer, and a fully-connected layer. The convolution layer is used for extracting various feature maps from the input signal. The pooling layer performs the logical functions to increase the discriminative power of features and reduce the data dimensions. Finally, the fully-connected layer is the stage at which the CNN completes the learning process, and the final discrimination of the input data is determined. It has a structure in which all the neurons of the neural network are completely connected.17 This layer discriminates among the data based on the probability values obtained through the softmax function. The designed deep CNN model for the automatic identification of SA severity from a short-term normal ECG was represented in Fig. 1C.
Model optimization
The optimization of the model was performed using trial and error, as shown in Table 3. To optimize the model, various techniques, including rectified linear unit (ReLU), dropout, and batch normalization, were used. Batch normalization was used to the normalization of input data for model optimization at the initial stage of the model.25 The dropout was used with P = 0.25 immediately after each max-pooling layer to reduce overfitting and divergence.26 ReLU performed the activation function for the designed deep CNN model, and thereby robustly improved prediction performance.27 Finally, the performance comparison between the models was based on a model constructed with repeated learning of batch sizes of 64 and 256 epochs.28 Using the results of the experiments, we identified the optimum structure of the designed deep CNN model for the automatic identification of SA severity from a short-term normal ECG, as shown in Table 3.
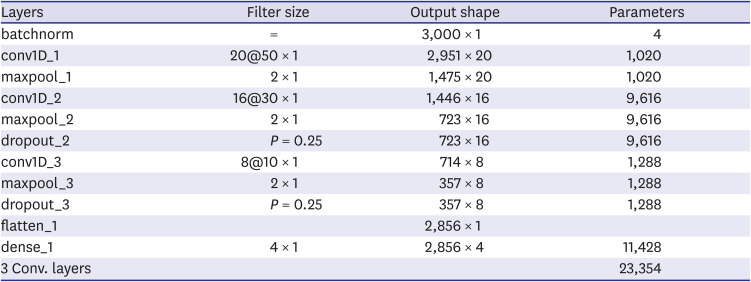
Table 3
Structure of the designed deep CNN model
![]()
Implementation
In this study, PSG recordings were preprocessed using MATLAB (Mathworks, Natick, MA, USA). The designed CNN model was implemented by Keras29 with background TensorFlow.30 In addition, the designed deep CNN model was trained and evaluated using hardware with a graphics processing unit, GeForce GTX 1080 (8 GB, GDDR5X).
Data analysis
The F-measure was used to evaluate the proposed automatic identification model for SA severity. It evaluates the correct classification of classes according to class equality. To calculate the F-measure, two evaluation measures are combined, such as precision and recall. These are defined as follows: Precision = TP/(TP + FP); Recall = TP/(TP + FN), where TP denotes the true positives, FP denotes the false positives, and FN denotes the false negatives. They represent the number of each events.
The F-measure can present the F1-score; it is better known for appropriating the unbalanced dataset. It can be computed based on the sample proportion of precision and recall as follows:
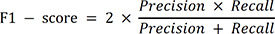
The balanced accuracy was used to the comparison with similar previous studies, and it was represented as the balanced value of the accuracy of the training and test phases.
Ethics statement
The protocol of PSG study was carried out at the sleep clinic of the Samsung Medical Center, Korea, having obtained permission from the Center's Institutional Review Board (approval No. 2012-01-063). Informed consent was submitted by all subjects when they were enrolled.
Go to :
RESULTS
The results of the designed deep CNN for the automatic identification of SA severity from a short-term normal ECG are presented in Table 4. The performance was evaluated using measuring indexes such as precision, recall, F1-score and balanced accuracy. We obtained very high performances, with an accuracy of 99% for all subject groups in the training set, validation set, and test set. Furthermore, the F1-score was greater than 99% not only for the training set but also for the validation set and test set for all groups.
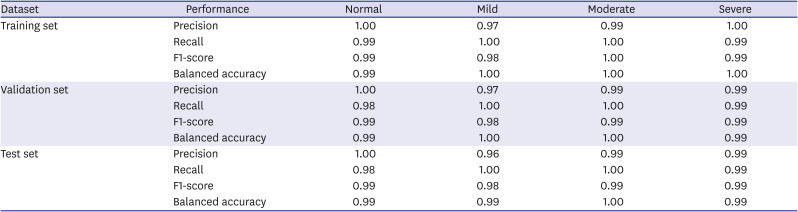
Table 4
Results of the designed deep CNN model for SA severity identification
![]()
The confusion matrix of the performance of the proposed method for the automatic identification of SA severity is shown in Fig. 2. All datasets consisted of the equally distributed SA severity events as shown in confusion matrix. In addition, the results of the designed deep CNN model showed very high performances with accuracy of 0.99% for all SA severity groups such as normal, mild, moderate, and severe in all datasets. The accuracy curve of the learning and evaluation phase to demonstrate the over and underfitting of the designed deep CNN model was presented in Fig. 3A. There is no overfitting in the designed deep CNN model and we can see that it was well learned and optimized after 50 epochs. Lastly, the receiver operating characteristic (ROC) curve and area under the curve (AUC) values for each SA severity groups in the training set, validation set and test set are presented in Fig. 3B-D. We obtained a very high performance of the ROC curve and AUCs more than 99% for all SA severity groups.
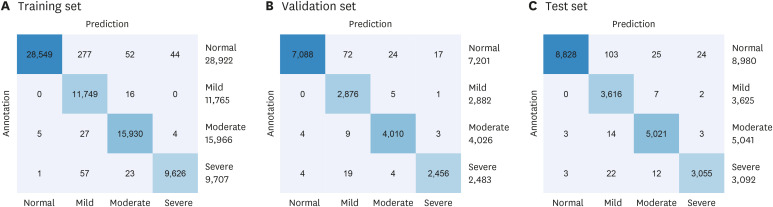 | Fig. 2Confusion matrix of the proposed method for SA severity identification based on deep learning using a short-term normal ECG signal. Confusion matrix for (A) the training set, (B) validation set, and (C) test set.SA = sleep apnea, ECG = electroencephalography.
|
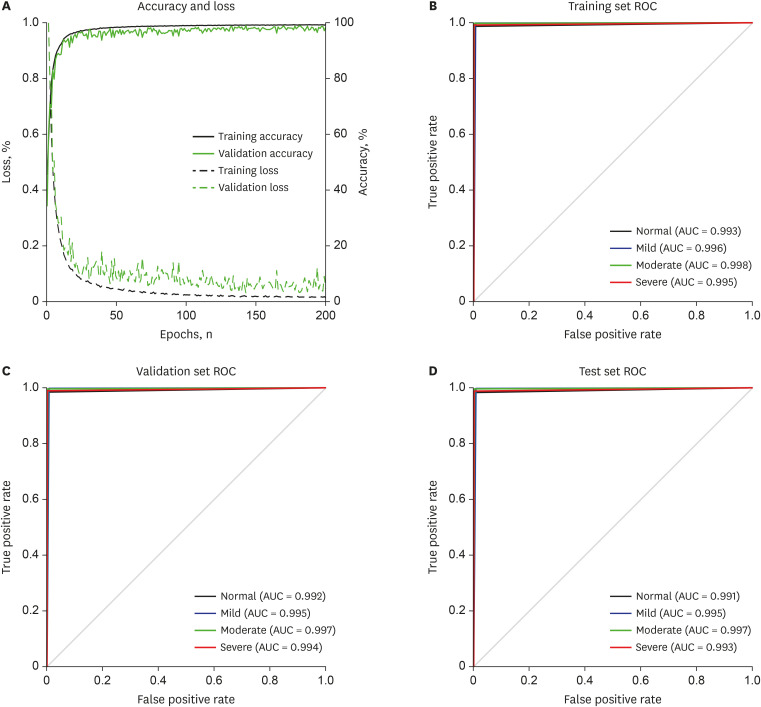 | Fig. 3Accuracy and ROC curve of the proposed method for SA severity identification based on deep learning using a short-term normal ECG signal. (A) Accuracy and loss, (B) training set ROC, (C) validation set ROC, and (D) test set ROC.ROC = receiver operating characteristic, SA = sleep apnea, ECG = electrocardiography, AUC = area under the curve.
|
Go to :
DISCUSSION
This study demonstrated a novel method for automatically identifying SA severity from a short-term normal ECG based on a CNN model. A designed deep CNN model was used as an identifier for estimating the severity of SA using short-term normal ECG. We achieved a very high prediction rate, with a mean accuracy of 96.0% for all subject groups. In addition, the method accurately predicted the normal and severe groups with an F1-score of 99.0%. Lastly, the performance values are almost equal in the training set and test set, demonstrating that the designed deep CNN model was well trained and optimized. The ability to identify undetected SA with an easy, widely available point-of-care test using a short-term normal ECG has important practical implications, particularly for the diagnosis of patients with SA. This may be regarded as one of the most important outcomes of this study.
From an engineering perspective, there are many studies on SA screening based on ECG signals. Among them, Mendez et al.14 conducted OSA screening based on autoregressive models using a single-lead ECG signal. The QRS complexes and RR intervals were calculated from the ECG, and these intermediate vital signs were analyzed in the time and frequency domains to extract 72 features. The top 10 features were selected based on sequential forward selection and applied to the k-nearest neighbor (KNN) and neural network (NN) classifiers. They achieved good results, with an accuracy of 88% for KNN and NN. Furthermore, Mendez et al.15 proposed a method for SA screening from ECG based on nonlinear and spectral analyses. They extracted 20 features using canonical machine learning and applied the top 10 features to the linear and quadratic discriminant classifiers. Recently, Chen et al.16 suggested a novel approach for automatically screening for SA based on conventional signal processing. They used only beat-to-beat intervals derived from ECG signals and analyzed the spectral domain to extract features. They also used the support vector machine as a classifier for suspected SA patients by using extracted spectral domain features. With an accuracy of 92.8%, their method outperformed that of previous studies.1415 In these studies (Table 5), the ECG signal was used to extract physiological parameters, including beat-to-beat intervals and QRS complexes. Further, a number of features were extracted using various signal processing methods including discrete wavelet analysis (DWA) and empirical mode decomposition (EMD). Thus, previous studies used manually extracted or hand-crafted features from intermediate vital signs, such as the beat-to-beat intervals and QRS complex. In addition, features were extracted from both normal and apneic ECG signals. Finally, ECG segments were analyzed for at least 5 minutes because of HRVs. In this study, no feature extraction or feature selection process was required. Using our methodology, only 30 seconds short-term normal ECG is necessary to identify SA severity. Therefore, the proposed method can be applied to undiagnosed subjects to predict and screen the severity of SA in advance.
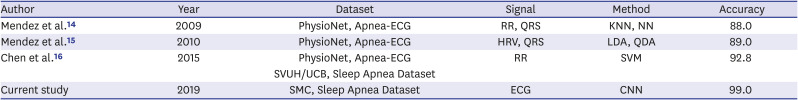
Table 5
Comparison of the current study with previous studies
| Author | Year | Dataset | Signal | Method | Accuracy |
|---|---|---|---|---|---|
| Mendez et al.14 | 2009 | PhysioNet, Apnea-ECG | RR, QRS | KNN, NN | 88.0 |
| Mendez et al.15 | 2010 | PhysioNet, Apnea-ECG | HRV, QRS | LDA, QDA | 89.0 |
| Chen et al.16 | 2015 | PhysioNet, Apnea-ECG | RR | SVM | 92.8 |
| SVUH/UCB, Sleep Apnea Dataset | |||||
| Current study | 2019 | SMC, Sleep Apnea Dataset | ECG | CNN | 99.0 |
ECG = electrocardiography, KNN = k-nearest neighbor, NN = neural network, HRV = heart rate variability, LDA = linear discriminant analysis, QDA = quadratic discriminant analysis, SVUH = St. Vincent's University Hospital, UCB = University College of Dublin, SVM = support vector machines, SMC = Samsung Medical Center, CNN = convolutional neural network.
![]()
In this study, the deep CNN model was used as an automatic predictor that contained a feature map extractor and classifier throughout the layers. We have illustrated the entire working process of the deep CNN model from input to output for each subject group (Fig. 4). From this, we can deduce the difference between outputs, not only in each layer but also within the subject groups. We can see that it was difficult to find the difference between the groups of subjects in the output of the second convolution layer (conv1D_2). However, the difference between the morphology and amplitude of the output signals of the conv1D_3 layer was demonstrated. Furthermore, it can be expected that the output signal does not reflect a number of features or morphology differences. Some outputs of the conv1D_3 layer have similar morphology with the output of EMD and DWA for the ECG signal in previous studies.18 From this, we can infer that deep learning methods, including the CNN model, do not only cover conventional features but also contain novel feature maps. Their reliable and superior performances in comparison to conventional methods may be attributed to this.
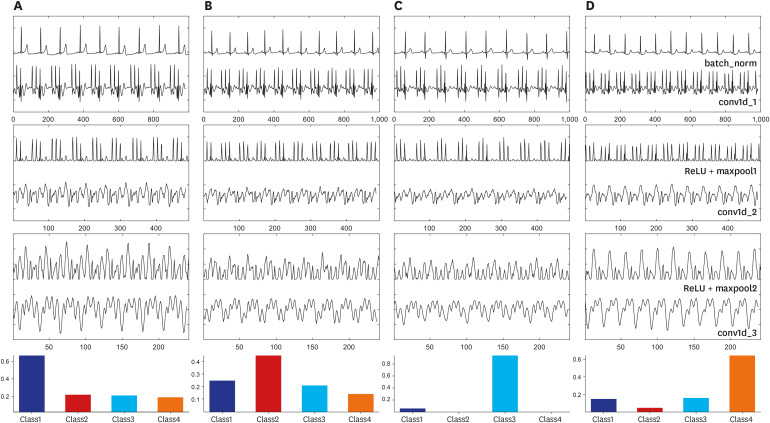 | Fig. 4Example of the output of the designed CNN model for the automatic prediction of SA using normal sinus rhythm. Intermediate features of (A) normal, (B) mild, (C) moderate, and (D) severe cases. (batch_norm–output signal of the batch-normalization layer; conv1d_1–output of first convolutional layer; ReLU+maxpool1–output of ReLU activation and max-pooling layers; conv1d_2–output of second convolutional layer; ReLU+maxpool2–output of second ReLU activation and max-pooling layers; and conv1d_3–output of last convolutional layer). The bottom bar graph is the final probability value after discrimination has occurred in the fully connected layer (class1– normal group; class2– mild group; class3– moderate group; and class4– severe group).CNN = convolutional neural network, SA = sleep apnea, ReLU = rectified linear unit.
|
The deep learning framework based on the CNN model has been used in several studies to detect SA using a single-lead ECG. In those studies, the proposed CNN models performed binary or multiclass classification for OSA events based on the ECG signal. Dey et al.21 conducted the binary classification of SA using ECG signal from only mild group subjects. In contrast, our previous study performed the multiclass classification of SA events including apnea and hypopnea based on a CNN model using a single-lead ECG signal from diverse patient groups.22 However, it neither covered the prediction of SA cases nor detected the severity of OSA. In this study, we were able to predict the severity of OSA using a 30-second normal ECG signal.
The study has the following limitations. First, we did not use the external validation set of other institutions, therefore it can be lead to overfitting of the designed deep CNN model. It is, therefore, necessary to conduct a further validation study of this method using another clinical dataset such as PhysioNet, Apnea-ECG Dataset. A more diverse and larger population should be used to reduce the overfitting problem in the following study. Second, we used a short-term normal ECG from the recording of nocturnal PSG. The proposed method could underestimate when the short-term normal ECG that was measured during daytime was applied. Third, we excluded the subjects with any cardiovascular diseases and central or mixed sleep apnea. The proposed method could therefore show lower performance for the excluded groups. Finally, we cannot calculate the AHI from a short-term normal ECG signal. Currently, we can only classify SA into normal, mild, moderate, or severe based on the short-term (30 seconds) normal ECG signal.
In conclusion, we demonstrated a novel method for automatically identifying SA severity based on the deep learning model from a short-term normal ECG signal. Our suggested method achieved robust performances with a balanced accuracy of 99.0% for normal, mild, moderate, and severe groups. The results demonstrate the possibility of reliable sleep screening and monitoring using the short-term normal ECG signal without any feature extraction and preprocessing. Thus, the method we propose is a potentially helpful approach for sleep studies.
Go to :
 XML Download