

 PDF
PDF Citation
 Print
Print


INTRODUCTION
Hypertension is a major risk factor for cardiovascular (CV) disease.1 The global prevalence of hypertension was estimated to be 1.13 billion in 2015.2 The prevalence of hypertension increases with age, and people over 60 years of age account for more than 60% of the overall prevalence.3 This suggests that the global contribution of hypertension to mortality and morbidity will increase in an aging society.4
Hypertension is rarely seen alone and often accompanies other CV risk factors such as diabetes of dyslipidemia.5 Current practice guidelines recommended by the American College of Cardiology/American Heart Association task force considered such comorbid factors to predict CV risk in a 10-year atherosclerotic CV disease risk calculation system.6 However, according to a number of studies, CV risk is further increased when hypertension-mediated organ damage (HMOD) is present.78910 The HMOD refers to structural and functional changes in arteries or end organs such as heart, brain, eyes, kidneys, and blood vessels and is a marker of pre-clinical or asymptomatic CV disease.11 Based on this evidence, recent European Society of Cardiology hypertension guidelines recommended that all hypertensive patients undergo basic screening for HMOD, and more detailed assessment is needed when the presence of HMOD might influence treatment decisions.12 The European group also suggested CV risk assessment systems, but the formulas are very complicated and require numerous tests for calculation.13
In addition to metabolic factors, ethnic factors are also important for CV risk prediction in hypertensive patients. However, there are limitations to estimate the CV risk in Asian patients using current guidelines.612 Therefore, this study aimed to investigate incidence of HMOD in East Asian hypertensive patients and to evaluate the associations of mortality and CV events with HMOD. In addition, we sought to identify the independent predictors related to mortality among the components of HMOD, and we tried to determine the most important diagnostic marker for mortality and CV event prevention in hypertensive patients.
METHODS
Study population
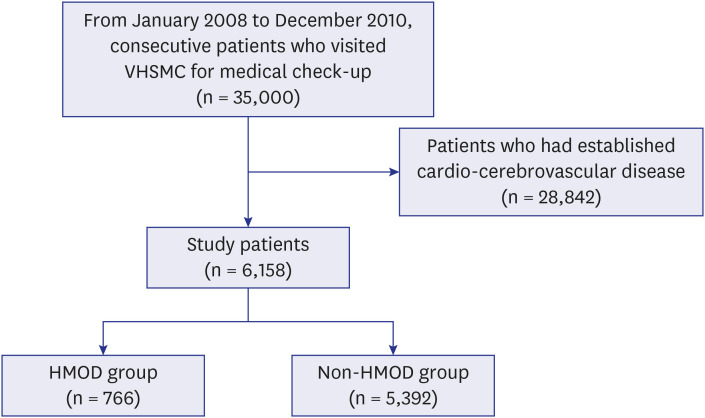
We reviewed the medical records of 35,000 hypertensive Vietnamese War veterans who visited our hospital consecutively from January 2008 to December 2010 to assess the toxicity with grading of damage from defoliants used during the Vietnam War (Fig. 1). Of these, 6,158 patients with no established CV disease were finally enrolled as the study population. Based on the presence of HMOD at enrollment, the patients were divided into the two groups: HMOD group (n = 766) and non-HMOD group (n = 5,392). Baseline characteristics and clinical outcome data were collected retrospectively by research coordinators of the dedicated registry.
Outcomes and definition
HMOD was defined as the presence of either proteinuria, hypertensive retinopathy, or left ventricular hypertrophy (LVH). Proteinuria was assessed with dipstick or quantitative test. Mid-stream urine samples were collected from each patient after fasting for > 12 hours. A score greater than 1+ of proteinuria in both consecutive tests performed at an interval of at least 2 weeks was regarded as a proteinuria. Serum creatinine was measured by compensated Jaffe method with rate-blanking.14 Chronic kidney disease was defined when there were either markers of kidney damage, such a proteinuria, or a decrease in estimated glomerular filtration rate (< 60 mL/min/1.73 m2 by MDRD equation).1516 Hypertensive retinopathy was defined as arteriolar changes caused by hypertension as assessed by an ophthalmologist. LVH was diagnosed by electrocardiography (ECG) when either the modified Cornell voltage criteria or the Sokolow-Lyon voltage combination criteria were met.17
The primary outcome during the follow-up period was all-cause death. The secondary outcomes were cardiac death, ischemic heart disease, ischemic stroke, hemorrhagic stroke, and major adverse cardiac and cerebrovascular events (MACCE) defined as a composite of all-cause death, ischemic heart disease, ischemic stroke, or hemorrhagic stroke during the follow-up period. All deaths were considered cardiac unless a definite non-cardiac cause could be established. Ischemic heart disease comprised patients who had typical angina pectoris symptoms without angiographic evaluation, intermediate coronary artery disease with 50%–70% of coronary artery stenosis as assessed by coronary angiography, and who had undergone percutaneous coronary intervention or coronary artery bypass graft surgery. Ischemic and hemorrhagic stroke was defined based on either computed tomography or magnetic resonance imaging (MRI).
Statistical analysis
Continuous variables are presented as mean ± standard deviation and differences were assessed by independent t-test or Wilcoxon rank sum test. Categorical variables are described as a number (n) with percentage (%) and differences were analyzed by Pearson χ2 or Fisher's exact test. For assessment of incidence of primary and secondary outcomes, survival curves were constructed using Kaplan-Meier estimates for time to the first event and compared using a log-rank test. The Cox proportional hazard model was used to compare the risks of mortalities and morbidities between the two groups. Multivariate binary logistic regression analysis was performed to identify independent predictors of all-cause mortality using a stepwise, backward selection process. Covariates were selected based on variables that had P value < 0.10 in univariate analysis. The criteria for inclusion and exclusion of variables in multivariate analysis were 0.05 and 0.10, respectively. Propensity scores were estimated using multiple logistic-regression analysis. We built a non-parsimonious logistic model predicting the probability of who tends to be exposed to HMOD, and verified the balance in terms of standardized mean difference of less than 10% and variance ratio of near 1.0 between those with presence or absence of HMOD. We included age, systolic blood pressure, presence of chronic kidney disease, diabetes, dyslipidemia, creatinine, fasting blood glucose, and statin use as covariates. Logistic regression analysis and the nearest available pair-matching method among patients with an individual propensity score were used for the estimation algorithm and matching algorithm, respectively. Matching was performed using a SAS macro with a greedy matching protocol (matching ration of 1 to n with replacement). The C-statistics for the propensity score model was 0.73. All tests were 2-tailed, and P < 0.05 was considered statistically significant. All analyses were performed with the Statistical Analysis Software package (SAS version 9.2; SAS Institute, Cary, NC, USA).
RESULTS
Baseline characteristics
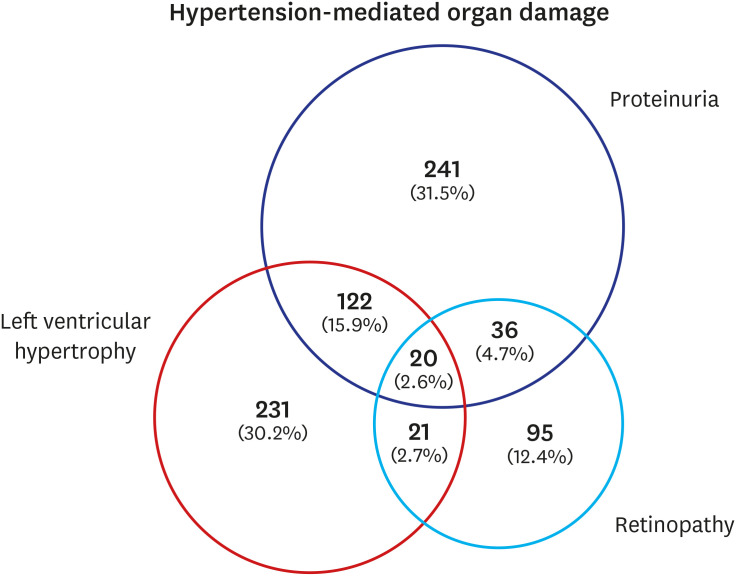
Baseline characteristics of study patients are listed in Table 1. All patients were male because the study was based on the medical records of Vietnamese veterans. Median age of the patients was 63.3 years (interquartile range [IQR], 61.4–65.4 years). Mean age of the HMOD group was significantly older than that of the non-HMOD group (64.6 ± 4.3 years vs. 63.7 ± 3.7 years, P < 0.001). Body mass index and office systolic and diastolic blood pressure were not significantly different between the two groups. Chronic kidney disease and diabetes were more prevalent in the HMOD group than in the non-HMOD group (56.4% vs. 43.6% and 41.0% vs. 33.4%, respectively, all P < 0.001). The prevalence of dyslipidemia was higher in the non-HMOD group at 27.0% (1,456 patients) compared to the 17.8% (98 patients) of the HMOD group (P < 0.001). Mean creatinine of the HMOD group was 1.4 ± 1.3 mg/dL, and was significantly higher than that of the non-HMOD group (0.9 ± 0.2 mg/dL, P < 0.001). Serum levels of total cholesterol, triglycerides, high-density lipoprotein cholesterol, and low-density lipoprotein cholesterol were not significantly different between the two groups. Presence of chronic kidney disease, diabetes, dyslipidemia and history of medication were well balanced in propensity score-matched population (Supplementary Table 1). When we analyzed the compositional distribution of organ damage in the HMOD group, nephropathy was the most prevalent (54.7%) (Fig. 2).
Table 1
Baseline characteristics
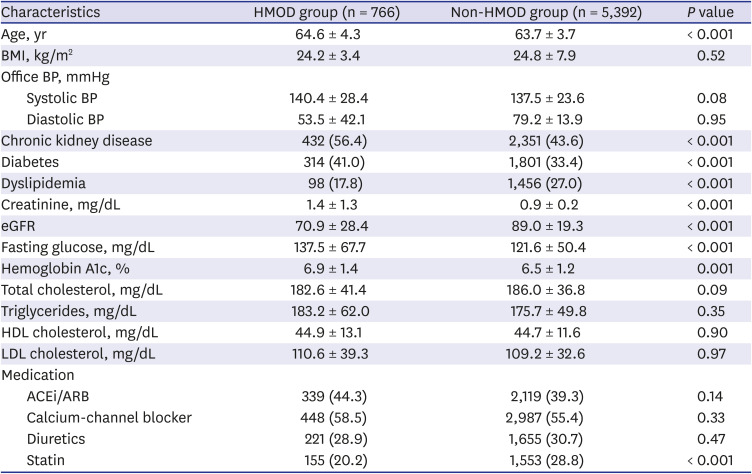
Values are presented as mean ± standard deviation or number (%).
HMOD = hypertension-mediated organ damage, BMI = body mass index, BP = blood pressure, eGFR = estimated glomerular filtration rate, HDL = high-density lipoprotein, LDL = low-density lipoprotein, ACEi/ARB = angiotensin converting enzyme inhibitor or aldosterone receptor blocker.
Clinical outcomes
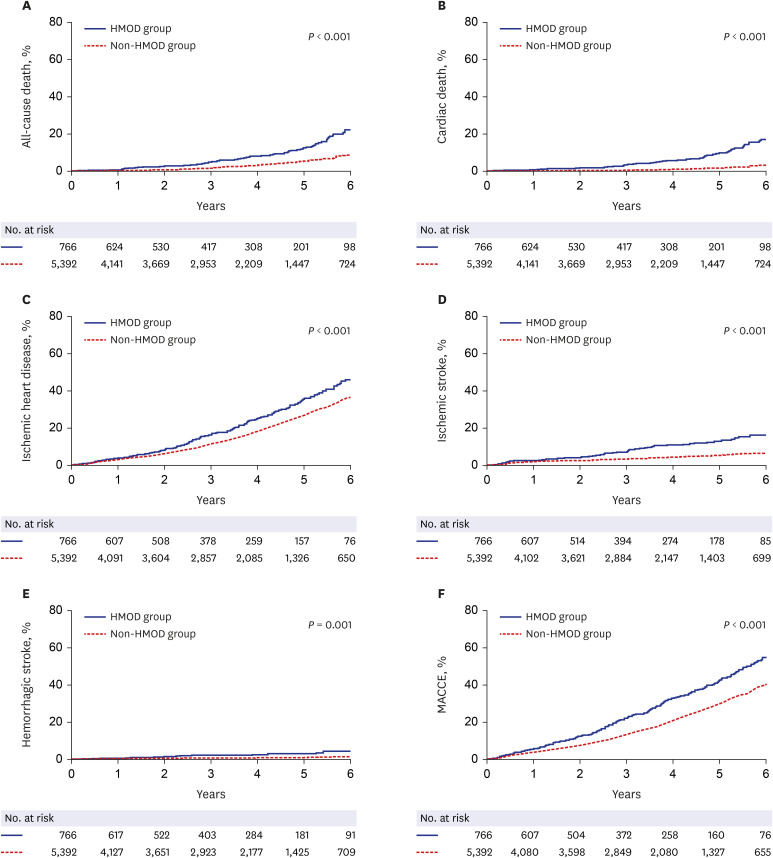
The median follow-up duration of the study was 6.6 years (IQR, 5.9–7.2 years). The estimated Kaplan-Meier event rate of each clinical outcome over 6 years is shown in Table 2. The 6-year incidence of all-cause death was 22.5% (70 patients) in the HMOD group and 9.0% (195 patients) in the non-HMOD group (adjusted hazard ratio [HR], 1.42; 95% confidence interval [CI], 1.01–2.00; P = 0.04). Cardiac death occurred in 17.4% (52 patients) of HMOD group and 3.9% (86 patients) of non-HMOD group (adjusted HR, 2.22; 95% CI, 1.41–3.49; P = 0.001). Ischemic heart disease and ischemic stroke were also prevalent in the HMOD group compared to the non-HMOD group at 6-year follow-up, and the difference between the groups were significant (adjusted HR, 1.24; 95% CI, 1.03–1.51 and adjusted HR, 1.74; 95% CI, 1.22–2.47, respectively, all P < 0.05). The incidence of hemorrhagic stroke was 4.6% (19 patients) in the HMOD group and 1.8% (57 patients) in the non-HMOD group (adjusted HR, 2.17; 95% CI, 1.11–4.21; P = 0.02). The 6-year incidence of MACCE was higher in the HMOD group (55.3%) compared with the non-HMOD group (41.3%), and the difference was significant (adjusted HR, 1.33; 95% CI, 1.12–1.58; P = 0.001). After a propensity score-matched analysis, the incidence of all outcomes in HMOD group were significantly higher compared with those in non-HMOD group. When we compared the incidence of clinical outcomes over 6 years using Kaplan-Meier survival curve (Fig. 3), all event rates were significantly higher in the HMOD group than in the non-HMOD group (all log-rank P < 0.05).
Table 2
Estimated Kaplan-Meier events rates over 6 years
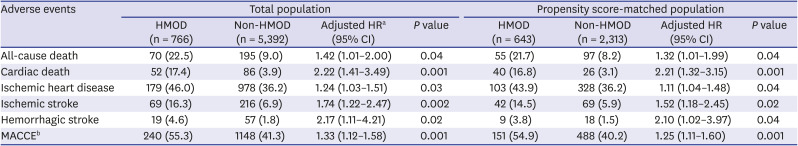
Values are presented as number (%) or HR (95% CI). The percentages shown are Kaplan-Meier estimates from the intention to treat analysis.
HMOD = hypertension mediated organ damage, HR = hazard ratio, CI = confidence interval, MACCE = major adverse cardiac and cerebrovascular events.
aHR was adjusted with age, presence of diabetes, dyslipidemia, and chronic kidney disease; bMACCE included all-cause death, ischemic heart disease, ischemic and hemorrhagic stroke.
Fig. 3
Cumulative incidence of cardiovascular event between two groups. Comparison of (A) all-cause death, (B) cardiac death, (C) ischemic heart disease, (D) ischemic stroke, (E) hemorrhagic stroke, and (F) MACCE between the two groups.
HMOD = hypertension-mediated organ damage, MACCE = major adverse cardiac and cerebrovascular events.
Subgroup analysis
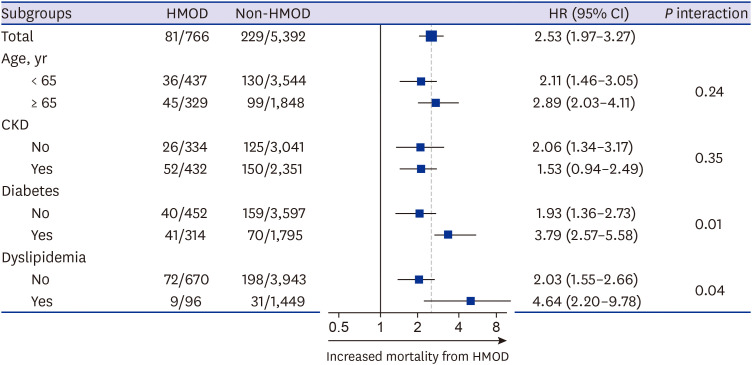
We performed subgroup analysis to confirm the association between HMOD and primary outcome across various comorbid conditions (Fig. 4). The presence of HMOD affected mortality regardless of age group, chronic kidney disease, diabetes, and dyslipidemia.
Independent risk factor
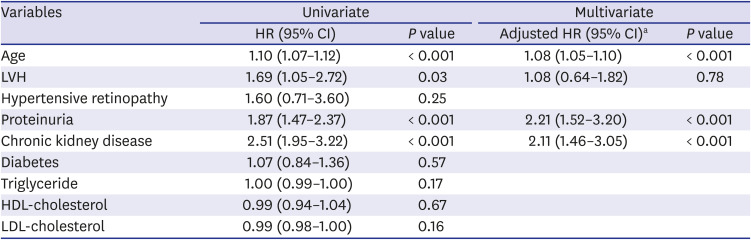
In univariate analysis using the components of HMOD and comorbid conditions, old age, presence of LVH, proteinuria, increased fasting glucose level, and increased serum creatinine level were associated with increased risk of all-cause death (Table 3). According to multivariate analysis, old age (adjusted HR, 1.08; 95% CI, 1.05–1.10; P < 0.001), proteinuria (adjusted HR, 2.21; 95% CI, 1.52–3.20; P < 0.001), and chronic kidney disease (adjusted HR, 2.11; 95% CI, 1.46–3.05; P < 0.001) were independent risk factors to predict all-cause death.
Table 3
Risk assessment for primary outcome
Analysis according to degree of proteinuria
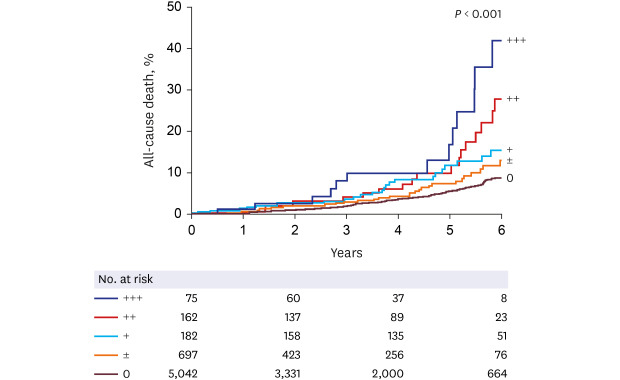
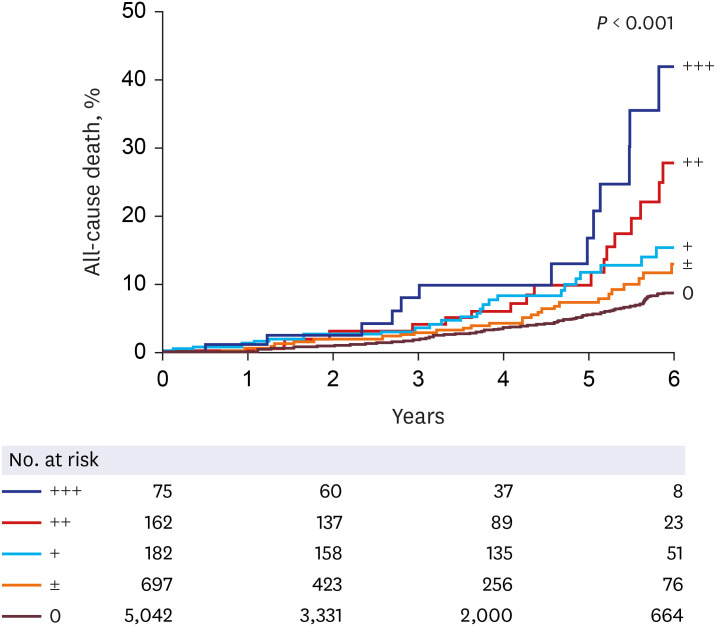
Among the independent risk factors for prediction of all-cause death in Table 3, presence of proteinuria showed the most powerful association with increased risk of all-cause death. Therefore, we analyzed whether degree of proteinuria was also associated with all-cause death. The patients with proteinuria were divided into 3 groups (+, ++, and +++) and were analyzed along with patients without proteinuria and with trace proteinuria (Fig. 5). As degree of proteinuria increased, the rate of all-cause death also increased (long-rank P < 0.001).
DISCUSSION
In this study, we investigated the association between HMOD and CV events in treated hypertensive patients without prior CV disease. Patients with HMOD had higher incidence of all-cause death and CV events including cardiac death, ischemic heart disease, ischemic stroke, hemorrhagic stroke and MACCE compared with patients without HMOD. The most prevalent organ damage among the components of HMOD was nephropathy. In multivariate analysis, proteinuria, serum creatinine, age, and fasting glucose were independent risk factors for all-cause death. As degree of proteinuria increased, a greater rate of all-cause death was observed.
The prevalence of HMOD varies by study. The reason for this is thought to be differences among races and the diversity of diagnostic tools of HMOD. In a recent European study, LVH was the most prevalent HMOD and was found in more than 50% of a hypertensive cohort.18 That study used M-mode echocardiography to determinate LVH, and about 80% of patients had previous CV disease. In the present study, LVH was the second most common HMOD. Because we used 12-lead ECG which has poor sensitivity, the prevalence of LVH may be underestimated in our study. However, as the research subjects of our study comprised a large-scale health examination group, echocardiography could not be performed in all patients. Although echocardiographic assessment of LVH is a potent predictor of mortality in hypertension patients,19 this is not cost-effective and cannot be adopted in routine clinical practice. In addition, the subjects of our study consisted only of CV event-naïve patients. The unique characteristics of this study population may show better correlation between HMOD and CV events compared to studies involving a larger number of patients with previous CV events.
Unlike LVH on echocardiography and retinopathy, which requires an ophthalmologic examination, the presence of proteinuria can be easily assessed in the clinic. Hypertension is the second most frequent cause of chronic renal disease after diabetes.20 Nephropathy was the most common HMOD in this study. A progressive reduction in serum creatinine and increased proteinuria indicate progressive loss of renal function. Both are independent and additive predictors of increased CV risk and progression of renal disease.212223 Proteinuria is a more sensitive marker than serum creatinine because a major reduction in renal function is needed to increase serum creatinine. In this study, proteinuria and serum creatinine were independent factors in predicting all-cause death. Higher degree of proteinuria was associated with increased risk of all-cause death. Therefore, consecutive results of urinalysis or dipstick test indicating high CV risk could provide useful information to clinicians to estimate the benefits of antihypertensive therapy.
There are several limitations in this study. First, the study was observational and used large-scale health examination data. Detailed clinical information such as medical history could not be collected. In addition, as end point assessment was most likely based on medical chart review, subjects who were lost to follow up may not have been assessed properly. However, due to the specificity of the Veterans Hospital, national merit recipients and their families gather from all over the country to receive medical services. Even patients who have been treated for hypertension in primary clinic are referred to our hospital when further medical treatment is needed, such as CV events. Therefore, it is thought that the events identified by medical record reviews alone are not undervalued. This may be based on the fact that the incidence of events in this study is not small compared to that in the general multidisciplinary studies. Second, there was a lack of data on blood pressure changes. We could not confirm whether blood pressure was well controlled or not in the study patients. This is also a limitation as a study based on large-scale health examination data, not medical records at clinic. Third, although ECG is cost-effective in diagnosis of LVH, diagnostic accuracy is better with echocardiography or cardiac MRI. The subjects of this study are participants of a national health examination. Therefore, uninsured patients were not included, which is another limitation of this study. However, many studies have reported correlations between LVH and CV events diagnosed by echocardiography or cardiac MRI. The major results of this study may not have been affected by differences in test methods.
The HMOD was associated with increased risk of mortality and CV events in prior CV event-naïve patients. In this study, the most prevalent organ damage was nephropathy. Proteinuria was the most powerful independent risk factor for all-cause death in hypertensive patients. Degree of proteinuria and mortality rate were proportional. Monitoring of proteinuria is important to predict long-term CV events in hypertensive patients.
 XML Download