Journal List > J Korean Med Sci > v.35(40) > 1146206

Kim, Nam, Son, Kim, Son, Ahn, Shim, Hong, Kim, Choi, Kang, Choi, Yoon, Uhm, and Jung: Cardiac Manifestations of Coronavirus Disease 2019 (COVID-19): a Multicenter Cohort Study

Abstract

Background

This study aimed to investigate the cardiac manifestations of coronavirus disease 2019 (COVID-19).

Methods

From February to March 2020, we prospectively and retrospectively enrolled consecutive patients diagnosed with COVID-19. Patient's data such as the demographic characteristics, symptoms, vital signs, laboratory and radiologic findings, electrocardiographic, and echocardiographic data, including the global longitudinal strain (GLS) of both ventricles, were obtained.

Results

Forty patients (median age, 58 years; 50% men) were enrolled in the initial analysis. Patients were classified into severe and nonsevere groups based on the current guidelines. The 13 patients in the severe group were significantly older, had a greater prevalence of bilateral pneumonia and leukocytosis, and higher aspartate transaminase levels than patients in the nonsevere group. Patients in the severe group had a slightly lower left ventricular ejection fraction (LVEF) than those in the nonsevere group (median [interquartile range], 61.0% [58.5%, 62.3%] vs. 66.7% [60.6%, 69.8%], P = 0.015). In a subgroup of 34 patients in whom GLS could be analyzed, patients in the severe group had a significantly impaired left ventricular GLS (LVGLS) than those in the nonsevere group (−18.1% [−18.8%, −17.1%] vs. −21.7% [−22.9%, −19.9%], P = 0.001). There were no significant differences in total wall (RVGLStotal, −19.3% [−23.9%, −18.4%] vs. −24.3% [−26.0%, −22.6%], P = 0.060) and free wall (RVGLSfw, −22.7% [−27.2%, −18.6%] vs. −28.8% [−30.4%, −24.1%], P = 0.066) right ventricle GLS (RVGLS).

Conclusion

Patients with severe COVID-19 had lower LVEF and LVGLS. RVGLS was not different between patients with severe and nonsevere COVID-19.

Graphical Abstract

jkms-35-e366-abf001.jpg

INTRODUCTION

In November 2019, an outbreak of unexplained pneumonia occurred in Wuhan, China, and the causative pathogen was identified as severe acute respiratory syndrome coronavirus 2.1 This disease, named coronavirus disease 2019 (COVID-19), was declared a pandemic, and as of May 6, 2020, more than 3.5 million cases had occurred in 6 continents and 247,000 patients died, resulting in a mortality rate of 6.9%.2 An analysis of 1,099 patients in China showed that 5.0% of patients needed intensive care and 2.3% needed mechanical ventilation.3 Older patients and those with comorbid hypertension, diabetes, coronary artery disease, heart failure, chronic obstructive pulmonary disease, cardiac arrhythmia, and current smoking had a higher mortality risk.456 Approximately 23% of patients with COVID-19 who needed critical care had myocardial injuries,7 which were also associated with fatal outcomes.6 However, the cardiac manifestations in patients with COVID-19 are not well known, and no prospective study has analyzed the cardiac manifestations of COVID-19. Thus, this study aimed to investigate the cardiac manifestations of COVID-19 to provide information relevant for the management and treatment of this pandemic disease.

METHODS

Study sample

From February to March 2020, we prospectively and retrospectively enrolled consecutive patients who were diagnosed with COVID-19 by reverse-transcriptase polymerase-chain-reaction assay before admission in three referral centers and one COVID-19-dedicated hospital. The subjects were classified into nonsevere and severe disease according to the current guidelines on community-acquired pneumonia.8 From the 4 medical centers, 28 and 14 patients were enrolled prospectively and retrospectively, respectively. Among them, a 5-year-old girl and 1 patient with subcutaneous emphysema whose echocardiographic data could not be obtained were excluded. Finally, 40 subjects were enrolled in the initial analysis to examine the cardiac manifestations of COVID-19 (Supplementary Fig. 1).

Clinical data collection

The patients' data were retrieved from each institution's electronic medical records. We obtained demographic data, symptoms, vital signs, laboratory and radiologic findings, and electrocardiographic data. All laboratory tests were performed at the discretion of the physicians. The final follow-up date was April 4, 2020.

Electrocardiography (ECG)

All but one patient underwent ECG examination during hospitalization. Heart rate, rhythm, PR interval, QRS duration, QT interval, and corrected by Bazett's formula were measured. A corrected QT (QTc) > 470 ms, the 99th percentile value in the health population of both sexes after prepuberty, was considered a prolonged QTc.9

Conventional transthoracic echocardiography (TTE)

Bedside TTE was performed in all patients using Vscan (1 patient) (GE Healthcare, Milwaukee, WI, USA), LOGIQ V2 (27 patients) (GE Healthcare), Lumify (5 patients) (Philips, Bothell, WA, USA), and CX50 (7 patients) (Philips). The examiners at each hospital wore level-D personal protective equipment during the TTE exam. To prevent the iatrogenic spread of infection, the TTE vendor and transducer were sterilized for 3 days after all the patients in each ward were examined. TTE was performed using portable ultrasound machines that could not export exam data in a DICOM file format in 2 hospitals.
The median time from admission to the TTE exam was 14 days (5 days in the severe group and 15 days in the nonsevere group). Two-dimensional (2D) conventional measurements were acquired based on the guidelines of the American Society of Echocardiography.10 Doppler measurements of pulse wave velocity on the mitral inflow and ejection fraction using the biplane Simpson's method were available for 34 of 40 patients. Tissue Doppler velocity, estimated right ventricular systolic pressure using the velocity of tricuspid regurgitation, and tricuspid annular plane systolic excursion (TAPSE) were measured only in the severe COVID-19 group using the CX50 device.

Speckle-tracking echocardiography (STE)

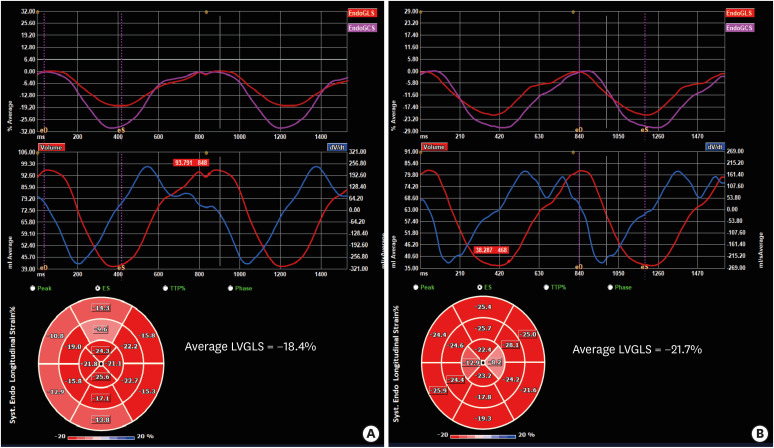
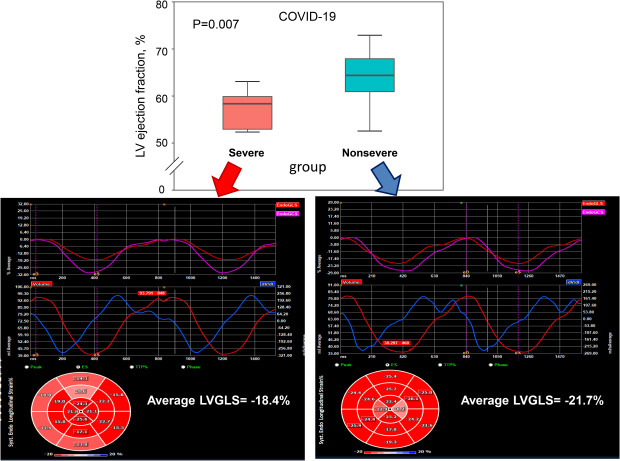
The DICOM files of the echocardiographic images of 34 patients were sent to the core laboratory at Yongin Severance Hospital. STE analyses were conducted according to the recommendations of the American Society of Echocardiography and European Association of Cardiovascular Imaging.11 All strain analysis images were recorded at least 50 frames per second to ensure a reliable analysis. The analysis was conducted by an experienced sonographer (not involved the present study) who was blinded to the patients' information using vendor-independent 2D Cardiac Performance Analysis software (TomTec Imaging System, Munich, Germany). In brief, the endocardial ventricle borders were manually traced on the end-systolic frames in the apical 4-chamber, 2-chamber, 3-chamber, and right ventricle (RV)-focused apical 4-chamber views when the global longitudinal strain (GLS) was measured, with end-systole defined as the smallest left ventricle (LV) or RV volume during the cardiac cycle. The software tracks speckles along the ventricular endocardial border and myocardium throughout the cardiac cycle. The average GLS of the LV (LVGLS) (Fig. 1), RV total wall GLS (RVGLStotal) including the interventricular septum, and the RV free wall GLS (RVGLSfw) were calculated. Negative strain values indicate contraction and tissue shortening, and thus a higher value (i.e., a lower absolute value) represents poorer ventricular systolic function.
Fig. 1

Left venticicular global longitudinal strain obtained from 2-dimensional speckle tracking echocardiography according to disease severity in coronavirus disease 2019 patients. (A) Representative image of a patient in the severe group; (B) Representative image of a patient in the nonsevere group.

LVGLS = left venticicular global longitudinal strain.
jkms-35-e366-g001

Measurement reproducibility

Inter- and intra-observer variabilities for measurements of GLS were assessed in all available patients. To determine intra-observer variability, the same analyzer repeated measurement for GLS for each selected patient at a separate time point. Additionally, inter-observer variability for measurements of GLS was assessed by the second observer who was blinded to the first analyzer's measurements.

Statistical analysis

Continuous variables were presented as median [interquartile range] and compared using Mann-Whitney U test. Categorical variables were presented as absolute frequencies and percentages and compared using Fisher's exact test. Logistic regression and receiver operating characteristics (ROC) curve analysis were performed to evaluate the diagnostic performance of echocardiographic parameters for classifying severity. Although calculating sample size for logistic regression is a complex problem, Peduzzi et al.12 suggested that one variable per 10 to 15 patients could be used for adjustment without overfitting. Therefore, to alleviate overfitting concerns with our cohort of 34 patients, we used a maximum of two variables for adjustment in multivariable logistic regression analysis. All statistical analyses were performed using R version 3.6.0 software (R Development Core Team, Vienna, Austria) and SAS software version 9.4 (SAS Institute Inc., Cary, NC, USA). A two-sided P value of < 0.05 was considered statistically significant.

Ethics statement

All patients enrolled the prospective cohort provided informed consent. This was a prospective and retrospective cohort study. The study design was approved by the Institutional Review Board (IRB) of each center (IRB No. 9-2020-0014 at Yongin Severance Hospital and Chungju Medical Center, 4-2020-0425 at Severance Hospital, and YUMC 2020-04-026-001 at Yeungnam University Medical Center, 2020-05-090 at Keimyung University Dongsan Hospital) and the study was conducted in accordance with the Declaration of Helsinki.13 The IRB waived the need for informed consent from patients who were retrospectively included owing to the study's retrospective nature and the absence of patients' identification in the data presented.

RESULTS

Baseline characteristics and subjective findings and management

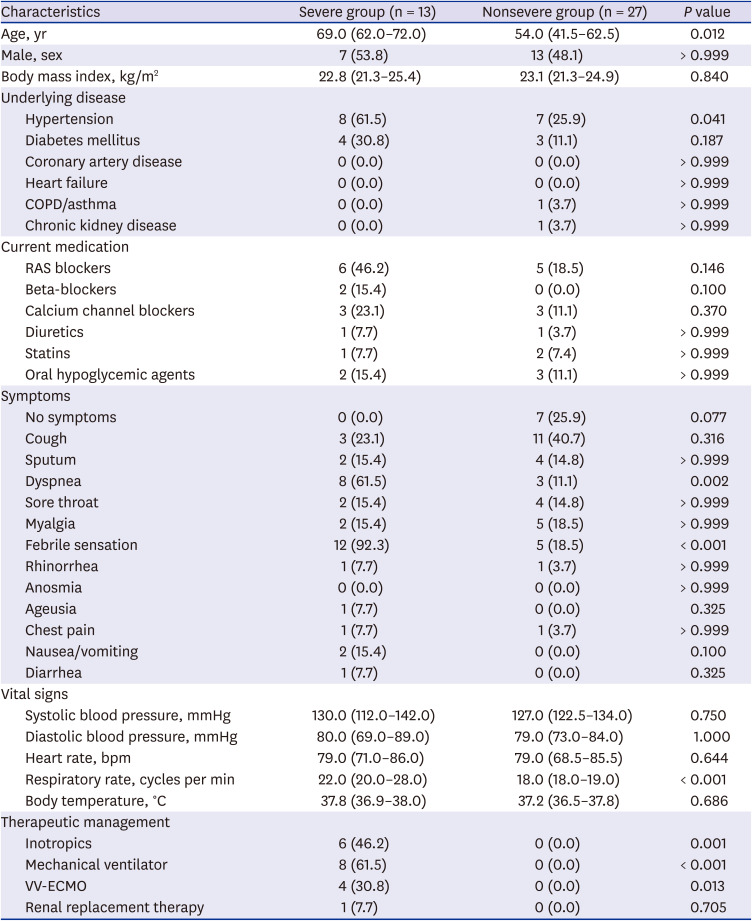
The baseline clinical characteristics of the total population are summarized in Table 1. Half of the 40 enrolled patients (age, 58.0 [43.0, 69.0] years) were men. Thirteen patients were classified into the severe group and required intensive care unit care at enrollment. The median body mass index was 22.9 [21.2, 25.2] kg/m2 and there was no significant difference between the groups. Dyspnea, febrile sensation, and history of hypertension (61.5% vs. 25.9%, P = 0.041). were significantly more frequent in the severe group than in the nonsevere group. One patient in the severe group had ageusia. Inotropic agents were more frequently needed in the severe group; mechanical ventilators were used in 8 of 13 patients. Veno-venous extracorporeal membrane oxygenation supports were provided in 4 patients in the severe group.
Table 1

Baseline characteristics of the patients according to disease severity

jkms-35-e366-i001
Characteristics Severe group (n = 13) Nonsevere group (n = 27) P value
Age, yr 69.0 (62.0–72.0) 54.0 (41.5–62.5) 0.012
Male, sex 7 (53.8) 13 (48.1) > 0.999
Body mass index, kg/m2 22.8 (21.3–25.4) 23.1 (21.3–24.9) 0.840
Underlying disease
Hypertension 8 (61.5) 7 (25.9) 0.041
Diabetes mellitus 4 (30.8) 3 (11.1) 0.187
Coronary artery disease 0 (0.0) 0 (0.0) > 0.999
Heart failure 0 (0.0) 0 (0.0) > 0.999
COPD/asthma 0 (0.0) 1 (3.7) > 0.999
Chronic kidney disease 0 (0.0) 1 (3.7) > 0.999
Current medication
RAS blockers 6 (46.2) 5 (18.5) 0.146
Beta-blockers 2 (15.4) 0 (0.0) 0.100
Calcium channel blockers 3 (23.1) 3 (11.1) 0.370
Diuretics 1 (7.7) 1 (3.7) > 0.999
Statins 1 (7.7) 2 (7.4) > 0.999
Oral hypoglycemic agents 2 (15.4) 3 (11.1) > 0.999
Symptoms
No symptoms 0 (0.0) 7 (25.9) 0.077
Cough 3 (23.1) 11 (40.7) 0.316
Sputum 2 (15.4) 4 (14.8) > 0.999
Dyspnea 8 (61.5) 3 (11.1) 0.002
Sore throat 2 (15.4) 4 (14.8) > 0.999
Myalgia 2 (15.4) 5 (18.5) > 0.999
Febrile sensation 12 (92.3) 5 (18.5) < 0.001
Rhinorrhea 1 (7.7) 1 (3.7) > 0.999
Anosmia 0 (0.0) 0 (0.0) > 0.999
Ageusia 1 (7.7) 0 (0.0) 0.325
Chest pain 1 (7.7) 1 (3.7) > 0.999
Nausea/vomiting 2 (15.4) 0 (0.0) 0.100
Diarrhea 1 (7.7) 0 (0.0) 0.325
Vital signs
Systolic blood pressure, mmHg 130.0 (112.0–142.0) 127.0 (122.5–134.0) 0.750
Diastolic blood pressure, mmHg 80.0 (69.0–89.0) 79.0 (73.0–84.0) 1.000
Heart rate, bpm 79.0 (71.0–86.0) 79.0 (68.5–85.5) 0.644
Respiratory rate, cycles per min 22.0 (20.0–28.0) 18.0 (18.0–19.0) < 0.001
Body temperature, °C 37.8 (36.9–38.0) 37.2 (36.5–37.8) 0.686
Therapeutic management
Inotropics 6 (46.2) 0 (0.0) 0.001
Mechanical ventilator 8 (61.5) 0 (0.0) < 0.001
VV-ECMO 4 (30.8) 0 (0.0) 0.013
Renal replacement therapy 1 (7.7) 0 (0.0) 0.705
Values are presented as median (interquartile range) or number (%).
COPD = chronic obstructive pulmonary disease, RAS = renin-angiotensin system, VV-ECMO = veno-venous extracorporeal membrane oxygenation.

Physical, radiological, and laboratory findings

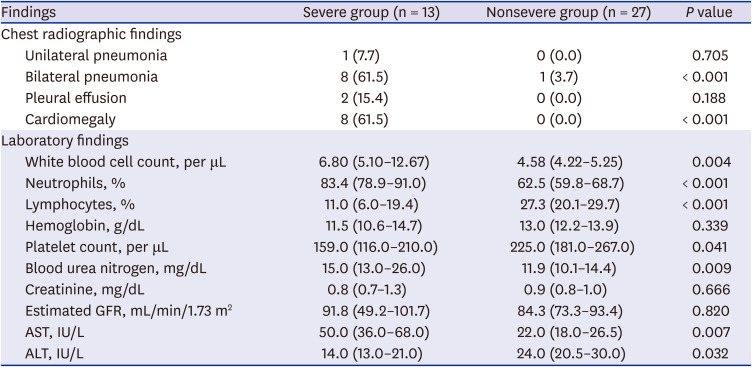
The respiratory rate was significantly higher in the severe group than in the nonsevere group (Table 2). There was no significant difference in body temperature between the groups. The severe group had more serious form of pneumonia on plain chest radiographs: increased bilateral infiltration and greater frequency of lobar pneumonia than bronchopneumonia. Eight of 13 patients in the severe group had cardiomegaly compared to none in the nonsevere group. Leukocytosis, decreased platelet count, and relative lymphopenia were more frequently observed in the severe group. Blood urea nitrogen and aspartate transaminase were elevated in the severe group, but glomerular filtration rate was similar between the groups (Table 2).
Table 2

Radiographic and laboratory findings, according to disease severity

jkms-35-e366-i002
Findings Severe group (n = 13) Nonsevere group (n = 27) P value
Chest radiographic findings
Unilateral pneumonia 1 (7.7) 0 (0.0) 0.705
Bilateral pneumonia 8 (61.5) 1 (3.7) < 0.001
Pleural effusion 2 (15.4) 0 (0.0) 0.188
Cardiomegaly 8 (61.5) 0 (0.0) < 0.001
Laboratory findings
White blood cell count, per μL 6.80 (5.10–12.67) 4.58 (4.22–5.25) 0.004
Neutrophils, % 83.4 (78.9–91.0) 62.5 (59.8–68.7) < 0.001
Lymphocytes, % 11.0 (6.0–19.4) 27.3 (20.1–29.7) < 0.001
Hemoglobin, g/dL 11.5 (10.6–14.7) 13.0 (12.2–13.9) 0.339
Platelet count, per μL 159.0 (116.0–210.0) 225.0 (181.0–267.0) 0.041
Blood urea nitrogen, mg/dL 15.0 (13.0–26.0) 11.9 (10.1–14.4) 0.009
Creatinine, mg/dL 0.8 (0.7–1.3) 0.9 (0.8–1.0) 0.666
Estimated GFR, mL/min/1.73 m2 91.8 (49.2–101.7) 84.3 (73.3–93.4) 0.820
AST, IU/L 50.0 (36.0–68.0) 22.0 (18.0–26.5) 0.007
ALT, IU/L 14.0 (13.0–21.0) 24.0 (20.5–30.0) 0.032
Values are presented as median (interquartile range) or number (%).
GFR = glomerular filtration rate, AST = aspartate aminotransferase, ALT = alanine aminotransferase.
Cardiac-specific biomarkers were identified in the severe group (Supplementary Table 1). Of the 12 patients, seven had a higher level of N-terminal pro-brain natriuretic peptide (NT-proBNP) (661.8 [154.5, 1,123.8] pg/mL), and five had elevated cardiac troponin-T or troponin-I levels. One patient (number 37) had markedly elevated levels of both NT-proBNP (1,929 pg/mL) and troponin-I (1.260 ng/mL).

Electrocardiographic findings

All patients enrolled in the study had sinus rhythm. Only one patient developed paroxysmal atrial fibrillation during hospitalization. The median heart rate was 72 bpm; 2 patients had inferior Q waves but no regional wall motion abnormalities on TTE. Conduction disturbance was detected in 3 patients: 2 had right bundle branch block while the other had a left anterior fascicular block. There were no differences in ECG parameters, including PR interval, QRS duration, QT interval, and QTc, between groups (Supplementary Table 2). Three patients in the severe group had a QTc longer than 470 ms compared to none in the nonsevere group (P = 0.029).

Conventional echocardiographic parameters

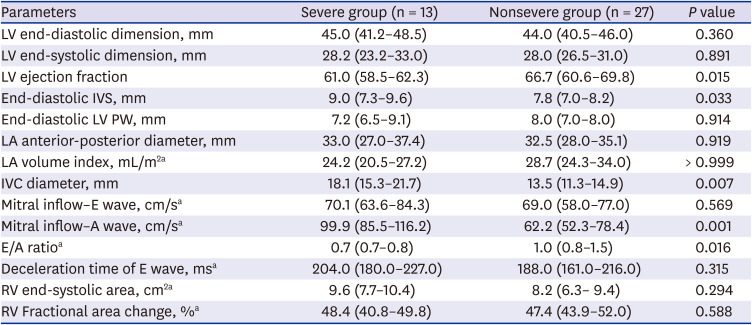
There were no significant differences in LV end-systolic and end-diastolic volume between groups (Table 3). The median left ventricular ejection fraction (LVEF) was 62.6%; LVEF was significantly lower in the severe group than in the nonsevere group (61.0% [58.5%, 62.3%] vs. 66.7% [60.6%, 69.8%], P = 0.015). In the severe group, one patient diagnosed with myocarditis had severely depressed LV systolic function (LVEF of 25%). The inferior vena cava diameter at expiration was larger in the severe group than in the nonsevere group (18.1 [15.3, 21.7] vs. 13.5 [11.3, 14.9], P = 0.001) but 8 patients in the severe group were receiving mechanical ventilator support. The E/A ratio was significantly lower in the severe group (0.7 [0.7, 0.8] vs. 1.0 [0.8, 1.5], P = 0.016) but deceleration time showed no difference between groups.
Table 3

Echocardiographic parameters according to disease

jkms-35-e366-i003
Parameters Severe group (n = 13) Nonsevere group (n = 27) P value
LV end-diastolic dimension, mm 45.0 (41.2–48.5) 44.0 (40.5–46.0) 0.360
LV end-systolic dimension, mm 28.2 (23.2–33.0) 28.0 (26.5–31.0) 0.891
LV ejection fraction 61.0 (58.5–62.3) 66.7 (60.6–69.8) 0.015
End-diastolic IVS, mm 9.0 (7.3–9.6) 7.8 (7.0–8.2) 0.033
End-diastolic LV PW, mm 7.2 (6.5–9.1) 8.0 (7.0–8.0) 0.914
LA anterior-posterior diameter, mm 33.0 (27.0–37.4) 32.5 (28.0–35.1) 0.919
LA volume index, mL/m2a 24.2 (20.5–27.2) 28.7 (24.3–34.0) > 0.999
IVC diameter, mm 18.1 (15.3–21.7) 13.5 (11.3–14.9) 0.007
Mitral inflow–E wave, cm/sa 70.1 (63.6–84.3) 69.0 (58.0–77.0) 0.569
Mitral inflow–A wave, cm/sa 99.9 (85.5–116.2) 62.2 (52.3–78.4) 0.001
E/A ratioa 0.7 (0.7–0.8) 1.0 (0.8–1.5) 0.016
Deceleration time of E wave, msa 204.0 (180.0–227.0) 188.0 (161.0–216.0) 0.315
RV end-systolic area, cm2a 9.6 (7.7–10.4) 8.2 (6.3– 9.4) 0.294
RV Fractional area change, %a 48.4 (40.8–49.8) 47.4 (43.9–52.0) 0.588
Values are presented as median (interquartile range).
LV = left ventricle, IVS = interventricular septum, PW = posterior wall, LA = left atrium, IVC = inferior vena cava.
aParameters could be measured 34 of 40 patients with coronavirus disease.
Conventional RV parameters, such as RV end-systolic area and fractional area change, were also similar between the groups (Table 3).
There were no significant valvular lesions except for aortic valve sclerosis (2 and 1 patients in the severe and nonsevere groups, respectively) and mitral annular calcification (1 patient in the severe group). One patient in the severe group had scanty amount of pericardial effusion. Prominent epicardial fat was seen in a patient in the nonsevere group.

STE analysis

Thirty-four patients whose DICOM video files were available were eligible for STE analysis. In this subset, patients in the severe group were significantly older and had more frequent history of hypertension than those in the nonsevere group, a similar trend with the total population. (Supplementary Table 3).
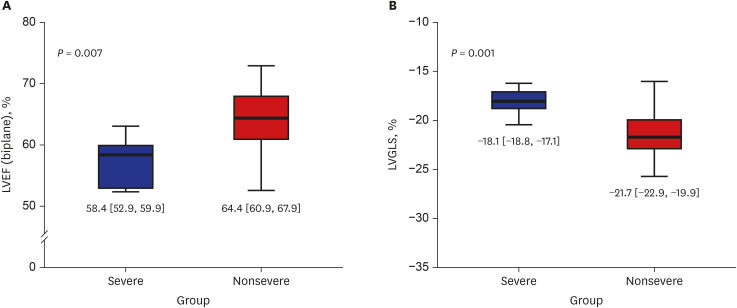
The interventricular septum was slightly thicker in the severe group. LVEF measured using biplane Simpson' method was significantly lower in the severe group (58.4% [52.9%, 59.9%] vs. 64.4% [60.9%, 67.9%], P = 0.007) (Fig. 2A), although LVEF was within normal range, that is similar trend in total population (Supplementary Table 4).
Fig. 2

Echocardiographic parameters of left ventricle according to disease severity in patients with coronavirus disease 2019. (A) LVEF and (B) LVGLS according to disease severity.

LVEF = left ventricular ejection fraction, LVGLS = left venticicular global longitudinal strain.
jkms-35-e366-g002
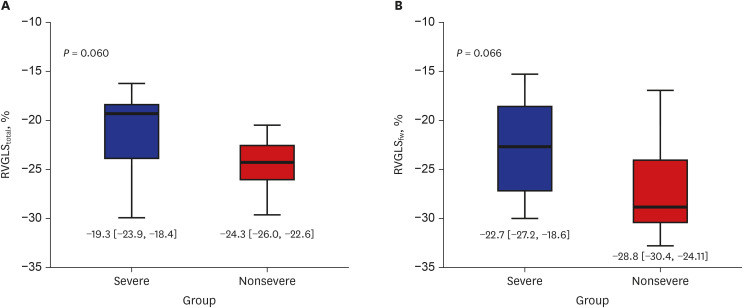
The severe group had significantly impaired LVGLS value compared to the nonsevere group (−18.1% [−18.8%, −17.1%] vs. −21.7% [−22.9%, −19.9%], P = 0.001) (Fig. 2B). There were no significant differences in the total and free wall RVGLS between the two groups (RVGLStotal: −19.3% [−23.9%, −18.4%] vs. −24.3% [−26.0%, −22.6%], P = 0.060; RVGLSfw: −22.7% [−27.2%, −18.6%] vs. −28.8% [−30.4%, −24.1%], P = 0.066] (Fig. 3A and B).
Fig. 3

Echocardiographic parameters of right ventricle according to disease severity in patients with coronavirus disease 2019. (A) RVGLStotal and (B) RVGLSfw according to disease severity.

RVGLStotal = right ventricle global longitudinal strain of including both the free wall and interventricular septum, RVGLSfw = right ventricular free wall global longitudinal strain.
jkms-35-e366-g003

Diagnostic performance of echocardiographic parameters

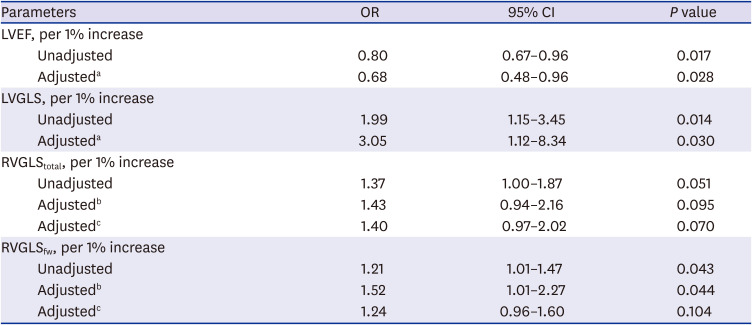
LVEF (adjusted odds ratio [OR], 0.68; 95% confidence interval [CI], 0.48, 0.96; P = 0.028) and LVGLS (OR, 3.05; 95% CI, 1.12, 8.34; P = 0.030) showed good diagnostic performance in the logistic regression analysis (Table 4). In the ROC analysis, the area under the curve of LVGLS and LVEF were 0.88 (95% CI, 0.77, 0.99) and 0.84 (95% CI, 0.70, 0.98), respectively, which was higher than those of RVGLStotal (0.74) and RVGLSfw (0.73) (Supplementary Fig. 2).
Table 4

Logistic regression analysis of echocardiographic parameters of disease severity diagnostic performance

jkms-35-e366-i004
Parameters OR 95% CI P value
LVEF, per 1% increase
Unadjusted 0.80 0.67–0.96 0.017
Adjusteda 0.68 0.48–0.96 0.028
LVGLS, per 1% increase
Unadjusted 1.99 1.15–3.45 0.014
Adjusteda 3.05 1.12–8.34 0.030
RVGLStotal, per 1% increase
Unadjusted 1.37 1.00–1.87 0.051
Adjustedb 1.43 0.94–2.16 0.095
Adjustedc 1.40 0.97–2.02 0.070
RVGLSfw, per 1% increase
Unadjusted 1.21 1.01–1.47 0.043
Adjustedb 1.52 1.01–2.27 0.044
Adjustedc 1.24 0.96–1.60 0.104
OR = odds ratio, CI = confidence interval, LVEF = left ventricular ejection fraction, LVGLS = left ventricle global longitudinal strain, RVGLStotal = right ventricle global longitudinal strain including both the free wall and interventricular septum, RVGLSfw = right ventricle free wall global longitudinal strain.
aAdjusted for hypertension; bAdjusted for aspartate transaminase levels and platelet count; cAdjusted for LVGLS.

Measurement reproducibility

In analysis of intra-observer variability, there was excellent correlation between two measurements. Intraclass correlation coefficients (ICC) for LVGLS, RVGLStotal, and RVGLSfw were 0.942, 0.955, and 0.938, respectively (all P < 0.001). Excellent inter-observer variability was also found (ICCs for LVGLS, RVGLStotal, and RVGLSfw were 0.963, 0.940, and 0.955; all P < 0.001). Bland-Altman plots presented that most of inter-observer differences were within 1 standard deviation (Supplementary Figs. 3 and 4).

DISCUSSION

The present study is the multicenter prospective and retrospective cohort to evaluate the cardiac manifestations in patients with COVID-19. The nonsevere group had a relatively hyperdynamic LV systolic function, whereas the severe group, despite administering inotropics, had grossly normal but statistically lower LV systolic function and more impaired LVGLS. Conventional RV function parameters were similar between the groups but RVGLSfw was numerically lower in the severe group.
Except for a patient with myocarditis, normal LVEF was seen on TTE. The normal immune responses to infection is to increase the sympathetic tone, which in turn increases heart rate and contractility.141516 In patients with advanced liver disease, although most show hyperdynamic LV contractility and high cardiac output, patients with normal or below-normal LVEF might have a subclinical form of cardiomyopathy or concurrent ischemic heart disease.1718 The severe COVID-19 group also might have a subclinical cardiac condition and may reveal normal but slightly lower EF compared with the nonsevere group when in an increased inflammatory state and higher adrenergic stimulation, as in the case of infection.
Compared with LVEF, LVGLS may be able to detect subclinical conditions earlier and predict the prognosis independently of LVEF in different clinical settings.192021 The LVGLS in in the severe group was slightly lower than that in the nonsevere group and the reference values for the general population, although LVEF was within normal range in both the groups.22 The mechanisms behind the LVGLS impairment in the severe group were not directly evaluated. However, the E/A ratio was significantly lower and deceleration time was numerically delayed in the severe group. Additionally, history of hypertension was more frequent in the severe group; thus, the diastolic function might be impaired in these patients, which might explain the decreased LVGLS in the severe group. Nevertheless, we showed that LVGLS still had a good diagnostic ability after adjusting for hypertension in the logistic regression analysis. Therefore, LVGLS may be a useful parameter for understanding and managing the cardiac manifestations of COVID-19, although it was difficult to demonstrate the casual relationship between disease severity and decreased LVGLS. Age showed a significant difference between groups at baseline; hence, it was not used for the adjustment in the logistic regression analysis. Even so, our findings may lead to the evaluation of LVGLS being added to the conventional parameters of cardiac function. This may provide additional information for physicians to identify patients with COVID-19 who require more careful examination or early intensive care, such as those with asymptomatic severe mitral regurgitation or aortic stenosis.192021 Further well-designed studies are needed to prove the causality between LVGLS impairment and disease severity in patients with COVID-19.
Based on the structural characteristics of the RV, which has predominantly longitudinally oriented muscle fibers, TAPSE has been used as an easily assessable index of RV systolic function.23 However, this parameter has inevitable limitations related to its angle dependency.24 RVGLS has advantages over other traditional echocardiographic parameters examining the RV function,25 and may be superior to TAPSE in predicting cardiovascular outcomes.26 A recently published article about RVGLSfw in the patients with COVID-19 demonstrated that RVGLSfw had significant predictive ability of poor clinical outcomes and higher mortality than conventional RV parameters.27 In our study, total and free wall RVGLS did not show significant differences between groups but were impaired in the severe group. The cutoff value of −23% in RVGLSfw for higher mortality from a previous study also matched the median value of the severe group in our study.27 The severe COVID-19 group had more extensive lung infiltration, which increases the RV afterload and may lead to subclinical RV dysfunction. Although our data revealed a trend that did not reach statistical significance, the measurement of RVGLS in patients with COVID-19 in clinical settings may help with the early detection of patients who require more intensive care. However, RVGLS might also influence LV function, and no significant differences between groups were found after adjusting for LVGLS in the logistic regression analysis. Thus, a more comprehensive approach and evaluation are required to determine the role of RVGLS in patients with COVID-19.
The present study had some limitations. First, when we first designed this study, the incidence of COVID-19 in South Korea was very high. However, during the prospective patient enrolment period after obtaining approval from the IRB, the incidence dropped abruptly. As a result, we had a relatively small sample size and there was no other option but to have a composite of prospective and retrospective designs. In addition, due to the complex vendor and transducer sterilization procedures, we could not perform TTE exam on a large number patients and, in 2 hospitals, TTE was performed using small size of portable machines that could not export examination data in the DICOM file format. Nevertheless, we analyzed echocardiographic data from the total sample and in the subset of patients with available STE data, and achieved consistent 2D LVEF findings. Second, the time from admission to TTE was slightly delayed in the nonsevere group. This was due to the prospective study design, as the TTE exam was only performed after IRB approval. Third, the decision to perform laboratory tests was left to the discretion of each physician in the prospective part of the study; thus, some data, such as cardiac markers, C-reactive protein, D-dimer, and lactate dehydrogenase, were not acquired. Finally, since the number of patients in the severe group was small, we performed statistical analyses using nonparametric methods and could not apply complex methods to investigate further differences regarding the cardiac manifestations of COVID-19 according to its severity. Well-designed prospective studies are needed to determine the impact of STE analysis on both LV and RV function for predicting cardiovascular outcomes.
In conclusion, patients with severe COVID-19 had lower LVEF and impaired LVGLS than those with nonsevere COVID-19. RVGLS was not different between the patients with severe and nonsevere COVID-19.

ACKNOWLEDGMENTS

All authors would like to appreciate Jin-Hye Park and Jung-A Lee for their effort and enthusiasm in performing the measurements of left and right ventricular speckle tracking echocardiography and conventional echocardiographic parameters. The authors thank Eun Young Choi, MD from Division of Pulmonology and Allergy and Jian Hur, MD from Division of Rheumatology and Infectious Disease, Department of Internal Medicine, Yeungnam University Medical Center, Daegu, Korea; Jin Young Ahn, MD and Jung Ho Kim, MD from Division of Infectious Disease, Department of Internal Medicine, Severance Hospital, Yonsei University College of Medicine, Seoul, Korea for their help with data collection. The authors would like to thank Young-Jin Song, MD, PhD, the director of Chungju Medical Center for his help with data collection; and Kina Hu, MBA from GE Healthcare, Younghun Chung, Yujin Kim, and Sanghee Kim from SONIC Healthcare, Inc. for their technical support. We would like to thank Editage (www.editage.co.kr) for English language editing.

Notes

Funding: This study was supported by a research grant from Daegu Medical Association COVID-19 Scientific Committee (2020).

Disclosure: The authors have no potential conflicts of interest to disclose.

Author Contributions:

  • Conceptualization: Kim M, Nam JH, Uhm JS.

  • Data curation: Nam JH, Son JW, Kim SO, Choi J, Kang SM, Choi YH, Yoon HK, Choi J, Kang SM, Choi YH, Yoon HK, Uhm JS.

  • Formal analysis: Kim M, Son NH.

  • Funding acquisition: Nam JH, Son JW.

  • Investigation: Kim SO, Ahn CM, Shim CY, Hong GR, Kim IC, Choi J, Kang SM, Choi YH, Yoon HK, Uhm JS.

  • Methodology: Kim M, Son NH, Uhm JS, Jung IH.

  • Project administration: Uhm JS.

  • Resources: Jung IH.

  • Supervision: Uhm JS, Jung IH.

  • Visualization: Kim M.

  • Writing - original draft: Kim M.

  • Writing - review & editing: Kim M, Nam JH, Son JW, Son NH, Ahn CM, Shim CY, Hong GR, Kim IC, Uhm JS, Jung IH.

References

1. Lu R, Zhao X, Li J, Niu P, Yang B, Wu H, et al. Genomic characterisation and epidemiology of 2019 novel coronavirus: implications for virus origins and receptor binding. Lancet. 2020; 395(10224):565–574. PMID: 32007145.
2. World Health Organization. Coronavirus Disease (COVID-2019) Situation Report-107. Geneva: World Health Organization;2020.
3. Guan WJ, Ni ZY, Hu Y, Liang WH, Ou CQ, He JX, et al. Clinical characteristics of coronavirus disease 2019 in China. N Engl J Med. 2020; 382(18):1708–1720. PMID: 32109013.
4. Deng SQ, Peng HJ. Characteristics of and public health responses to the coronavirus disease 2019 outbreak in China. J Clin Med. 2020; 9(2):575.
crossref
5. Mehra MR, Desai SS, Kuy S, Henry TD, Patel AN. Cardiovascular disease, drug therapy, and mortality in COVID-19. N Engl J Med. 2020; 382(26):2582.
crossref
6. Guo T, Fan Y, Chen M, Wu X, Zhang L, He T, et al. Cardiovascular implications of fatal outcomes of patients with coronavirus disease 2019 (COVID-19). JAMA Cardiol. 2020; 5(7):811–818. PMID: 32219356.
crossref
7. Yang X, Yu Y, Xu J, Shu H, Xia J, Liu H, et al. Clinical course and outcomes of critically ill patients with SARS-CoV-2 pneumonia in Wuhan, China: a single-centered, retrospective, observational study. Lancet Respir Med. 2020; 8(5):475–481. PMID: 32105632.
crossref
8. Metlay JP, Waterer GW, Long AC, Anzueto A, Brozek J, Crothers K, et al. Diagnosis and treatment of adults with community-acquired pneumonia. an official clinical practice guideline of the American Thoracic Society and Infectious Diseases Society of America. Am J Respir Crit Care Med. 2019; 200(7):e45–67. PMID: 31573350.
crossref
9. Vink AS, Neumann B, Lieve KVV, Sinner MF, Hofman N, El Kadi S, et al. Determination and interpretation of the QT interval. Circulation. 2018; 138(21):2345–2358. PMID: 30571576.
crossref
10. Lang RM, Badano LP, Mor-Avi V, Afilalo J, Armstrong A, Ernande L, et al. Recommendations for cardiac chamber quantification by echocardiography in adults: an update from the American Society of Echocardiography and the European Association of Cardiovascular Imaging. J Am Soc Echocardiogr. 2015; 28(1):1–39.e14. PMID: 25559473.
crossref
11. Mor-Avi V, Lang RM, Badano LP, Belohlavek M, Cardim NM, Derumeaux G, et al. Current and evolving echocardiographic techniques for the quantitative evaluation of cardiac mechanics: ASE/EAE consensus statement on methodology and indications endorsed by the Japanese Society of Echocardiography. Eur J Echocardiogr. 2011; 12(3):167–205. PMID: 21385887.
crossref
12. Peduzzi P, Concato J, Kemper E, Holford TR, Feinstein AR. A simulation study of the number of events per variable in logistic regression analysis. J Clin Epidemiol. 1996; 49(12):1373–1379. PMID: 8970487.
crossref
13. World Medical Association. World Medical Association Declaration of Helsinki: ethical principles for medical research involving human subjects. JAMA. 2013; 310(20):2191–2194. PMID: 24141714.
14. Karakas M, Haase T, Zeller T. Linking the sympathetic nervous system to the inflammasome: towards new therapeutics for atherosclerotic cardiovascular disease. Eur Heart J. 2018; 39(1):70–72. PMID: 29020243.
crossref
15. Paonessa JR, Brennan T, Pimentel M, Steinhaus D, Feng M, Celi LA. Hyperdynamic left ventricular ejection fraction in the intensive care unit. Crit Care. 2015; 19(1):288. PMID: 26250903.
crossref
16. Vieillard-Baron A, Prin S, Chergui K, Dubourg O, Jardin F. Hemodynamic instability in sepsis: bedside assessment by Doppler echocardiography. Am J Respir Crit Care Med. 2003; 168(11):1270–1276. PMID: 14644922.
17. Liu H, Jayakumar S, Traboulsi M, Lee SS. Cirrhotic cardiomyopathy: Implications for liver transplantation. Liver Transpl. 2017; 23(6):826–835. PMID: 28407402.
crossref
18. Ruiz-del-Árbol L, Serradilla R. Cirrhotic cardiomyopathy. World J Gastroenterol. 2015; 21(41):11502–11521. PMID: 26556983.
19. Zamorano JL, Lancellotti P, Rodriguez Muñoz D, Aboyans V, Asteggiano R, Galderisi M, et al. 2016 ESC position paper on cancer treatments and cardiovascular toxicity developed under the auspices of the ESC Committee for practice guidelines: the task force for cancer treatments and cardiovascular toxicity of the European Society of Cardiology (ESC). Eur J Heart Fail. 2017; 19(1):9–42. PMID: 27565769.
20. Yingchoncharoen T, Gibby C, Rodriguez LL, Grimm RA, Marwick TH. Association of myocardial deformation with outcome in asymptomatic aortic stenosis with normal ejection fraction. Circ Cardiovasc Imaging. 2012; 5(6):719–725. PMID: 23008423.
crossref
21. Kim HM, Cho GY, Hwang IC, Choi HM, Park JB, Yoon YE, et al. Myocardial strain in prediction of outcomes after surgery for severe mitral regurgitation. JACC Cardiovasc Imaging. 2018; 11(9):1235–1244. PMID: 29778855.
22. Sugimoto T, Dulgheru R, Bernard A, Ilardi F, Contu L, Addetia K, et al. Echocardiographic reference ranges for normal left ventricular 2D strain: results from the EACVI NORRE study. Eur Heart J Cardiovasc Imaging. 2017; 18(8):833–840. PMID: 28637227.
23. Kaul S, Tei C, Hopkins JM, Shah PM. Assessment of right ventricular function using two-dimensional echocardiography. Am Heart J. 1984; 107(3):526–531. PMID: 6695697.
crossref
24. Rudski LG, Lai WW, Afilalo J, Hua L, Handschumacher MD, Chandrasekaran K, et al. Guidelines for the echocardiographic assessment of the right heart in adults: a report from the American Society of Echocardiography endorsed by the European Association of Echocardiography, a registered branch of the European Society of Cardiology, and the Canadian Society of Echocardiography. J Am Soc Echocardiogr. 2010; 23(7):685–713. PMID: 20620859.
25. Lu KJ, Chen JX, Profitis K, Kearney LG, DeSilva D, Smith G, et al. Right ventricular global longitudinal strain is an independent predictor of right ventricular function: a multimodality study of cardiac magnetic resonance imaging, real time three-dimensional echocardiography and speckle tracking echocardiography. Echocardiography. 2015; 32(6):966–974. PMID: 25287078.
crossref
26. Carluccio E, Biagioli P, Alunni G, Murrone A, Zuchi C, Coiro S, et al. Prognostic value of right ventricular dysfunction in heart failure with reduced ejection fraction: superiority of longitudinal strain over tricuspid annular plane systolic excursion. Circ Cardiovasc Imaging. 2018; 11(1):e006894. PMID: 29321212.
crossref
27. Li Y, Li H, Zhu S, Xie Y, Wang B, He L, et al. Prognostic value of right ventricular longitudinal strain in patients with COVID-19. JACC Cardiovasc Imaging. Forthcoming. 2020; DOI: 10.1016/j.jcmg.2020.04.014.
crossref

SUPPLEMENTARY MATERIALS

Supplementary Table 1

Cardiac-specific biomarkers in severe coronavirus disease 2019 patients
jkms-35-e366-s001.doc

Supplementary Table 2

Electrocardiographic parameters according to disease severity in total population of coronavirus disease 2019 patients
jkms-35-e366-s002.doc

Supplementary Table 3

Baseline clinical characteristics according to disease severity in subpopulation of coronavirus disease 2019 patients with available strain analysis
jkms-35-e366-s003.doc

Supplementary Table 4

Echocardiographic parameters according to disease severity in the subset of patients with coronavirus disease 2019 who underwent speckle tracking echocardiography analysis
jkms-35-e366-s004.doc

Supplementary Fig. 1

Study flow.
jkms-35-e366-s005.doc

Supplementary Fig. 2

Receiver operating characteristics curves of LVEF, LVGLS, RVGLStotal, and RVGLSfw for determining disease severity.
jkms-35-e366-s006.doc

Supplementary Fig. 3

Bland-Altman plot for comparing intra-observer variability of GLS measurement.
jkms-35-e366-s007.doc

Supplementary Fig. 4

Bland-Altman plot for comparing inter-observer variability of GLS measurement.
jkms-35-e366-s008.doc
TOOLS
Similar articles