

 PDF
PDF Citation
 Print
Print


INTRODUCTION
Research on small area–level health indicators is becoming increasingly widespread. As part of the Global Burden of Disease Study, researchers are working to identify hotspots with high burdens of disease in low- and middle-income countries, including those in Africa.1234 In the United States, life expectancy and mortality trends are reported on the level of census tracts, which are small areas that roughly correspond to neighborhoods.56 In the United Kingdom, the distribution of mortality indicators is also reported by electoral wards.78 In the Fair Society, Healthy Lives report issued by the government of England, life expectancy, and disease-free life expectancy were reported by small areas.9 Other high-income countries such as Australia, Canada, and the Netherlands also calculate health indicators by small area units.101112 In Korea, variation in mortality indicators by the smallest administrative units (Dong, Eup, and Myeon) has also been reported.131415
The magnitude of variation in health indicators by small area units tends to be larger than that of variation by larger area units, such as districts. Therefore, the distribution of health outcomes across small area units is highly illustrative of patterns of health inequalities within a district or region. Moreover, small area–level distributions provide useful information for determining priority areas for public health policies and programs by enabling policy-makers to identify vulnerable areas with poor health outcomes within a district.
However, when reporting health inequalities, the possibility of stigmatizing certain local areas increases as the unit of geographical analysis becomes smaller. Conscious of this possibility, researchers have utilized subway stations as geographical reference points. For instance, Cheshire reported life expectancy for various stations of the London Tube.16 In the United States, researchers have also reported life expectancy for cities organized according to transportation landmarks (https://www.rwjf.org/en/library/infographics/minneapolis-map.html). Discrepancies in life expectancy by subway station (or other transportation landmarks) provide valuable information for raising awareness about health inequalities. Michael Marmot,17 in his book Health Gap, described differences in health outcomes by exploring differences in life expectancy across stations of the London Tube in the United Kingdom and the Washington Metro in the United States. Due to rapid urbanization, most of the population in major high-income countries resides in urban settings, and a large proportion of these residents utilize subway systems. Therefore, information on differences in life expectancy by subway stations may be a way of communicating findings to the public in a more familiar and accessible manner than is possible using other geographical classifications, such as census tracts and zip codes.
This study aimed to present life expectancy in the areas around 614 subway stations in the greater Seoul metropolitan area using mortality metrics from Dong, Eup, and Myeon.
METHODS
Data and unit of analysis
This study used data from 2008 to 2017 in the National Health Information Database (NHID). The NHID is operated and managed by the National Health Insurance Service, the single, publicly funded health insurance system for all Korean citizens, and contains information on all citizens who are enrolled in national health insurance.18 Using the NHID eligibility database, mortality in the past 12 months on December 31 of each year from 2008 to 2017 was extracted by the smallest administrative unit, sex, and age group in 5-year intervals (0, 1–4, 5–9, …, 80–84, 85+).
The unit of analysis in this study was the subway station. Of the 24 subway lines in the Seoul metropolitan area as of January 2020, 23 subway lines and 614 stations were included in the study, with the sole exclusion of a line for magnetic levitation trains. After converting the addresses of subway stations into coordinates, the smallest administrative units within a 200-m radius of each station was assigned as the area of that station, as illustrated in Fig. 1.16 If the station was a transfer station with multiple addresses, the smallest administrative units within a 200-m radius of each location were merged together as the area of the station. For example, lines 2, 4, and 5 intersect at the Dongdaemun History & Culture Park station, and the station address for each line is different. In this case, the administrative units within a 200-m radius of each station address were jointly classified as the area of the Dongdaemun History & Culture Park station.
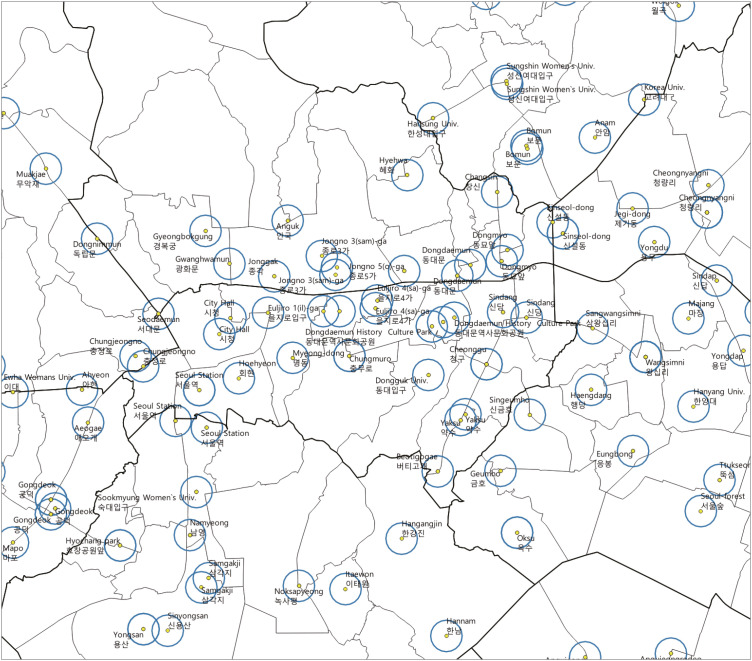
Fig. 1
The process of selecting small administrative units (dong, eup, and myeon) within a 200-m radius (blue circles) of subway stations (yellow dots).
Notes. Dong corresponds to metropolitan, Eup to urban, and Myeon to rural.
The total population and number of deaths by sex, age group, and subway station were calculated using the information on small administrative units from 2008 to 2017. In the case of Seoul, most of the information was used as 348 out of the total 420 small-areas belonged within a 200-m radius of the subway station. Data from 673 small-areas (62.2%) out of the total 1,082 small-areas were used in the case of further including Gyeonggi-do and Incheon.
Statistical analysis
Life expectancy was calculated by constructing an abridged life table using the number of population and deaths by subway station and 5-year age group.19 The adjustment coefficient was one-half of the range of the age group for all except the oldest (85 and older) group, in which the adjustment coefficient was the inverse of the mortality rate. The mortality rate was calculated using the total population and number of deaths by age group, and the probability of death and survival was calculated using adjustment coefficients and mortality rates.

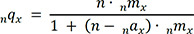
Where nmx is the mortality rate from age x to x+n, nNx refers to the total population in the age group, nDx denotes the number of deaths in the age group, nqx indicates the probability of death in the age group, nax is the adjustment coefficient for the age group, and npx is the probability of survival in the age group.
The number of people left alive at age x (100,000 at age 0), the number of deaths in the time interval, the person-years lived in the time interval, and life expectancy at age 0 were calculated using the probability of survival in each age category. The following formulas were used to derive life expectancy:
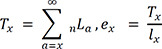
Where, lx is the number of people left alive at age x, ndx denotes the number of deaths in the time interval, nLx indicates the person-years lived from age x to x+n, Tx is the total number of years lived from age x, and ex is the life expectancy at age x.
When the number of deaths in a certain age group for the area around a subway station was 0, the number was not replaced.2021 There was no subway station where the number of deaths was 0 in the age group of 85 and above. The 95% confidence intervals (CIs) of life expectancy were calculated through a Monte Carlo simulation using the probability of death in each age group.2223 It was assumed that death incidence followed a binomial distribution.20 In total, 10,000 simulated probabilities were generated for each age group, and the average of the simulated probabilities was presented as the life expectancy for each subway station, using the 2.5th percentile as the lower limit and the 97.5th percentile as the upper limit of the 95% CI.13 In this study, we used the statistical software R 3.6.3 (https://www.r-project.org) and QGIS 3.12.1 (https://www.qgis.org) for the analysis.
RESULTS
Based on the 2008–2017 NHID data, the median total population in the areas around the 614 subway stations in the Seoul metropolitan area was 547,093, with an interquartile range of 461,227, a minimum of 25,119, and a maximum of 4,565,877. The median number of deaths was 2,030, with an interquartile range of 1,765, a minimum of 236, and a maximum of 19,670.
Fig. 2 presents the distribution of life expectancy in the areas around the 614 subway stations. The median life expectancy was 82.9 years, which was found in the area around the Sinimun station (line 1) and 14 other stations, and was 1.0 year higher than the average life expectancy of 81.9 years in the entire sample over the same period. The interquartile range was 2.2 years (25th percentile: 81.8 years; 75th percentile: 84.0 years). The lowest life expectancy (77.6 years) was found around the Dongducheon station and Soyosan station on line 1, and the highest life expectancy (87.4 years) was found around the Sunae station on Bundang line. The difference between the highest and lowest life expectancies was 9.8 years.
Fig. 2
Histogram of life expectancy in the areas around subway stations in the Seoul metropolitan area: findings from the National Health Information Database, 2008–2017.
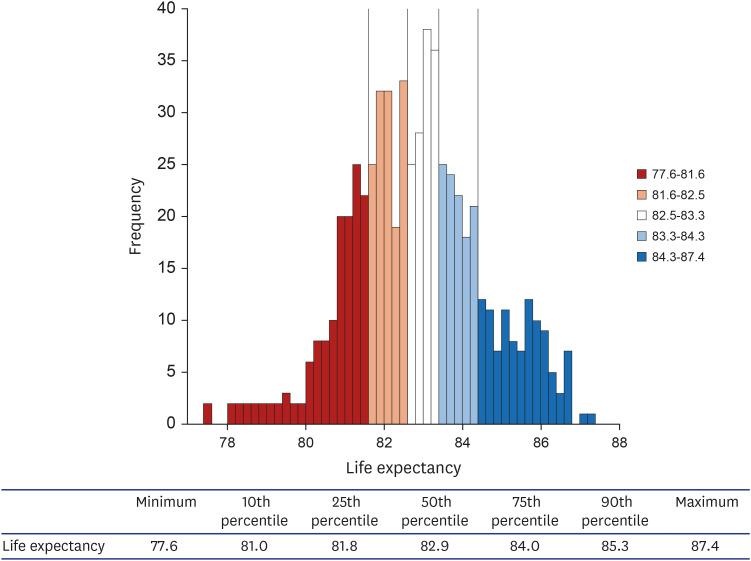
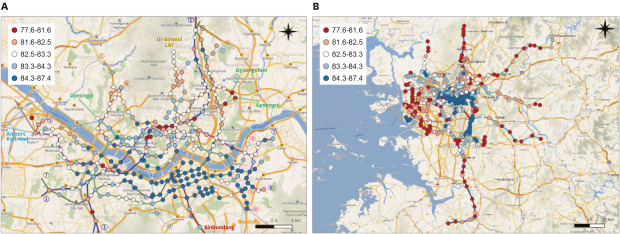
Fig. 3 illustrates life expectancy quintiles by subway station on a map. Fig. 3A shows Seoul, and high life expectancies can be observed in areas around the subway stations in the southeastern areas, Yeouido, Mok-dong, and the Han riverside area. Meanwhile, lower life expectancies were found extending from the Seoul station to the Cheongnyangni station and the Gasan Digital Complex station to the Geumcheon-gu Office station along line 1, as well as in some areas north and west of the Han River. A pattern of adjacent subway stations with large discrepancies in life expectancy was found. For example, the City Hall station, which is a transfer station between lines 1 and 2, had a life expectancy of 84.5 years, which was 3.5 years higher than the life expectancy of 81.0 years found for the Jongno 3-ga station, the adjacent transfer station between lines 1 and 3. The difference in life expectancy between the Singil station (82.2 years) and the Yeouido station (86.8 years) was especially large, at 4.6 years.
Fig. 3
Life expectancy in the areas around subway stations in the Seoul metropolitan area: findings from the National Health Information Database, 2008–2017. (A) Life expectancy around subway stations in Seoul. (B) Life expectancy around subway stations in the Seoul metropolitan area.
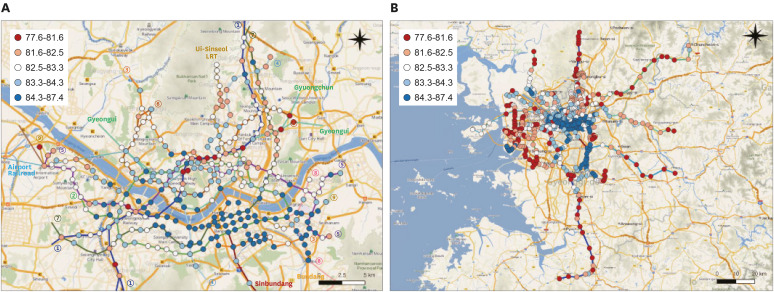
Fig. 3B shows the entire metropolitan area. Compared to Seoul, the outskirts of Incheon and Gyeonggi-do had relatively low life expectancies. Within Incheon, Yeonsu-gu, through which the Incheon line passes, had a higher life expectancy than other regions in Incheon. In Gyeonggi-do, Bundang-gu in Seongnam and Suji-gu and Giheung-gu in Yongin, through which the Bundang line, Shinbundang line, and EverLine pass, generally had higher life expectancies than other regions. Gwacheon and Dongan-gu in Anyang, and Gunpo (through which line 4 passes) and Ilsanseo-gu and Ilsandong-gu (through which line 3 and the Gyeungui line pass) demonstrated relatively high life expectancies. The life expectancy in the areas around 614 stations along 23 lines is presented in Supplementary Table 1.
A webpage was developed to visualize the life expectancy information by subway station (http://lives.subwaystation.kr). On this webpage, the life expectancy information is shown by subway line, and then the user can click on individual subway stations to see more granular data.
DISCUSSION
This study calculated life expectancy in the areas around 614 subway stations in the Seoul metropolitan area using data from the NHID from 2008 to 2017. The median life expectancy was 82.9 years, the maximum life expectancy was 87.4 years, and the minimum life expectancy was 77.6 years, meaning that the difference between the maximum and minimum life expectancies was 9.8 years. In Seoul, higher life expectancies were found around subway stations south of the Han River, in Yeouido and Mok-dong, and along the Han riverside area, while the life expectancy was lower in stations in midtown Seoul and north and west of the Han River. In some instances, adjacent stations showed large differences in life expectancy. Overall, Seoul had a higher life expectancy than Incheon and Gyeonggi-do. Within Incheon and Gyeonggi-do, variations in life expectancy by subway stations were found.
It is important to understand variation in health outcomes by geographic location in order to identify the socioecological determinants of health and to establish evidence-based policies. Extant research on regional discrepancies of health outcomes has primarily focused on differences between urban and rural areas or between cities in different regions or countries. However, relatively few studies have examined small area-level differences in a single region,2425 although some studies based in Korea have attempted to calculate health outcomes by the smallest administrative units.141526 Unlike those previous studies, this study selected subway stations as the unit of analysis in order to reduce the possibility of stigmatization that arises when administrative units are used as the unit of analysis.27 Moreover, in contrast to existing studies that used standardized mortality ratio as mortality metric, this study used life expectancy as an outcome. It is anticipated to be helpful for members of the general public and policymakers, as well as researchers, to understand differences in health outcomes in a straightforward manner.2228 Moreover, the webpage developed as part of this study provides life expectancy information by the subway line and can be utilized by the general public, thereby helping to raise awareness about health inequalities.
Various factors determine the health outcomes of specific geographical areas.29 Previous studies have presented a wide range of contextual and compositional factors at the individual, regional, and national levels.253031 In this study, compared to Incheon and Gyeonggi-do, the life expectancy near the subway stations located in Seoul was relatively higher. Even within Seoul, there was a large gap in life expectancy between areas. High life expectancy was observed in areas with high ground rent such as southeastern part of the Seoul (Gangnam area), Yeouido, and Mok-dong. In the case of Incheon and Gyeonggi-do, the life expectancies of subway stations located in areas newly developed such as Ilsan, Yongin, Bundang, and Song-do were higher than that of other subway stations. These results imply that socioeconomic factors can largely explain the spatial patterning of mortality levels in the Seoul metropolitan area. In deciding where to live, there is an evident tendency to spatial pattern according to socioeconomic position, and ground rent plays a mediating role.32 The subway station used in this study as a unit of analysis also works as a factor to increase the area's ground rent.32 In the Gangnam area and newly developed area which imitates it, people with high socioeconomic position reside due to the excellence of educational conditions, the increase of real estate value, the convenience of transportation, and the development of consumption and culture facilities.333435 This region is not only excellent in the built environment but also showed protective health behaviors and social norms.3637 Considering the health gap according to the socioeconomic position that exists in Korea,3839 we suppose that the affinity of the population with high socioeconomic position and the urban development could jointly explain the spatial patterning of areal mortality level. Additional studies seeking to identify factors that explain the discrepancies in health outcomes across small administrative units in Korea are warranted.
This study has some limitations that should be noted. First, a relatively long period (10 years) was set as the study period. When calculating life expectancy in areas with a small population, several methods are available to obtain stable results, one of which is to combine results from multiple years. Although this method has the benefit of producing stable calculations, it is not sensitive for detecting longitudinal changes. Second, when obtaining the total population and number of deaths, no distinction was made between institutionalized and non-institutionalized individuals, even though institutionalization can influence the estimation of health outcomes (including the mortality rate) in small geographic units.40 Therefore if there are social welfare facilities or nursing homes in a certain area, worse health outcomes may be estimated relative to the actual level of health in the community. Third, the magnitude of the variation in life expectancy has decreased compared to that estimated when the administrative unit used as a unit of analysis directly because this study used the average life expectancy of the area around 200 m around the subway station. The median life expectancy using each subway station as an analysis unit in the Seoul metropolitan area was 82.9 years old, and the range was 9.8 years old (range, 77.6–87.4 years old). During the same period, the median life expectancy of each small area in the Seoul metropolitan area was 82.5 years old, and the range was 13.5 years old (range, 74.9–88.4 years old).
This study presents life expectancy in the areas around 614 subway stations in the Seoul metropolitan area using data from the NHID from 2008 to 2017. Variations in life expectancy across the subway stations were observed, and large differences in life expectancy between adjacent small areas were found. These findings are significant in that health outcomes by small administrative units in Korea were estimated using life expectancy, making it possible for policymakers and the general public—not only researchers—to understand the results in a straightforward manner. Moreover, by selecting subway stations as the unit of analysis, the study attempted to minimize the possibility of stigmatization on residents in specific administrative areas. The results of this study provide a more precise estimation of small area–level health outcomes that can serve as evidence for policy-making or public awareness initiatives. Future studies should investigate health outcomes by the smallest administrative units in Korea and identify determinants of health inequalities across small area units.
 XML Download