

 PDF
PDF Citation
 Print
Print


INTRODUCTION
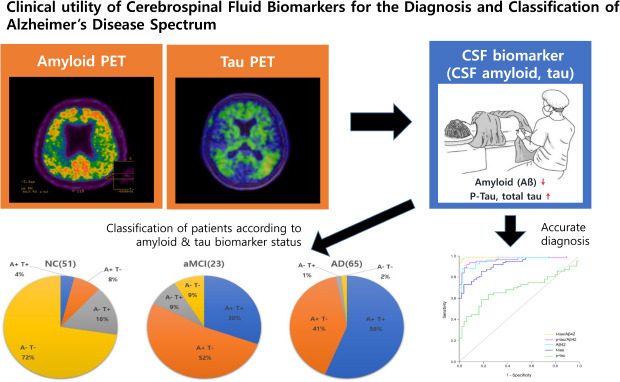
Alzheimer's disease (AD), which is characterized by pathological hallmarks of β-amyloid (Aβ) and neurofibrillary tau tangles, is a continuum disorder largely with three different clinical stages: normal cognition (NC, or preclinical), mild cognitive impairment (MCI, or prodromal), and dementia.123 Since previous diagnostic criteria for AD were based mainly on clinical manifestations rather than on biomarkers, early diagnosis for preclinical or prodromal AD was difficult. However, advances in AD biomarker development using positron emission tomography (PET) or cerebrospinal fluid (CSF) have enabled in vivo identification of pathologies, and therefore early diagnosis of patients even in the preclinical or prodromal stages has become possible. More recent research criteria for AD proposed by the National Institute on Aging and Alzheimer's Association (NIA-AA) task force incorporated both Aβ phenotyping and clinical status to characterize patients.345 Further, a new research framework using a multiple-biomarker-based definition of AD in living patients was recently proposed67; it included biomarkers for Aβ (A), pathologic tau (T), and neurodegenerative/neuronal injury (N), called the ATN (amyloid/tau/neurodegeneration) system.4
Individuals with preclinical AD or prodromal AD show changes in CSF amyloid. Specifically, a decreased level of β-amyloid 1-42 (Aβ42) and increased level of total tau (t-tau) and phosphorylated tau (p-tau) in CSF are useful for the early diagnosis of AD.8 CSF biomarkers may have several advantages over amyloid PET. First, CSF tests are less expensive and more accessible and have no radiation exposure issue compared to amyloid PET. Second, prior studies showed that changes in CSF Aβ42 precede amyloid PET uptakes,910 suggesting that CSF biomarkers may be more sensitive in identifying individuals with preclinical AD. Third, the most noteworthy benefit of CSF biomarkers is that CSF gives more information about AD-related pathologies than does amyloid PET. That is, CSF biomarkers provide not only amyloid status (disease marker) but also information on the tau pathology biomarker (phosphorylated tau) and neurodegenerative marker (total tau) as well.11 Finally, as novel biomarkers such as neurofilament or neurogranin are being developed,121314 one lumbar puncture can provide a variety of information encompassing AD pathology or other neurodegeneration in the future.
One issue with CSF biomarkers, however, is that there exists variability in cutoff values between laboratories. It is therefore necessary to develop laboratory-specific cutoff values to enable application of these values in clinical judgement. In line with this need, a recent study using multicenter CSF data from Korea reported new cutoff levels of CSF AD biomarkers and compared them with those from Western studies.15 However, this study included participants based on clinical diagnosis only; investigating the concordance between CSF and PET positivity or accuracy of CSF biomarkers for detecting amyloid pathology was unavailable. Besides, the cutoff values developed in this study were intended to differentiate ADD from other neurodegenerative disorder. Considering that other neurodegenerative disorders may have concomitant amyloid pathology, developed cutoff values might not be pathology specific.
Therefore, in this study, we first investigated CSF biomarkers across three different cognitive groups (NC, MCI, and AD dementia [ADD]) in a single large center in Korea in order to establish cutoff values of CSF biomarkers that could differentiate ADD from NC. Second, we observed the concordance of CSF biomarkers and amyloid PET results to confirm the reliability of CSF biomarkers. Finally, we attempted to apply the ATN biomarker classification system to our patients based on CSF biomarker cutoffs derived from our study, which would have clinical implications, in that both amyloid and tau information rather than amyloid alone can provide more accurate prediction of patients' prognoses.
Go to : 
METHODS
Study participants
In this study, we included a total of 400 participants who had undergone CSF analysis at the Samsung Medical Center, Seoul, Korea, from February 2011 to July 2019. Participants received a detailed dementia evaluation, including clinical history, neurologic examination, neuropsychological tests, blood tests to exclude secondary causes of dementia, brain magnetic resonance imaging (MRI), and amyloid PET and APOE genotyping. Out of the initial 400 participants, we included only individuals with NC, amnestic MCI (aMCI), or ADD; we excluded 224 patients with other diagnoses, such as normal pressure hydrocephalus (NPH), subcortical vascular cognitive impairment (SVCI, cognitive impairment associated with severe deep white matter hyperintensities [WMH], which was defined as a deep WMH lesion ≥ 25 mm and periventricular WMH lesion ≥ 10 mm), neurodegenerative disorders with parkinsonism, traumatic brain injury, frontotemporal dementias, brain tumor, neurosyphilis, CO poisoning, epilepsy, autoimmune encephalitis, or Creutzfeldt-Jakob disease. When ADD, aMCI, or NC participants showed a gait disturbance and an Evan's ratio over 3.0 on MRI, they were referred to as ADD, aMCI, or NC with “combined hydrocephalus” and excluded from this study (n = 37).
ADD was clinically diagnosed when patients met the diagnostic criteria for probable ADD according to NIA-AA criteria, with cognitive impairment, such as memory loss, word-finding difficulties, or visual/spatial problems significant enough to impair a person's ability to function independently.16 AMCI was diagnosed according to Peterson's MCI criteria,17 which was characterized by memory complaints usually corroborated by an informant, objective memory impairment for age, essentially preserved general cognitive function, and largely intact functional activities. We recruited NC participants from our memory or headache clinic or orthopedic surgery department, where they received spinal anesthesia. All the NC individuals met the following criteria: no history of neurological or psychiatric disorders, normal cognitive function, normal activities of daily living with or without subjective memory complaints, and normal CSF cell count.
CSF collection and AD biomarker analysis
For most participants, CSF samples were collected from a lumbar puncture done in the L3-4 or L4-5 intervertebral spaces using a 20 or 22G needle. Fasting was not required. A subset of 28 AD and 12 aMCI patients had Ommaya reservoir insertion for a clinical trial of intraventricular stem-cell injection, ‘Safety and Exploratory Efficacy Study of NEUROSTEM® Versus Placebo in Patients with Alzheimer's Disease (ClinicalTrials.gov Identifier: NCT02054208)’18 and the CSF obtained from the Ommaya reservoir before stem-cell injection was used for the current study. All CSF samples were collected into 15-mL polypropylene tubes at the time of the tap and were then sent to Samsung Medical Center laboratory within 30 minutes after collection. After samples were centrifuged at 2000 g for 10 minutes within 4 hours after collection, aliquots (1 mL) prepared from these samples at room temperature were immediately stored in bar-code-labeled polypropylene vials at −70°C.19 In our laboratory, we run assays for CSF biomarkers once CSF samples are collected from 30 to 40 patients, using INNOTEST enzyme-linked immunosorbent assay (ELISA) kits (Fujirebio Europe N.V.). The CSF biomarkers included levels of Aβ42 (Amyloid-β (1–42)), t-tau, and p-tau (181 phosphorylated tau).
Aβ PET acquisition and definition of Aβ positivity
A total of 90 patients underwent Aβ PET (PiB, n = 5; florbetaben, n = 80; flutemetamol, n = 5). For 11C-PiB PET, a 30-minute emission static PET scan was done 60 minutes after bolus injection of a mean dose of 420 MBq 11C-PiB into an antecubital vein. For 18F-florbetaben PET, a 20-minute emission PET scan in dynamic mode (consisting of 4 × 5 min frames) was done 90 minutes after bolus injection of a mean dose of 381 MBq 18F-florbetaben into an antecubital vein. For flutemetamol PET, a 20-minute emission static PET scan in dynamic mode (consisting of 4 x 5 min frames) was done 90 minutes after bolus injection of a mean dose of 185 MBq flutemetamol into an antecubital vein.
We defined Aβ PET positivity (PET+) for the three different types of PET images as follows: 1) Global PiB SUVR (assessed from the volume-weighted average SUVR of 28 bilateral cerebral cortical VOIs) of greater than 1.5 as described in our previous study,20 2) visual rating score on florbetaben PET of 2 or 3 on the brain Aβ plaque load scoring system,21 3) positive visual interpretation of 18F-flutemetamol PET in any one of the five brain regions (frontal, parietal, posterior cingulate and precuneus, striatum, and lateral temporal lobes) in either hemisphere.22
Statistical analyses
We used ANOVA (Analysis of Variance) to compare clinical characteristics between NC, aMCI and ADD, and ANCOVA (Analysis of Covariates) to compare CSF biomarker levels with adjustment of age. We used paired t-tests to compare CSF biomarker levels between each of the two groups.
We did receiver operating characteristic (ROC) analyses to establish the cutoffs for each CSF biomarker (Aβ42, t-tau, p-tau) and ratio (t-tau/ Aβ42, p-tau/ Aβ42) that best differentiated clinical ADD from NC. The cutoffs for biomarkers were defined as values that give the maximum Youden index (sensitivity + specificity − 1). We then calculated the sensitivity and specificity for each cutoff value. We additionally compared AUC of all models using Delong method.
We defined CSF biomarker levels as abnormal (CSF+) when CSF Aβ42 was lower than cutoff values. Therefore, the concordance rate of amyloid PET and CSF biomarker results was calculated as the number of CSF+/PET+ plus CSF-/PET- cases over the total number of participants in the analysis. All statistical tests were conducted using the SPSS version 22 (SPSS, Inc., Chicago, IL) and STATA version 15 (StataCorp LLC).
Ethics statement
We obtained written informed consent for obtaining CSF data from each patient, and this study was approved by the Institutional Review Board at the Samsung Medical Center (2010-12-003 & 2015-06-093-001).
Go to :
RESULTS
Demographics and clinical characteristics of study participants
Table 1 shows the clinical characteristics and CSF biomarker levels of the study participants. The mean age (P = 0.205) and education year (P = 0.881) were not significantly different across groups. The proportion of female was different across groups (P = 0.025), being highest at 82% in NC, followed by 61% in aMCI and 60% in ADD. The frequency of APOE4 carriers was higher in aMCI (15/22, 67%) and ADD (52/92, 55%) than in NC (1/6, 16%), although the difference was not statistically significant (P = 0.096). The frequency of amyloid PET positivity was different across groups (P < 0.001) with 78% in aMCI and 94% in ADD, and two NC participants who underwent amyloid PET tested negative.
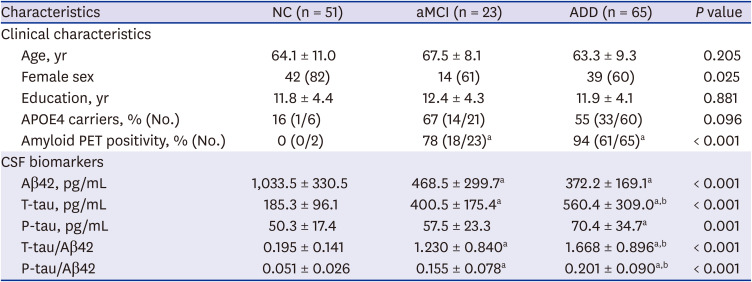
Table 1
Demographics and clinical characteristics of the study participants (n = 139)
Values are represented as mean ± standard deviation or number (%) unless otherwise indicated.
NC = normal control, aMCI = amnestic mild cognitive impairment, ADD = Alzheimer's disease dementia, APOE4 = apolipoprotein E4 gene, PET = positron emission tomography, CSF = cerebrospinal fluid, Aβ42 = beta amyloid 1-42, T-tau = total tau, P-tau = phosphorylated tau.
aP < 0.05 compared to NC; bP < 0.05 compared to aMCI.
![]()
Levels of CSF biomarkers in different cognitive groups
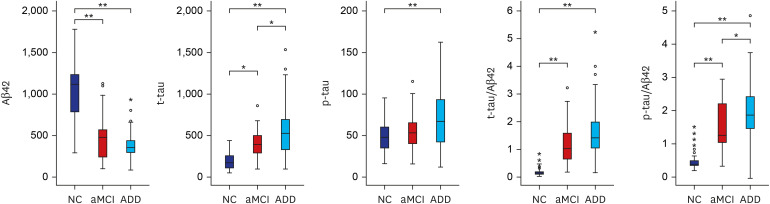
CSF biomarkers levels (Aβ42 [pg/mL], t-tau [pg/mL], p-tau [pg/mL], t-tau/Aβ42, p-tau/Aβ42) in the three diagnostic groups are shown in Table 1 and Fig. 1. CSF Aβ42 levels were 1033.5 ± 330.5, 400.5 ± 175.4, and 372.2 ± 169.1 pg/mL in NC, aMCI, and ADD, respectively (ANCOVA, P < 0.001). CSF t-tau levels were 185.3 ± 96.1, 391.0 ± 177.9, and 507.0 ± 348.5 (ANCOVA, P < 0.001), and CSF p-tau levels were 50.3 ± 17.4, 57.1 ± 22.8, and 65.0 ± 39.9 in NC, aMCI and ADD (ANCOVA, P = 0.001), respectively. CSF t-tau/Aβ42 ratios were 1.668 ± 0.896, 1.230 ± 0.840, and 0.195 ± 0.141 (ANCOVA, P < 0.001), and CSF p-tau/Aβ42 ratios were 0.201 ± 0.090, 0.155 ± 0.078, and 0.051 ± 0.026 in NC, aMCI, and ADD (ANCOVA, P < 0.001). All biomarkers were significantly different between the three groups, even after controlling for age. Post hoc analysis of paired t-tests showed that Aβ42 was different between NC vs. aMCI (P < 0.001) and NC vs. ADD (P < 0.001) groups, but it was not significantly different between ADD and aMCI (P = 0.391). However, t-tau, t-tau/Aβ42, and p-tau/Aβ42 showed differences between NC vs. aMCI, NC vs. ADD, and aMCI vs. ADD, whereas p-tau differed only between NC and ADD (P = 0.001).
Cutoff values of CSF AD biomarkers
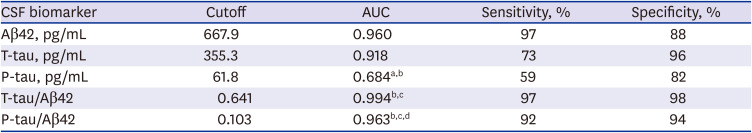
Table 2 shows the ROC curve-derived cutoff values of the CSF biomarkers that best distinguished ADD from NC. T-tau/Aβ42 showed the highest AUC (0.994) followed by p-tau/Aβ42 (0.963), Aβ42 (0.960), and t-tau (0.918). In contrast, p-tau alone showed a low AUC of 0.684 (Fig. 2). The cutoff values were 667.91 pg/mL (Sensitivity [Sn] 88%, Specificity [Sp] 97%) for Aβ42, 355.27 pg/mL (Sn 73%, Sp 96%) for t-tau, 61.82 pg/mL (Sn 59%, Sp 82%) for p-tau, 0.641 (Sn 97%, Sp 98%) for t-tau/ Aβ42, and 0.103 (Sn 92%, Sp 94%) for p-tau/Aβ42. When we compared the AUC between models, the AUC for p-tau was lower than others (P < 0.001), and the AUC for Aβ42 model did not differ from other models except for p-tau model. Among the three models, the AUC for t-tau/Aβ42 was significantly higher than those of p-tau/Aβ42 (P = 0.032) and t-tau (P < 0.001), and the AUC for p-tau/Aβ42 was higher than that of t-tau (P = 0.048).
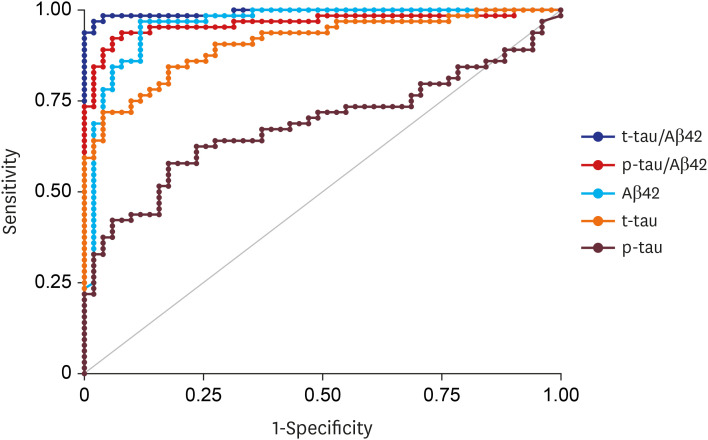 | Fig. 2ROC curves of CSF biomarkers for discrimination between NC and ADD.ROC = receiver operating characteristic, CSF = cerebrospinal fluid, NC = normal control, ADD = Alzheimer's disease dementia, Aβ42 = beta amyloid 1-42, t-tau = total tau, p-tau = phosphorylated tau.
|
Table 2
CSF biomarker cutoff values that best discriminate ADD from NC
CSF = cerebrospinal fluid, ADD = Alzheimer's disease dementia, NC = normal control, AUC = area under curve, Aβ42 = beta amyloid 1-42, T-tau = total tau, P-tau = phosphorylated tau.
aP <0.05 compared to AUC of the model for Aβ42; bP <0.05 compared to AUC of the model for T-tau; cP <0.05 compared to AUC of the model for P-tau; dP <0.05 compared to AUC of the model for T-tau/Aβ42.
![]()
Concordance of CSF Aβ biomarker and amyloid PET
We further investigated the concordance of amyloid PET results and CSF Aβ biomarker cutoff-based results. Among 90 participants who underwent amyloid PET, the number of CSF+PET+ and CSF-PET- cases were 77 and 6, which resulted in a 92% (83/90) concordance rate. Among the seven discordant cases for PET and CSF Aβ42, two were PET+/CSF- and five were PET-/CSF+. The clinical characteristics and CSF biomarker levels of the discordant cases are described in Table 3. Two PET+/CSF- cases were aMCI and ADD who showed CSF Aβ42 levels of 777.9 and 794.6. Among the five PET-/CSF+ cases, two were diagnosed as ADD when CSF tests were done but we changed the diagnosis to behavior variant frontotemporal dementia (bvFTD) when we followed them up with detailed history, MRI review, and the support from the negative amyloid PET scan. Another PET-/CSF+ patient was diagnosed with ADD at first but was found to have chronic subdural hemorrhage (SDH). Therefore, we conducted ROC analysis again after excluding these two bvFTD patients, and the cutoff of Aβ42 and the AUC remained the same (cutoff 667.9, AUC 0.959).
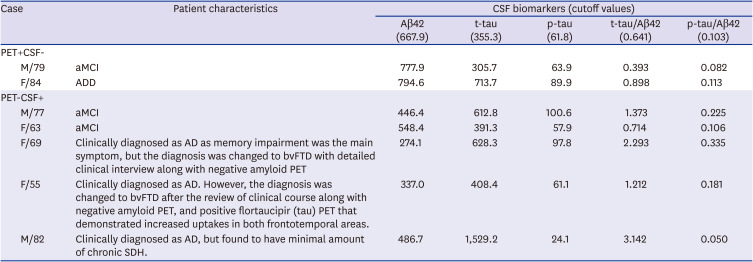
Table 3
PET-CSF discordant cases
aMCI = amnestic mild cognitive impairment, ADD = Alzheimer's disease dementia, APOE4 = apolipoprotein E4 gene, PET = positron emission tomography, CSF = cerebrospinal fluid, Aβ42 = beta amyloid 1-42, T-tau = total tau, P-tau = phosphorylated tau, bvFTD = behavioral variant frontotemporal dementia, SDH = subdural hemorrhage.
![]()
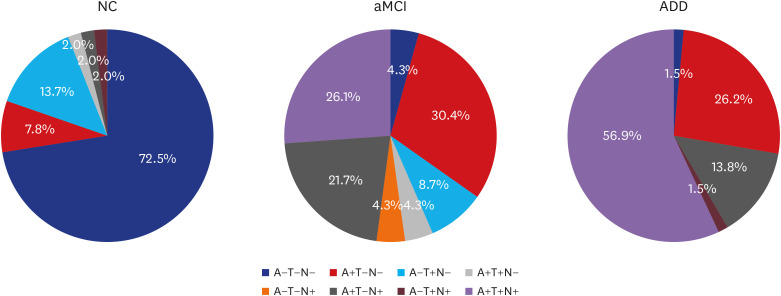
ATN biomarker classification using CSF AD biomarker cutoff
We used cutoffs of CSF Aβ42 (= 667.9), p-tau (= 61.8), and t-tau levels (= 355.3) to define abnormal Aβ (A+), abnormal tau (T+), and abnormal neurodegeneration (N+) to apply ATN biomarker classification in our study subjects. As shown in Fig. 3, a majority of NC was categorized into A-T-N- (73%), followed by A-T+N- (14%). A+T-N- and A+T+N+ occupied 30% and 26% of aMCI, followed by A+T-N+ (22%), and most ADD patients were categorized into A+T+N+ (57%), and subsequently into A+T-N- (26%) and A+T-N+ (14%).
Go to :
DISCUSSION
In this study, we recruited 139 participants and compared CSF biomarker levels across three groups with different cognition levels (NC, aMCI, and ADD) and developed CSF biomarker cutoffs to differentiate ADD from NC. We also tried to investigate the reliability and clinical utility of CSF biomarkers by investigating concordance rates between amyloid PET and CSF results. Our major findings were as follows. First, CSF biomarkers were significantly different between NC, aMCI and ADD groups. Second, the cutoff values we obtained were accurate in differentiating ADD from NC and were highly concordant with amyloid PET results. Third, whereas amyloid PET can only categorize patients into amyloid negative versus positive groups, CSF biomarkers can further categorize patients according to their amyloid and tau status. Taken together, we consider that CSF biomarkers are useful in clinical and research field.
The first major finding of our study was that CSF biomarkers were significantly different between the three diagnostic groups. CSF Aβ42 level was different between NC and aMCI or ADD. However, it was not different between aMCI and ADD, which may be in line with the fact that CSF Aβ42 levels change before neurodegeneration and cognitive impairment occurs, as has been explained by the sigmoid-shaped trajectory of CSF Aβ42 levels.9 Unlike CSF Aβ42, CSF t-tau, t-tau/Aβ42, and p-tau/Aβ42 ratios were significantly different between aMCI and ADD. These findings are also consistent with previous notions that CSF t-tau is a well-known marker for neurodegeneration.6 Therefore, we considered that a combination of tau and amyloid markers (such as the ratio of CSF t-tau/Aβ42 or CSF p-tau/Aβ42) could represent disease progression better than could an amyloid marker alone.
The second major finding of our study was that we were able to obtain cutoff values that showed high accuracy (represented as AUC) in differentiating clinical ADD from NC. Specifically, the AUC from t-tau/Aβ42 was highest (0.994), followed by those from p-tau/Aβ42 (0.963) and Aβ42 (0.960). Such high accuracy may be explained by the fact that we took extra caution when selecting patients by excluding patients with possible NPH and patients with severe WMH (patients with SVCI). In fact, recent studies showed that CSF Aβ42 levels can be decreased in pure NPH.232425 We compared our cutoffs with previously established cutoffs obtained from other memory clinics in Korea. As a result, our Aβ42 cutoff was comparable with Jung et al.'s (Aβ42 < 631.8, p-tau > 56.4, and t-tau > 271.6) and our t-tau cutoff was comparable with Park et al's (Aβ42 < 481.8, p-tau > 57.0, and t-tau > 326.0). However, all three groups showed different cutoff levels for each biomarker, which suggests that we need to establish ELISA cutoffs for Koreans through a multicenter study involving a large number of patients with amyloid PET information.
Unexpectedly, there was a discrepancy between the AUC from t-tau (0.918) and p-tau (0.684), a finding inconsistent with previous studies which state that CSF p-tau has been considered to be more closely related to neurofibrillary tangles pathologies than is to CSF t-tau.262728 However, CSF p-tau levels might change even in ADD according to the speed of progression.29 That is, unlike tau PET imaging showing accumulating tau pathology, CSF p-tau may not reflect the total amount of neurodegeneration that have occurred up to that point, but rather may be the marker of ongoing progression. Further studies to investigate longitudinal CSF p-tau change in AD are required. Alternatively, the NC group in our study might have included preclinical participants who had neurofibrillary tangles (restricted to Braak stage I/II or even involving III/IV stage regions), although they did not complain of any cognitive symptoms.
The third major finding was that, when we compared the results of CSF Aβ42 with those of amyloid PET, the concordance rate was as high as 92%. When we looked at discordant cases, CSF Aβ42 levels of two PET+CSF- patients were 777.9 and 794.6, which were higher than the cutoff values. One of these two patients had higher t-tau, p-tau, and their ratio with Aβ42 than cutoffs, therefore, a combination with the tau biomarker could be more accurate than is CSF Aβ42 alone for diagnosis of ADD. There were also five PET-CSF+ cases, among which two were aMCI cases as expected, because CSF biomarker changes occur prior to amyloid uptake on PET. One interesting case was an 82-year-old man who was diagnosed with ADD but had a markedly high t-tau level of 1,529.2, but a low p-tau of 24.1. When we reviewed his case later because of the exceptionally high t-tau levels, we found a minimal amount of chronic SDH on his CT image conducted before CSF tapping. Therefore, we need to reconsider a diagnosis in cases where t-tau levels are higher than the p-tau levels. It is also noteworthy that there are other conditions causing false positive CSF Aβ42 and t-tau results: CSF Aβ42 is reported to be decreased, albeit inconsistently, in frontotemporal dementia, vascular dementia, dementia of Lewy body,30 or in normal pressure hydrocephalus.31 CSF t-tau, which is a neuronal injury marker, can increase in various brain disorders such as stroke, trauma, and non-AD dementias, especially in rapidly progressing dementias such as Creutzfeldt-Jakob Disease.
Nevertheless, a high concordance between amyloid PET and CSF results in our study has a clinical implication, in that CSF biomarkers can be an alternative to amyloid PET in clinical practice, since CSF biomarkers are less expensive and more accessible than an amyloid PET scan in most clinical settings. Although lumbar puncture is invasive than amyloid PET and requires a bed rest, CSF study still has its strengths in that it can detect various neurodegenerative biomarkers simultaneously once CSF is sampled. As in our study, information on amyloid and tau can be obtained from a single CSF sample, unlike a PET scan that should be done separately to detect two different biomarkers. In addition, new CSF biomarkers, such as neurofilament or neurogranin, are increasingly considered as promising biomarkers, which suggests that the potential of new CSF biomarkers for a variety of neurodegenerative diseases may increase.
Finally, when we used our CSF cutoff values to apply ATN biomarker classification to study participants, most of the NC were A-T-N-, whereas most of the AD were A+T+N+, as expected. Interestingly, in the MCI group, the majority of patients was classified into either A+T-N- (30%) or A+T+N+ (26%), followed by A+T-N+ (22%). The percentages of these groups are largely comparable to those from a previous study.3233 Another feature that our study and a previous study had in common was that there was an A-T+(N-/N+) and A-T-(N-/N+) population in the MCI group, recapitulating the heterogeneity of MCI patients. In the era of molecular targeting treatment, delineating biomarker profiles in MCI patients may help clinicians to select the potential candidates by predicting different prognoses.
The strength of our study is that it was based on comprehensive and detailed clinical and imaging data from a single center, which probably minimized biases with homogeneous study protocols. On the other hand, there are limitations in our study. First, most of the NC did not undergo amyloid PET scans. Second, we used three different PET ligands requiring the use of different standards for amyloid positivity. However, previous studies confirmed that PiB PET uptake highly correlates with the uptakes of three 18F ligands PET (florbetapir, FMM and FBB),34 and FMM and FBB uptakes were highly correlated with each other as well35 Third, we had 40 participants who had CSF taken from the Omaya reservoir, but others had it taken by lumbar puncture, which disturbs the homogeneity of a single-center study. Finally, one ADD patient was proven to have SDH before CSF drainage, which could disturb CSF results that were shown as a PET-CSF discordant case. Despite these limitations, considering that every center and country needs their own cutoff values, we hope that the cutoff values derived from a single center of a large memory clinic may be useful in research and clinical fields.
Go to :
 XML Download