

 PDF
PDF Citation
 Print
Print


INTRODUCTION
Serum prostate specific antigen (PSA) and digital rectal examination (DRE) are widely used for prostate cancer (PCa) screening. These examinations are suitable for screening because they are easy to perform and are inexpensive. However, in early stage PCa, the detection rate by DRE is very low, and the optimal PSA cut-off value has not yet been established.1 PSA has traditionally recommended biopsy at > 4 ng/mL.2 On the other hand, many studies have reported that the traditional PSA cut-off (> 4 ng/mL) value is too high, and significant PCa have been detected even at a PSA level less than 4 ng/mL. For the first time, Littrup et al.3 reported that the PSA cut-off value should be reduced to 3.0 ng/mL. Thereafter, many studies have reported that the PSA cut-off level should be reduced to 2.5 ng/mL.45 In particular, Kim et al.,6 reported that the detection rate of PCa and significant PCa was not different between PSA levels of 2.5–4.0 ng/mL and 4.0–10.0 ng/mL. Prostate cancer is detected at a rate of about 26% in American men with PSA levels between 2.5 and 4.0 ng/mL.7 Moreover, Kobayashi et al.8 reported a cancer detection rate of 23.6% for Japanese men with PSA levels between 2.0 and 4.0 ng/mL.
However, There are no previous studies evaluating the characteristics of patients with PCa who have PSA level less than 4.0 ng/mL (≥ 2.5 ng/mL). The efficiency of detection for prostate cancer in the patients with PSA between 2.5–4.0 ng/mL will be improved when their oncological parameters, including baseline characteristics, prostate cancer incidence and pathologic outcomes, are evaluated.
In this study, patients who had underwent prostate biopsy for PCa and presented a 2.5 to 4.0 ng/mL PSA were evaluated. We evaluated the risk of low PSA PCa and a strategy for screening of low-PSA patients.
Go to : 
METHODS
Patients
From January 2008 to December 2018, we retrospectively analyzed 2,204 patients who underwent prostate biopsy at a single center with PSA level of 2.5 ng/mL to less than 4.0 ng/mL. Patients were excluded from the study if they had a history of PSA greater than 4.0 ng/mL, had previously undergone prostate surgery such as transurethral prostate resection, or had received 5-alpha reductase inhibitors.
Clinicopathological parameters
To evaluate the baseline characteristics, age at prostate biopsy, body mass index, hypertension (HTN), diabetes mellitus (DM), serum PSA level before prostate biopsy, prostate volume (measured by transrectal ultrasonography or magnetic resonance imaging [MRI]), prostate specific antigen (PSAD), and history of prostate biopsy were evaluated. For analysis of needle biopsy specimens, we evaluated the positive core ratio of all biopsy cores, the largest tumor area among needle biopsies, and the Gleason score. The pathologic results of prostate specimen, the presence of significant cancer, and Gleason score upgrading ratio were also assessed in the patients who underwent radical prostatectomy. In addition, the correlation between PSAD and PCa and the cut-off value of PSAD were evaluated.
Classification
The biopsy results were classified into very low- or low-risk and intermediate- or high-risk groups (≥ T2b-T2c or ≥ Gleason score 3 + 4, PSA ≥ 10 ng/mL or percentage of positive biopsy cores ≥ 50%) according to the National Comprehensive Cancer Network classification (Reference, National Comprehensive Cancer Network classification, NCCN guidelines Version 4.2018 prostate cancer). Patients who underwent RP were classified as having significant cancer (tumor volume greater than 0.5 cm3 or ≥ Gleason score 3 + 4 or positive extracapsular extension) based on the results of pathology reports.9
Statistical analysis
The groups were compared using the χ2 test for categorical variables and Student's t-test for continuous variables. Pearson correlation was performed to evaluate the association between PSAD and PCa. Statistical analyses were carried out with SPSS® (version 21.0), and all two-sided P < 0.05 were considered statistically significant.
Ethics statement
The study was performed in agreement with applicable laws and regulations, good clinical practices, and ethical principles as described in the Declaration of Helsinki. The Institutional Review Boards of the Samsung Medical Center approved the present study (approval No. 2019-06-138). Informed consent was waived by the board.
Go to :
RESULTS
Patients who had underwent prostate biopsy
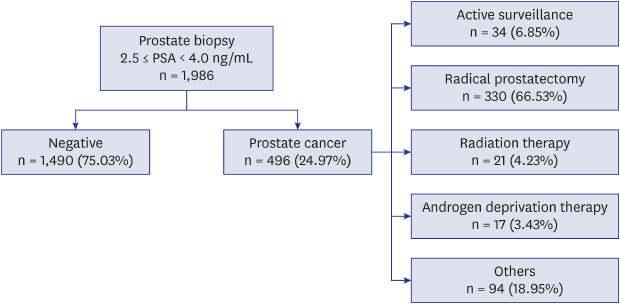
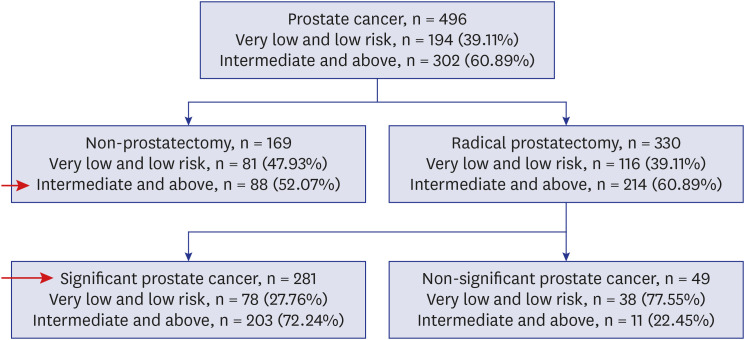
Of the total 2,204 patients, 1,986 were enrolled in this study after patients based on exclusion criteria. Among 1,986 patients, 496 (24.97%) were diagnosed with prostate cancer. Of these, 34 patients (6.85%) underwent active surveillance, and 330 patients (66.53%) underwent radical prostatectomy. Ninety-four patients (18.95%) received focal treatment or were lost during follow-up (Fig. 1).

The mean age of patients diagnosed with PCa was 64.48 ± 7.88 years, and the mean age of patients without PCa was 61.19 ± 8.69 years (P < 0.001). The prevalence of HTN and DM was 37.50% and 18.95% in the PCa-diagnosed group, respectively, and 23.96% and 14.30% in non-cancer-diagnosed group (P < 0.001, P = 0.013). PSAD was 0.12 ± 0.04 ng/mL2 in the PCa-diagnosed group and 0.10 ± 0.04 ng/mL2 in the non-cancer-diagnosed group (P < 0.001) (Table 1).
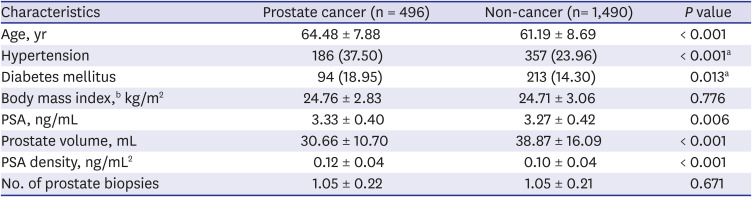
Table 1
Baseline characteristics of prostate biopsy patients
Data are presented as mean ± standard deviation or number (%).
PSA = prostate specific antigen.
Student's t-test, aχ2 test; bBody mass index: prostate cancer (n = 466), non-cancer (n = 1,027).
![]()
Prostate cancer population
Of the 496 patients diagnosed with PCa, 302 (60.89%) were in the intermediate- or high-risk group, and 222 (44.76%) had prostate cancer with a Gleason score of 7 or more. The mean positive core ratio was 28.02% ± 22.91%, and the largest tumor area in the needle specimen was 33.99% ± 27.27% (Table 2).
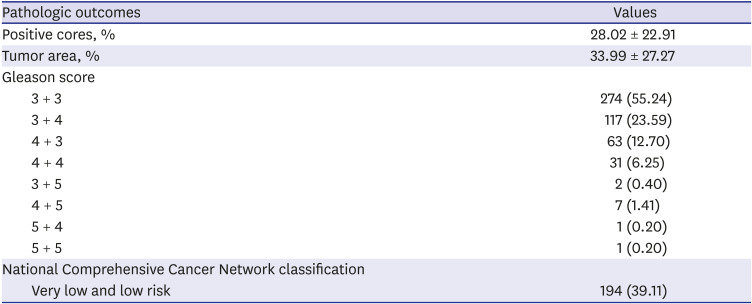
Table 2
Pathologic outcomes of prostate biopsy (n = 496)
![]()
The mean age of the intermediate- or high-risk group was 65.28 ± 7.73, while the mean age of the very low- or low-risk group was 63.24 ± 7.97 years (P = 0.005). The prevalence of HTN was 41.72% in the intermediate- or high-risk group and 30.93% in the very low- or low-risk group (P = 0.015). PSAD was 0.13 ± 0.04 ng/mL2 in the intermediate- or high-risk group and 0.11 ± 0.03 ng/mL2 in the very low- or low-risk group (P < 0.001) (Table 3).
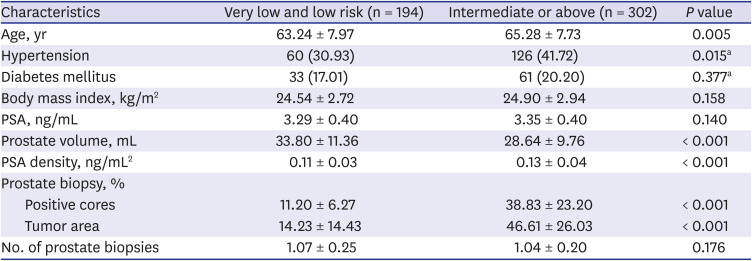
Table 3
Low-risk prostate cancer according the National Comprehensive Cancer Network classification
Data are presented as mean ± standard deviation or number (%).
PSA = prostate specific antigen.
Student's t-test, aχ2 test.
![]()
Of 330 patients who underwent radical prostatectomy, 281 (85.15%) were diagnosed as having significant cancer and 45 (13.64%) were diagnosed as T3. Of the total, 245 patients (74.24%) had a Gleason score ≥ 7, and the mean prostate cancer volume was 2.89 ± 3.92 cm3 (Table 4).
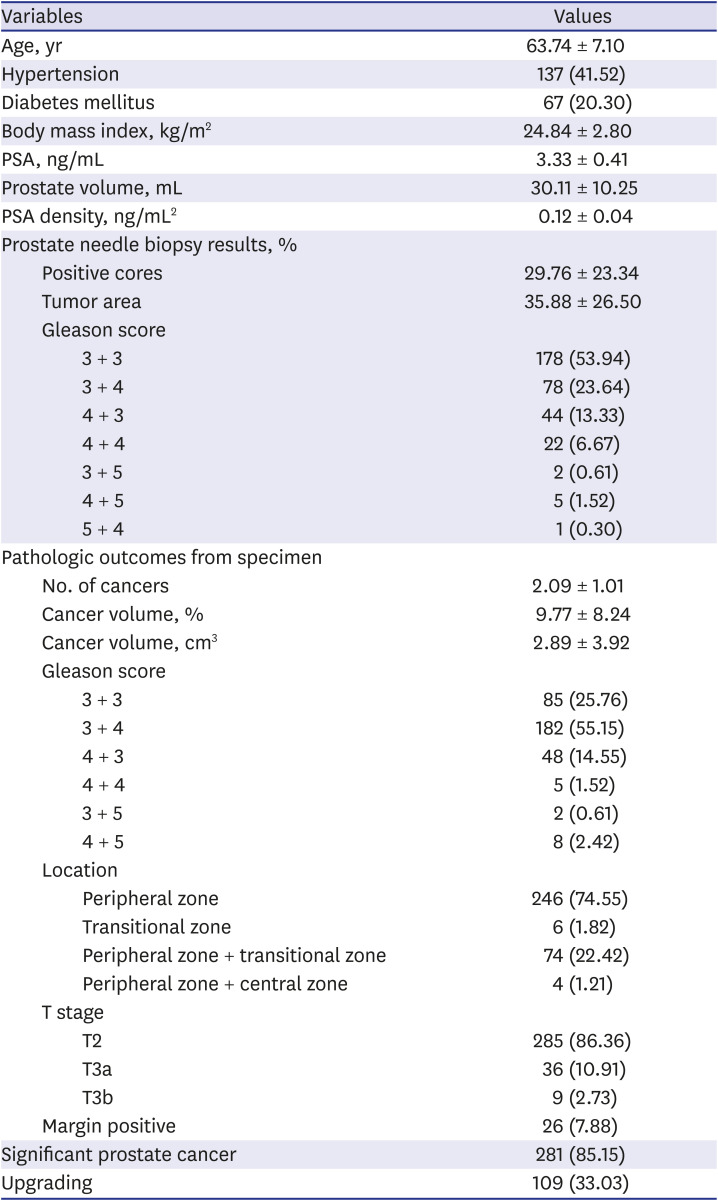
Table 4
Patients who underwent radical prostatectomy (n = 330)
![]()
Of the 1,986 patients who underwent prostate biopsy, 369 (18.58%) (significant cancer by radical prostatectomy: 281, intermediate- or high-risk patients without prostatectomy: 88) were diagnosed as having clinically significant PCa (Fig. 2).
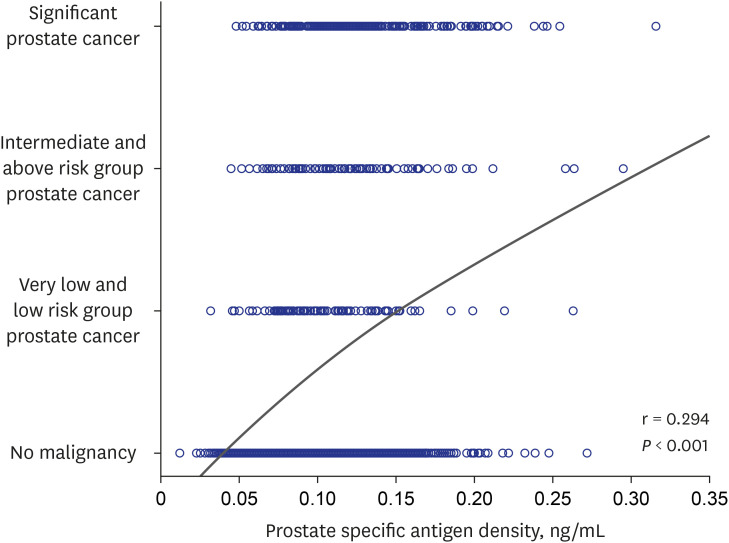
Correlation between PSAD and PCa
Go to :
DISCUSSION
In the present study, PCa was diagnosed in approximately 25% of prostate biopsies at PSA levels of 2.5 to 4.0 ng/mL, and clinically significant cancer was diagnosed in 18.5% of these patients. We also found that PSAD is a predictor of PCa detection in patients with low PSA (2.5 ng/mL to 4.0 ng/mL).
Prostate cancer diagnosed with PSA level of 4.0–10 ng/mL is reported in approximately 25% of patients.10 Approximately 30% of these patients are diagnosed with T3 or T4 PCa.1011 However, PCa is diagnosed in more than 20% of patients with PSA level less than 4.0 ng/mL.4 Therefore, it was suggested that the PSA cut-off level be lowered from 4.0 ng/mL. A cancer detection rate of 25% was also confirmed in this study.
However, when the PSA cut-off level is 4.0 ng/mL, the specificity of PCa detection is 21% and sensitivity is 91%.12 These values lead to a high false positive rate and unnecessary prostate biopsy (negative for cancer). In addition, this may increase the complications of prostate biopsy, such as acute prostatitis.13 Moreover, patients suffer mental and physical stress.14 Lowering the PSA cut-off value is still controversial as adverse effects will increase. In addition, there have been recent reports of problems with overdiagnosis of nonsignificant cancer and its overtreatment.15
Due to the limitations of this screening test, several diagnostic tools have been proposed to increase the sensitivity and specificity of PCa detection. Many biomarkers, such as free PSA,16 prostate health index,17 4Kscore,18 PCA3,19 select MDx,20 and ExoDX prostate,21 have been suggested. Additional test modalities were also developed to improve sensitivity and specificity, such as mpMRI and PET.2223 However, despite these technological advances, PCa screening has not been clearly established.
Although recent efforts to reduce overdiagnosis and overtreatment of PCa have been continuing, more than 20% of patients diagnosed with PCa with a low PSA level cannot be overlooked. The strategy for cancer detection in the low PSA group (2.5 to 4.0 ng/mL) and evaluation of PCa patient characteristics with low PSA are not well known. According to Kim et al.,6 43.6% of PCa patients with a 4.0 to 10.0 ng/mL PSA level had a Gleason score of 7 or higher upon biopsy. The average cancer volume of patients undergoing radical prostatectomy was 4.68 ± 4.19 cm3, and 27.6% of them were graded as T3 or T4. In the present study, 13.64% of patients presented with T3 and a 3.33 ± 0.41 cm3 cancer volume, but the proportion of those with a Gleason score of 7 or higher on biopsy was 44.76%, which was similar to that of PSA 4.0–10.0 ng/mL PCa patients.
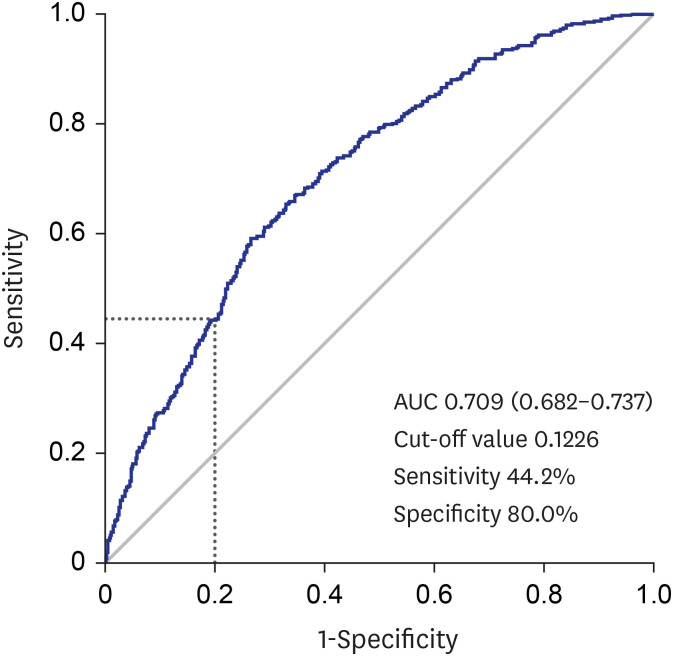
The results in this study indicate a significant difference in PSAD between the group diagnosed with PCa and the group without PCa in the low PSA level group of 2.5–4.0 ng/mL. There was a significant difference in PSAD between the very low- or low-risk group and the intermediate- or high-risk group. In addition, a significant correlation between PSAD and PCa was also confirmed. The efficacy of PSAD has been reported in many studies.2425 However, the efficacy of PSAD in the low PSA group of 2.5 to 4.0 ng/mL had not been evaluated. In this study, with 80% specificity of the low PSA group and 44.2% sensitivity, the PSAD cut-off value was suggested as 0.1226 ng/mL2. Based on the recent trend of avoiding unnecessary biopsy and overtreatment, patients with 0.1226 ng/mL2 or higher PSAD in the low-PSA group (2.5 to 4.0 ng/mL) are recommended for prostate biopsy. Furthermore, in PSAD cases with level lower than 0.1226 ng/mL2, PSA follow-up or additional tests such as MP MRI, free PSA, and PCA3 are suggested to determine prostate biopsy need. In particular, PSAD has the advantage of not requiring unnecessary medical costs because it does not require additional tests, other than transrectal ultrasonography and PSA.
The limitations of this study are its retrospective nature and unintended selection biases due to data from a single institution. The results of MRI were not assessed in this study. In addition, the absence of long-term oncological outcomes such as biochemical recurrence can be another limitation. However, we examined whether biopsy should be performed in 2.5–4.0 ng/mL PSA patients. As a result, a significant strategy of biopsy in low-PSA patients was presented. The present study confirmed that the PCa detection rate in the low-PSA group of 2.5 to less than 4.0 ng/mL was not lower than that of the previous studies of patients with PSA from 4.0 to 10.0 ng/mL. Therefore, further discussion of the traditional PSA cut-off is required. In addition, if PSAD is used, it may be helpful to establish a strategy for PCa detection in the low-PSA group.
Go to :
 XML Download