Journal List > J Korean Med Sci > v.35(39) > 1146181

Shin, Lee, Park, and Nam: Socioeconomic Status and Successful Delivery after an Infertility Diagnosis: a Nationwide Health Insurance Cohort Study in Korea Conducted from 2005 to 2013

Abstract

Background

The global disease burden of infertility is rising and accessibility to infertility treatments and assisted reproduction is a challenging issue. Therefore, we investigated characteristics of successful delivery after an infertility diagnosis among infertile women.

Methods

We designed a retrospective cohort study with the main outcome measure of a delivery medical record after the initial diagnosis of infertility. A total of 10,108 women patients who were diagnosed with infertility between 2005 to 2013 in the National Health Insurance Cooperation Cohort Database of Korea were enrolled. The adjusted hazard ratios (HRs) and 95% confidence intervals (CIs) for subsequent delivery were estimated by applying a Cox proportional-hazard regression model.

Results

Approximately 55% of infertile women who reported infertility had a delivery eventually. Infertile women who are aged between 30 to 39 (HR, 0.80; 95% CI, 0.75–0.84), in low income level (HR, 0.77; 95% CI, 0.71–0.84), or diagnosed with diabetes (HR, 0.76; 95% CI, 0.60–0.96) were less likely to report a delivery.

Conclusion

These findings highlight demographic, socioeconomic, and medical characteristics of reporting a consequent delivery. Although many previous articles reported an association between socioeconomic status and receiving medical evaluation, there were few studies regarding successful delivery after an infertility diagnosis across socioeconomic status. Thus, the maintaining of support for low socioeconomic status infertile women and their family should be considered after the infertility diagnosis in aspects of financial and social approaches.

Graphical Abstract

jkms-35-e341-abf001.jpg

INTRODUCTION

The global burden of infertility is rising and accessibility to infertility treatments and assisted reproduction is a challenging issue.123 In addition, the burden is increased with mental illness including depression and anxiety.4 To address the burden of infertility for efficient planning by the fertility healthcare system, it is necessary to assess the problem.
In Korea, the total fertility rate is the lowest among the Organization for Economic Co-operation and Development countries in 2017, with 1.1 births per couple.5 The most explainable reason for this low birth rate is economic recession and increasing cost for raising a child.6 Moreover, other factors such as rising women's status and their achievement in the workplace are also related to low birth rate.7 However, the increased rate for infertility might be also attributable to this phenomenon. According to recent national health statistics, a total number of about 220,300 people were diagnosed at an infertility clinic and a total number of 52,860 in vitro fertilizations were performed in 2016. However, until September 2017, Korean National Health Insurance (NHI) only provided limited coverage for infertility tests and surgery for underlying medical conditions associated with secondary infertility. In other words, the NHI does not generally cover the in-vitro fertilization (IVF) and medical costs. In fact, the large portion of medical cost for fertilization is from repetitive IVF and related tests. Thus, according to another national report in 2003, 26.6% of infertile couples had a plan to stop IVF due to financial crisis.8
In order to improve the financial barriers to fertilization procedures, the government started to provide subsidies to low-income couples whose monthly income was under 130% of average since 2006. In 2009, the subsidy for low-income couples was expanded from two to three IVF procedures. Until 2017, they also provided similar support to middle or high income couples. Recently, they started to provide insurance coverage for infertility procedures for people who were diagnosed infertile from October, 2017. Even though the government tries to improve financial accessibility, the economic barriers are higher for the low-income population. However, there has not been concrete research whether these kinds of polices decreased the gap in outcomes among infertility patients across socioeconomic status.
Thus, we investigated the association between socioeconomic status and successful delivery after the initial infertility diagnosis among infertile women aged between 21 to 40.

METHODS

Data

We analyzed the Korea NHI Service-National Sample Cohort, which includes information about approximately 1 million patients.9 This information was obtained from a random sample that was stratified according to age, sex, region, health insurance type, income decile, and individual total medical costs in 2002; the participants were reassessed and followed until 2013. The Korean NHI Claims Database (NHICD) includes unique anonymous numbers for each patient as well as their age, sex, type of insurance, diagnoses according to the International Classification of Diseases (ICD-10), medical costs claimed, prescription drugs, and medical history. Moreover, these unique anonymous numbers are linked to mortality information, which was obtained from the Korean National Statistical Office.

Participants

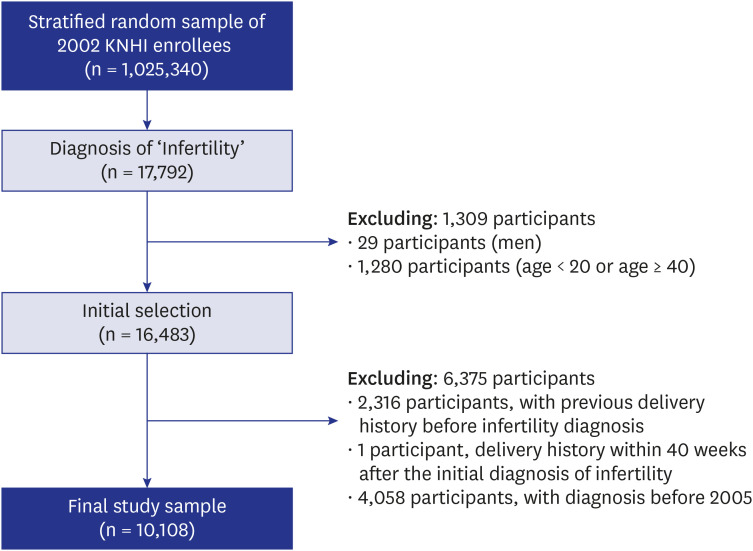
On December 31, 2002, a total of 1,025,340 cohort participants were selected for the present study. From this initial population, a cohort of subjects who had been newly diagnosed with ‘female infertility’ (ICD-10 code: N97) was chosen for the present analyses. Among 17,792 subjects with women infertility, 29 male participants were excluded and then we also excluded 1,309 patients whose age was under 20 and over 40 (Fig. 1). To extract nulliparous women, we excluded 2,316 participants with previous delivery history before infertility diagnosis. Another one participant was excluded due to subsequent delivery within 40 weeks after the initial infertility diagnosis. For selecting newly diagnosed patients in health claim data, we excluded 4,058 participants who already had infertility diagnosis from 2002 to 2004, for three years. Finally, a total number of 10,108 participants were chosen in the study.
Fig. 1

Flowchart showing sample selection.

KNHI = Korean National Health Insurance.
jkms-35-e341-g001

Outcome measures

The primary outcome measure was defined as a subsequent delivery after the initial infertility diagnosis. Although we did not have concrete medical records for infertility patients, we were able to determine whether there was a subsequent delivery after 40 weeks from initial infertility diagnosis or not. The ICD code for delivery were as follow; ‘O80, delivery in a completely normal case,’ ‘O81, single delivery by forceps and vacuum extractor,’ ‘O82, single delivery by cesarean section,’ ‘O83, other assisted single delivery,’ and ‘O84, multiple delivery.’

Covariates

We assessed a number of demographic characteristics, including age, sex, and area of residence. Socioeconomic characteristics, such as income level and type of medical insurance were also assessed, and the NHI premium was used as a proxy measure of precise income because it is proportional to monthly income, including earnings and capital gains. The income deciles of the NHI members were categorized into the following three groups: low (below 39th percentile), middle (40th to 79th percentile), and high (80th to 100th percentile).
In Korea, the universal health coverage system is composed of two parts: NHI and medical aid. NHI originally provided the same medical services for both employees and self-employees. The Korean government, through the Division of Healthcare for the Poor in the Ministry of Health, has been operating the Medical-Aid scheme since 1977, which is for low-income people who have difficulty paying health insurance premiums.10 There are 1.83 million Medical-Aid beneficiaries, which is 3.8% of the population of Korea.11
Medical histories related to delivery were assessed from recent references.121314 Finally, we selected the adjusted medical conditions based on the international classification of diseases 10th edition, such as cardiac, renal, musculoskeletal, digestive, blood, mental, central nervous system, rheumatic heart, lupus, collagen/vascular, rheumatoid arthritis, diabetes, obesity, asthma/chronic bronchitis, endometriosis, and polyp of female genital tract. Codes were evaluated by two independent obstetricians.

Statistical analysis

We assessed the demographic characteristics of infertility patients at baseline. Baseline categorical variables were expressed as numbers and percentages and compared with a χ2 test. For continuous variables to compare three different groups, we used analysis of variance test. Additionally, the adjusted hazard ratios (HRs) and 95% confidence intervals (CIs) for subsequent delivery were estimated by applying a Cox proportional-hazard regression model. Model fitting was performed using the PHREG command in SAS version 9.4 (SAS Institute Inc., Cary, NC, USA).

Ethics statement

The present study was reviewed and approved by the Institutional Review Board (IRB) of the Graduate School of Public Health at Yonsei University, which approved use of these data as well as the study design (IRB approval No. 2-1040939-AB-N-01-2014-239). Informed consent was submitted by all subjects when they were enrolled.

RESULTS

General characteristics of study subjects

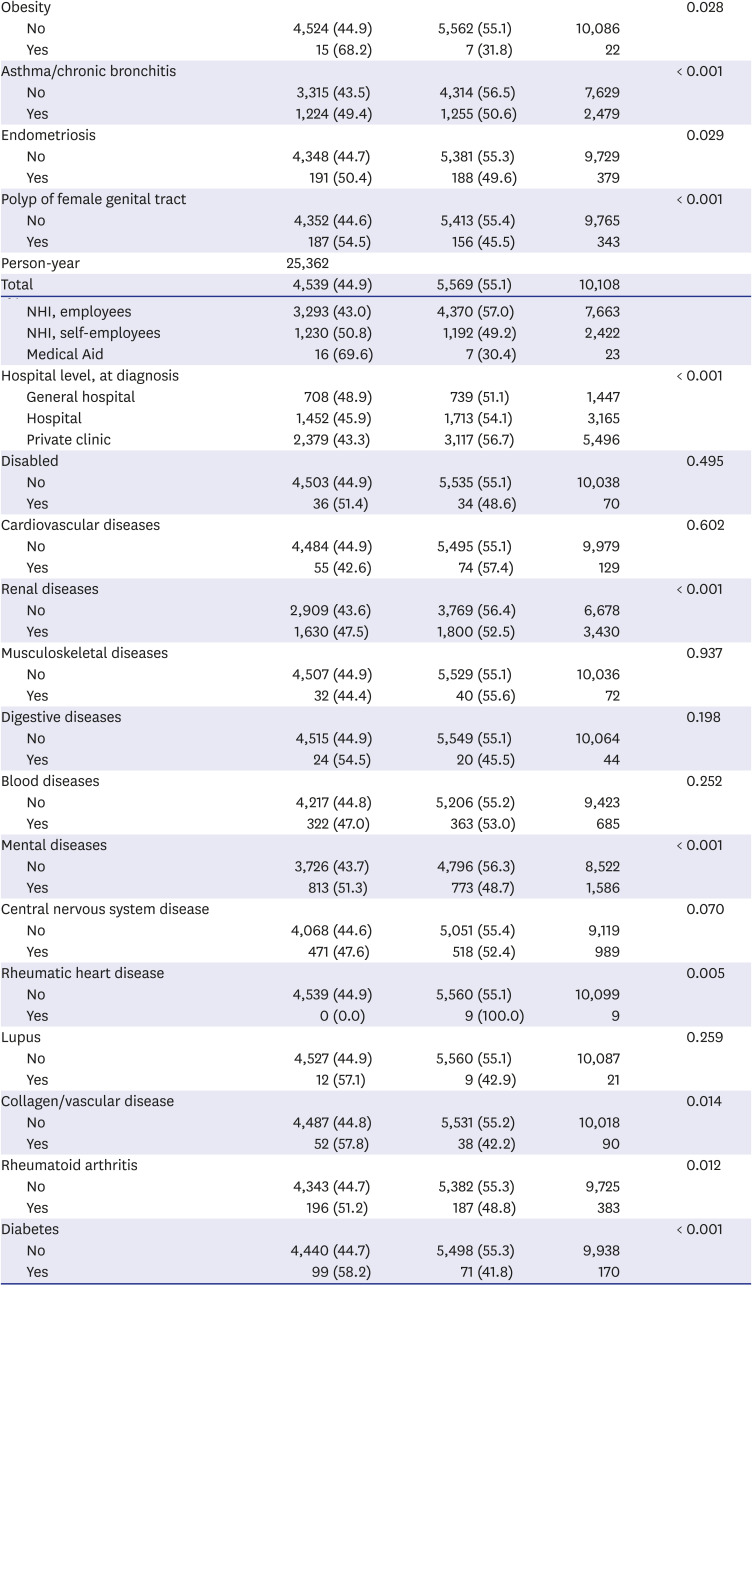
The present study included 10,108 subjects from the target population, and 25,362 person-years were examined during the study period (Table 1). Of these subjects, 5,569 experienced subsequent delivery (55.1%). There were 3,667 patients in their 20s and 6,441 in their 30s.
Table 1

Demographic characteristics among participants

jkms-35-e341-i001
Variables Subsequent birth Total P value
No Yes
Age group, yr < 0.001
20–29 1,353 (36.9) 2,314 (63.1) 3,667
30–39 3,186 (49.5) 3,255 (50.5) 6,441
Income level < 0.001
High 1,449 (45.5) 1,734 (54.5) 3,183
Middle 2,110 (42.4) 2,863 (57.6) 4,973
Low 980 (50.2) 972 (49.8) 1,952
Region 0.747
Capital 1,112 (44.9) 1,364 (55.1) 2,476
Metropolitans 1,124 (44.3) 1,414 (55.7) 2,538
Small cities or rural 2,303 (45.2) 2,791 (54.8) 5,094
Type of insurance < 0.001
NHI, employees 3,293 (43.0) 4,370 (57.0) 7,663
NHI, self-employees 1,230 (50.8) 1,192 (49.2) 2,422
Medical Aid 16 (69.6) 7 (30.4) 23
Hospital level, at diagnosis < 0.001
General hospital 708 (48.9) 739 (51.1) 1,447
Hospital 1,452 (45.9) 1,713 (54.1) 3,165
Private clinic 2,379 (43.3) 3,117 (56.7) 5,496
Disabled 0.495
No 4,503 (44.9) 5,535 (55.1) 10,038
Yes 36 (51.4) 34 (48.6) 70
Cardiovascular diseases 0.602
No 4,484 (44.9) 5,495 (55.1) 9,979
Yes 55 (42.6) 74 (57.4) 129
Renal diseases < 0.001
No 2,909 (43.6) 3,769 (56.4) 6,678
Yes 1,630 (47.5) 1,800 (52.5) 3,430
Musculoskeletal diseases 0.937
No 4,507 (44.9) 5,529 (55.1) 10,036
Yes 32 (44.4) 40 (55.6) 72
Digestive diseases 0.198
No 4,515 (44.9) 5,549 (55.1) 10,064
Yes 24 (54.5) 20 (45.5) 44
Blood diseases 0.252
No 4,217 (44.8) 5,206 (55.2) 9,423
Yes 322 (47.0) 363 (53.0) 685
Mental diseases < 0.001
No 3,726 (43.7) 4,796 (56.3) 8,522
Yes 813 (51.3) 773 (48.7) 1,586
Central nervous system disease 0.070
No 4,068 (44.6) 5,051 (55.4) 9,119
Yes 471 (47.6) 518 (52.4) 989
Rheumatic heart disease 0.005
No 4,539 (44.9) 5,560 (55.1) 10,099
Yes 0 (0.0) 9 (100.0) 9
Lupus 0.259
No 4,527 (44.9) 5,560 (55.1) 10,087
Yes 12 (57.1) 9 (42.9) 21
Collagen/vascular disease 0.014
No 4,487 (44.8) 5,531 (55.2) 10,018
Yes 52 (57.8) 38 (42.2) 90
Rheumatoid arthritis 0.012
No 4,343 (44.7) 5,382 (55.3) 9,725
Yes 196 (51.2) 187 (48.8) 383
Diabetes < 0.001
No 4,440 (44.7) 5,498 (55.3) 9,938
Yes 99 (58.2) 71 (41.8) 170
Obesity 0.028
No 4,524 (44.9) 5,562 (55.1) 10,086
Yes 15 (68.2) 7 (31.8) 22
Asthma/chronic bronchitis < 0.001
No 3,315 (43.5) 4,314 (56.5) 7,629
Yes 1,224 (49.4) 1,255 (50.6) 2,479
Endometriosis 0.029
No 4,348 (44.7) 5,381 (55.3) 9,729
Yes 191 (50.4) 188 (49.6) 379
Polyp of female genital tract < 0.001
No 4,352 (44.6) 5,413 (55.4) 9,765
Yes 187 (54.5) 156 (45.5) 343
Person-year 25,362
Total 4,539 (44.9) 5,569 (55.1) 10,108
Values are presented as number (%).
The χ2 test was performed for categorical variable analysis.
In χ2 test for subsequent delivery, older age group, low income, medical aid, and higher hospital level at diagnosis were statistically associated with lower possibilities for delivery. In addition, medical history of renal, mental, collagen/vascular, rheumatoid arthritis, diabetes, obesity, asthma/chronic bronchitis, endometriosis, and polyp of female genital tract were also related to low subsequent delivery.
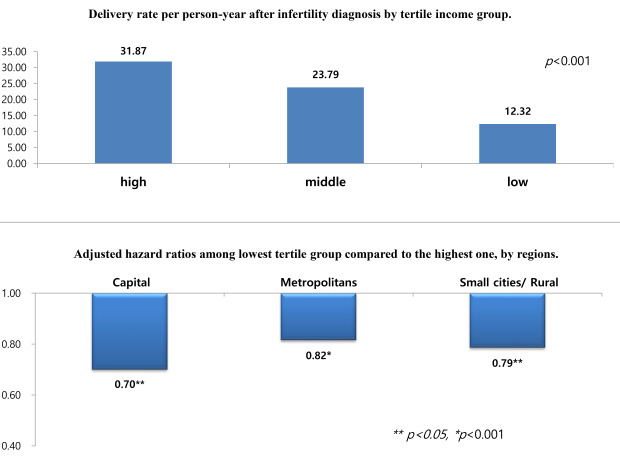
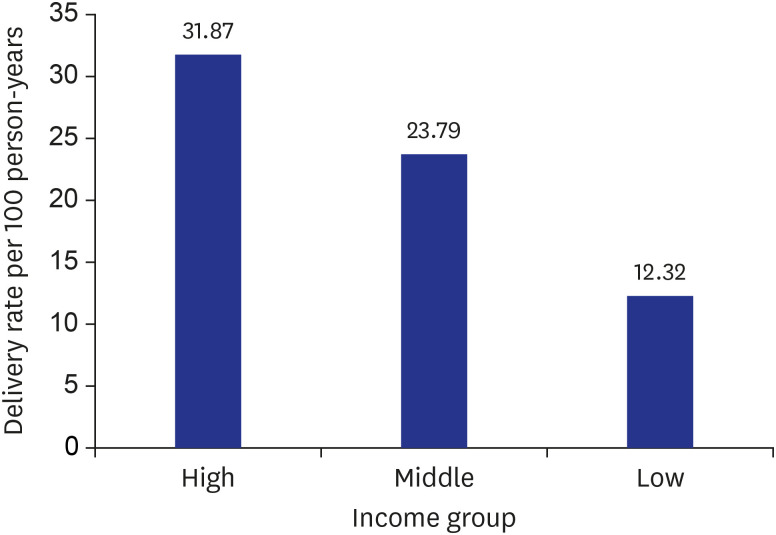
In terms of income level, 3,183 (31.5%) of high-, 4,973 (49.2%) of middle-, and 1,952 (19.3%) of low-income infertility patients were enrolled (Table 1). When we compared the delivery rate per 100 person-years, the delivery rates were increased by increasing income categories from low to high with statistical significance (P < 0.001) (Fig. 2).
Fig. 2

Delivery rate after infertility diagnosis by tertile income group.

jkms-35-e341-g002

Multivariate analysis of the HR for subsequent delivery

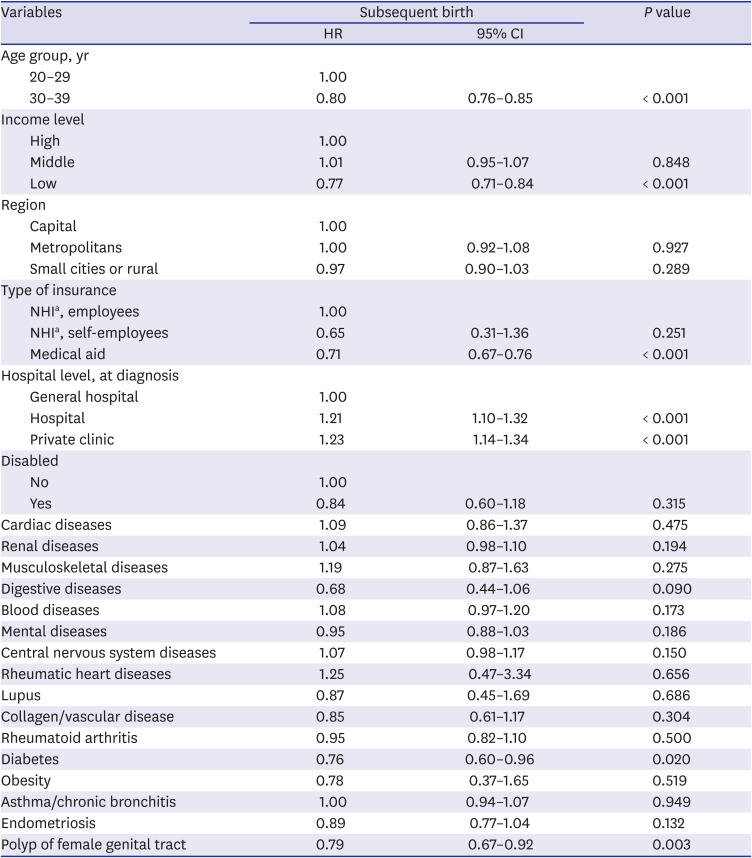
Compared with participants who were in their 20s, participants in their 30s showed low adjusted HR for subsequent delivery (adjusted HR, 0.80; 95% CI, 0.76–0.85) (Table 2). Additionally, the adjusted HRs significantly decreased in low-income patients (HR, 0.77; 95% CI, 0.71–0.84) and patients under medical aid (HR, 0.71; 95% CI, 0.67–0.76). In terms of Medical history, diabetes (HR, 0.76; 95% CI, 0.60–0.96) and polyp of female genital tract (HR, 0.79; 95% CI, 0.67–0.92) were associated with low HR statistically.
Table 2

The adjusted HRs for consequent successful delivery among participants who were between 20 and 39 years of age

jkms-35-e341-i002
Variables Subsequent birth P value
HR 95% CI
Age group, yr
20–29 1.00
30–39 0.80 0.76–0.85 < 0.001
Income level
High 1.00
Middle 1.01 0.95–1.07 0.848
Low 0.77 0.71–0.84 < 0.001
Region
Capital 1.00
Metropolitans 1.00 0.92–1.08 0.927
Small cities or rural 0.97 0.90–1.03 0.289
Type of insurance
NHIa, employees 1.00
NHIa, self-employees 0.65 0.31–1.36 0.251
Medical aid 0.71 0.67–0.76 < 0.001
Hospital level, at diagnosis
General hospital 1.00
Hospital 1.21 1.10–1.32 < 0.001
Private clinic 1.23 1.14–1.34 < 0.001
Disabled
No 1.00
Yes 0.84 0.60–1.18 0.315
Cardiac diseases 1.09 0.86–1.37 0.475
Renal diseases 1.04 0.98–1.10 0.194
Musculoskeletal diseases 1.19 0.87–1.63 0.275
Digestive diseases 0.68 0.44–1.06 0.090
Blood diseases 1.08 0.97–1.20 0.173
Mental diseases 0.95 0.88–1.03 0.186
Central nervous system diseases 1.07 0.98–1.17 0.150
Rheumatic heart diseases 1.25 0.47–3.34 0.656
Lupus 0.87 0.45–1.69 0.686
Collagen/vascular disease 0.85 0.61–1.17 0.304
Rheumatoid arthritis 0.95 0.82–1.10 0.500
Diabetes 0.76 0.60–0.96 0.020
Obesity 0.78 0.37–1.65 0.519
Asthma/chronic bronchitis 1.00 0.94–1.07 0.949
Endometriosis 0.89 0.77–1.04 0.132
Polyp of female genital tract 0.79 0.67–0.92 0.003
For medical conditions, all adjusted HRs with diseases are compared to another without diseases.
HR = hazard ratio, CI = confidence interval, NHI = National Health Insurance.
aNHI is the sole health insurance in Korea, operated by a public organization.
When we performed subgroup analysis by age group (Table 3), patients in their 20s and 30s both showed statistical relationships between income level and subsequent delivery. However, it seemed that the patients in their 20s were more associated with low income level.
Table 3

The adjusted HRs for consequent delivery by age group

jkms-35-e341-i003
Variables Subsequent birth
Age, 20–29 Age, 30–39
HR 95% CI P value HR 95% CI P value
Income level
High 1.00 1.00
Middle 0.91 0.82–1.00 0.056 1.06 0.98–1.15 0.121
Low 0.72 0.63–0.81 < 0.001 0.79 0.71–0.88 < 0.001
HR = hazard ratio, CI = confidence interval.
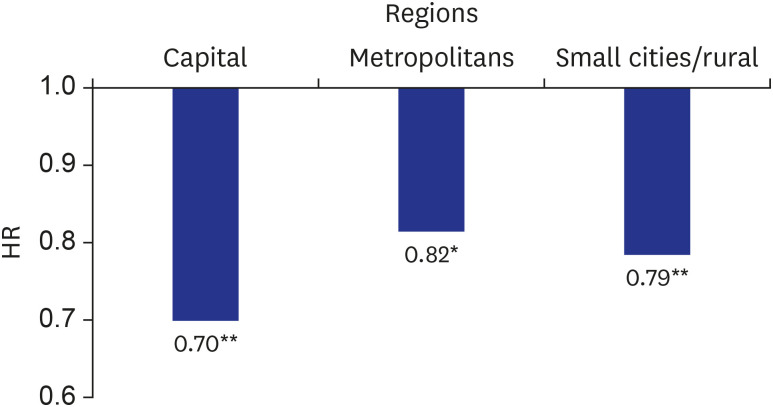
In another subgroup analysis based on the residential area (Fig. 3), the low income patients in the capital (HR, 0.70; 95% CI, 0.59–0.83) were more vulnerable to successful delivery compared to the others in metropolitans (HR, 0.82; 95% CI, 0.70–0.95) and small cities or rural regions (HR, 0.79; 95% CI, 0.70–0.88).
Fig. 3

Adjusted HRs among lowest tertile group compared to the highest one, by regions. Capital means Seoul, Metropolitans are large cities more than a million population including Busan, Daegu, Incheon, Daejeon, Gwangju and Ulsan, and Small cities or rural are the other provinces in Korea.

HR = hazard ratio.
*P < 0.05, **P < 0.001.
jkms-35-e341-g003

DISCUSSION

In this study, there are several notable observations from our study. First, among the infertile women, 55.1% ultimately had a medical record for consequent delivery. It took an average of 21.6 months from initial infertility diagnosis to delivery. Second, we identified factors that influenced whether women finally delivered consequently or not. Low-income infertility patients were associated with low HR for subsequent delivery. Furthermore, older age group, diabetes and polyp of female genital tract were also related to low probability for subsequent delivery.
There are several studies regarding the difference in accessibility to fertility clinics across different socioeconomic status.31315161718 For example, Dhalwani et al.19 studied the occurrence of fertility problems presenting to primary care. They also estimated clinical burden and socioeconomic inequalities in the UK. In this study, the infertile women aged under 25 were more related to socioeconomic deprivation than the other older patients. In another study in Australia,18 10.13 and 5.17 fresh assisted reproductive technology (ART) cycles per 1,000 women of reproductive age were performed in women in the highest and lowest socioeconomic status quintiles respectively. In the US, socioeconomic factors other than household income were evaluated, such as race/ethnicity, health insurance coverage for infertility services, and education. In this study, educational level and income were related to the infertility treatment use, and education level was strongly associated with achieving a pregnancy.20
However, similar results were not reported yet in developed Asian countries. Since infertile couples cope with on-going fertility treatments in different manners related to their own cultural and social background, it should be examined in ones’ own society. The reason for limited research regarding the association of socioeconomic status and infertility in Asia might be related to the fact that infertility and involuntary childlessness have traditionally been taboo subjects.2122 This social conception and stigma still exists even in Hong Kong, which is the most developed city in Asia.23 As a result, infertility has been a topic which was not easily discussed with others, even with researchers.22 In most non-western countries, women who do not have children may be regarded as ‘failures’.2224252627
Despite this social circumstance, the Korean government initiated and has expanded subsidization for fertilization medical procedures. There was implementation of a subsidization policy for IVFs in 2006 and for intrauterine insemination (IUI) in 2010. The income threshold for subsidization is under 150% of the monthly household income. The ministry provides subsidies for up to six IVFs including three fresh embryos and three frozen embryos for low-income infertile couples (four IVFs for fresh embryos only). In terms of IUI, it is subsided four times at most. A total number of 31,152 cases were subsidized in 2013. The average cost for IVFs was 2,670,000 KRW (2,440 USD; 1 USD = 1,095 KRW).
From September 2016, the Korean government decided to a considerable extent to expand this subsidization. First, the government set the new threshold for low-income couples, of which income is less than 100% of average monthly household income. For these couples, additional subsidization with 500,000 KRW and another opportunity for fresh embryo IVF procedure are provided. Moreover, the government also supported middle- and high-income couples for IVF procedures with 1,000,000 KRW. From October 2017, the government started to cover IVF procedures, including four procedures of fresh embryo transfers, three procedures of frozen embryo transfers, and three procedures of internal uterine injections. In July 2019, the government expanded the coverage to seven procedures of fresh embryo transfers, five procedures of frozen embryo transfers, and five procedures of internal uterine injections. The age limit of 40 years or above has been abolished and the out-of-pocket cost burden of IVF has been reduced through partial coverage in health insurance premiums.
However, it is not assured that whether these kinds of expanding health policies will increase the total number of births using ART and reduce the gap between high- and low-income infertility patients for consequent delivery.
First, the medical cost for IVFs is still expensive despite these subsides. According to a national report, 79.3% of IVF procedures were composed of an out-of-pocket cost of 1,800,000 KRW (1,644 USD) or over in 2013. Since the monthly income of the lowest quintile of households in Korea was 1,532,000 KRW in 2013 and the percentage of deficit spending among the lowest quintile income group is 42.5%,28 most patients in this group would be unable to afford the extra out-of-pocket costs for fertility procedures. Moreover, when we consider that IVF often requires multiple attempts and accessorial charges for tests, it is a burden for infertile couples, especially for low-income couples. These high and repetitive health expenditures might be considered a catastrophic health expenditure, which means that health expenditure in a household is more than 40 percent of a household's annual expenditure, excluding expenditure for food.2930 In South Africa, one in five couples (22%) incurred catastrophic expenditure. In the poorest tertile group, 51% of households faced catastrophic health expenditure while there were only 2% of households in the richest tertile.18
Second, low-income couples might not be able to visit experienced hospitals with high successful rates for IVFs. Since the government only provides subsides, rather than covering ARTs under NHI, fertility clinics decide the medical costs for IVF and IUI, and hospitals tend to set higher costs for ART under this unregulated price market. This induced the increased financial burden of accessing good quality fertility clinics for low-income patients. Moreover, since low-income patients usually have less knowledge about assessing quality in healthcare organizations,3132 there might be quality issues in hospitals which low-income infertile couples usually visit. In fact, ten fertility clinics (6.7% among 150 authorized fertility clinics for IVF) performed 51.3% of all procedures. In terms of IUI, there were 411 authorized clinics. Among them, 292 clinics performed IUI in 2014 and 59.9% of procedures were done by the top twenty clinics. Moreover, among these 292 clinics, 31.8% did not have any successful pregnancy after ART in 2014.33
Third, the temporal accessibility to fertility clinics hinder low-income patients from visiting clinics. Generally, increased labor force in women is associated with decreased fertility.343536 For example, the couples who are in poor working environment without a possible replacement are unable to visit fertility clinics repeatedly.29 Although we could not figure out the direct association between the employment status and accessibility to fertility clinics in this study, it is possible to infer using other references.
The present study has several limitations that should be addressed.
First, the NHICD does not include detailed medical information such as medical reasons for infertility, personal lifestyle, perceived stress, or other environmental factors. Additionally, we did not adjust for the year variable, which might be affected by the reforming of the health insurance coverage policy. Thus, we could not adjust these factors associated with infertility and consequent delivery.
Second, we were not able to determine whether infertility patients used ARTs for consequent delivery or not. The ARTs including IVF and IUI both are not covered by NHI. Thus, NHI Services did not have concrete information for all ARTs.
Third, this cohort data did not contain medical history of spontaneous abortion. Since spontaneous abortion could be sensitive to women in Korea, they did not provide this information.
Fourth, this retrospective cohort study does not support causality between low socioeconomic status and consequent delivery. Although there is a Finnish cohort study that the socioeconomic status is not associated with pregnancy outcome using IVFs,37 it has not been evaluated in Asians. Thus, it is not certain whether there is a reverse causality or not.
Finally, it is not assured that infertile patients were newly diagnosed from 2005 to 2013. Although we excluded the patients who were already diagnosed as infertile from 2002 to 2004 for three years, there is a possibility that infertile women who were diagnosed before 2002 might have visited after 2005 for further ART trials. Furthermore, this study might have selection bias. We assumed that participants diagnosed with infertility include women who were willing to get pregnant. Therefore, women who were not married, who did not have any intentions to have a baby, or who abandoned having a baby, have been excluded from the study.
In spite of these limitations, we suggest that this nation-wide study showed the association between socioeconomic statuses was associated with consequent delivery after initial diagnosis of infertility. Furthermore, our study might facilitate improving the act: ‘Leave of Absence for Subfertility Treatment (Equal Employment Opportunity and Work-family Balance Assistance Act, Article 18-3).’ Article 18-3 states that ‘when employee applies for a leave of absence to receive subfertility treatment, an employer shall grant a leave of absence to the employee for a period not exceeding three days a year, and the first on day shall be a paid leave of absence.’38 However, if women received subfertility treatment more than once per year (e.g., possibly 2 or 3 times), more grants for leave of absence and paid leave of absence would be required. Therefore, the policy makers should consider revising the policies and laws regarding subfertility treatment in order to protect employees facing motherhood.
In conclusion, this population-based longitudinal cohort study demonstrated that low-income infertile women have a lower possibility of consequently delivering a baby. And this risk increases in metropolitan areas. Although the Korean government has been expanding subsidies, it might not be enough for low-income households because of persisting financial burden, possible low temporal accessibility, and lack of information on good quality fertility clinics. As the number of infertile couples are increasing and birth rates have dropped steeply, it is necessary to start discussion about coverage from NHI for ARTs.

Notes

Disclosure: The authors have no potential conflicts of interest to disclose.

Author Contributions:

  • Conceptualization: Shin J, Lee SG, Park EC.

  • Data curation: Shin J.

  • Formal analysis: Shin J.

  • Investigation: Shin J.

  • Methodology: Shin J, Park EC.

  • Validation: Lee SG.

  • Writing - original draft: Shin J, Nam JY.

  • Writing - review & editing: Nam JY.

References

1. Boivin J, Bunting L, Collins JA, Nygren KG. International estimates of infertility prevalence and treatment-seeking: potential need and demand for infertility medical care. Hum Reprod. 2007; 22(6):1506–1512. PMID: 17376819.
crossref
2. Vayena E, Rowe PJ, Griffin PD. Current Practices and Controversies in Assisted Reproduction: Report of a WHO Meeting on “Medical, Ethical and Social Aspects of Assisted Reproduction”. Geneva: World Health Organization;2002.
3. Ombelet W, Cooke I, Dyer S, Serour G, Devroey P. Infertility and the provision of infertility medical services in developing countries. Hum Reprod Update. 2008; 14(6):605–621. PMID: 18820005.
crossref
4. Cousineau TM, Domar AD. Psychological impact of infertility. Best Pract Res Clin Obstet Gynaecol. 2007; 21(2):293–308. PMID: 17241818.
crossref
5. OECD. Fertility rates. Total, children/woman, 1970–2017. Updated 2019. Accessed July 4, 2019. https://data.oecd.org/pop/fertility-rates.htm.
6. Eun KS. Lowest-low fertility in the Republic of Korea: causes, consequences and policy responses. Asia Pac Popul J. 2007; 22(2):51–72.
crossref
7. Ma L. Female labour force participation and second birth rates in South Korea. J Popul Res (Canberra). 2016; 33(2):173–195.
crossref
8. Hwang N, Lee S, Chang I. The Result and Assessment of Supporting Program for Parents Couples with Infertility in 2016. Sejong: Ministry of Health and Welfare, Korea Institute for Health and Social Affairs;2017.
9. Lee J, Lee JS, Park SH, Shin SA, Kim K. Cohort profile: the National Health Insurance Service-National Sample Cohort (NHIS-NSC), South Korea. Int J Epidemiol. 2017; 46(2):e15. PMID: 26822938.
crossref
10. Shin YJ. Policy context of the poor progress of the pro-poor policy: a case study on the medical-aid policy during Kim Dae-jung's government (1998–2002) in the Republic of Korea. Health Policy. 2006; 78(2-3):209–223. PMID: 16289428.
crossref
11. National Health Insurance Service. National Health Insurance Service Statistical Yearbook. Wonju: National Health Insurance Service;2012.
12. Howell EA, Zeitlin J, Hebert PL, Balbierz A, Egorova N. Association between hospital-level obstetric quality indicators and maternal and neonatal morbidity. JAMA. 2014; 312(15):1531–1541. PMID: 25321908.
crossref
13. Farland LV, Collier AY, Correia KF, Grodstein F, Chavarro JE, Rich-Edwards J, et al. Who receives a medical evaluation for infertility in the United States? Fertil Steril. 2016; 105(5):1274–1280. PMID: 26785253.
crossref
14. Eisenberg ML, Li S, Cullen MR, Baker LC. Increased risk of incident chronic medical conditions in infertile men: analysis of United States claims data. Fertil Steril. 2016; 105(3):629–636. PMID: 26674559.
crossref
15. Kessler LM, Craig BM, Plosker SM, Reed DR, Quinn GP. Infertility evaluation and treatment among women in the United States. Fertil Steril. 2013; 100(4):1025–1032. PMID: 23849845.
crossref
16. Morris M, Oakley L, Maconochie N, Doyle P. An investigation of social inequalities in help-seeking and use of health services for fertility problems in a population-based sample of UK women. Hum Fertil (Camb). 2011; 14(1):16–22. PMID: 21121703.
crossref
17. Nahar P. The link between infertility and poverty: evidence from Bangladesh. Hum Fertil (Camb). 2012; 15(1):18–26. PMID: 22313219.
crossref
18. Chambers GM, Hoang VP, Illingworth PJ. Socioeconomic disparities in access to ART treatment and the differential impact of a policy that increased consumer costs. Hum Reprod. 2013; 28(11):3111–3117. PMID: 23906901.
crossref
19. Dhalwani NN, Fiaschi L, West J, Tata LJ. Occurrence of fertility problems presenting to primary care: population-level estimates of clinical burden and socioeconomic inequalities across the UK. Hum Reprod. 2013; 28(4):960–968. PMID: 23315065.
crossref
20. Smith JF, Eisenberg ML, Glidden D, Millstein SG, Cedars M, Walsh TJ, et al. Socioeconomic disparities in the use and success of fertility treatments: analysis of data from a prospective cohort in the United States. Fertil Steril. 2011; 96(1):95–101. PMID: 21616487.
crossref
21. Feldman E. Medical ethics the Japanese way. Hastings Cent Rep. 1985; 15(5):21–24. PMID: 4066301.
crossref
22. Bos HMW, van Rooij FB. The influence of social and cultural factors on infertility and new reproductive technologies. J Psychosom Obstet Gynaecol. 2007; 28(2):65–68. PMID: 17538813.
crossref
23. Lee DT, Ngai IS, Ng MM, Lok IH, Yip AS, Chung TK. Antenatal taboos among Chinese women in Hong Kong. Midwifery. 2009; 25(2):104–113. PMID: 17408821.
crossref
24. Inhorn MC. Making Muslim babies: IVF and gamete donation in Sunni versus Shi'a Islam. Cult Med Psychiatry. 2006; 30(4):427–450. PMID: 17051430.
crossref
25. Donkor ES, Sandall J. The impact of perceived stigma and mediating social factors on infertility-related stress among women seeking infertility treatment in Southern Ghana. Soc Sci Med. 2007; 65(8):1683–1694. PMID: 17673344.
crossref
26. Loke AY, Yu PL, Hayter M. Experiences of sub-fertility among Chinese couples in Hong Kong: a qualitative study. J Clin Nurs. 2012; 21(3-4):504–512. PMID: 21507092.
crossref
27. de Kok BC, Widdicombe S. ‘I really tried’: management of normative issues in accounts of responses to infertility. Soc Sci Med. 2008; 67(7):1083–1093. PMID: 18599172.
28. Korean Statistical Information Service. Monthly income and percentage of households under deficit spending by quintile income group. Updated 2016. Accessed April 20, 2017. http://kosis.kr/statisticsList/statisticsList_01List.jsp?vwcd=MT_ZTITLE&parentId=C#SubCont.
29. Dyer SJ, Sherwood K, McIntyre D, Ataguba JE. Catastrophic payment for assisted reproduction techniques with conventional ovarian stimulation in the public health sector of South Africa: frequency and coping strategies. Hum Reprod. 2013; 28(10):2755–2764. PMID: 23878180.
crossref
30. Xu K, Evans DB, Kawabata K, Zeramdini R, Klavus J, Murray CJ. Household catastrophic health expenditure: a multicountry analysis. Lancet. 2003; 362(9378):111–117. PMID: 12867110.
crossref
31. Fiscella K, Franks P, Gold MR, Clancy CM. Inequality in quality: addressing socioeconomic, racial, and ethnic disparities in health care. JAMA. 2000; 283(19):2579–2584. PMID: 10815125.
32. Alter DA, Naylor CD, Austin P, Tu JV. Effects of socioeconomic status on access to invasive cardiac procedures and on mortality after acute myocardial infarction. N Engl J Med. 1999; 341(18):1359–1367. PMID: 10536129.
crossref
33. Hwang N, Chae S, Chang I. The Result and Assessment of Supporting Program for Parents Couples with Infertility in 2014. Sejong: Ministry of Health and Welfare, Korea Institute for Health and Social Affairs;2015.
34. Del Boca D. The effect of child care and part time opportunities on participation and fertility decisions in Italy. J Popul Econ. 2002; 15(3):549–573.
crossref
35. Hank K, Kreyenfeld M. A multilevel analysis of child care and women's fertility decisions in Western Germany. J Marriage Fam. 2003; 65(3):584–596.
crossref
36. Brewster KL, Rindfuss RR. Fertility and women's employment in industrialized nations. Annu Rev Sociol. 2000; 26(1):271–296.
crossref
37. Räisänen S, Randell K, Nielsen HS, Gissler M, Kramer MR, Klemetti R, et al. Socioeconomic status affects the prevalence, but not the perinatal outcomes, of in vitro fertilization pregnancies. Hum Reprod. 2013; 28(11):3118–3125. PMID: 23892321.
38. Korea Legislation Research Institute. Equal employment opportunity and work-family balance assistance act. Updated 2019. Accessed June 15, 2020. https://elaw.klri.re.kr/kor_service/lawView.do?hseq=51205&lang=ENG.
TOOLS
Similar articles