

 PDF
PDF Citation
 Print
Print


INTRODUCTION
Child mortality, an index of the quality of healthcare, mostly occurs in infancy. Infant mortality is closely associated with preterm birth.123 Nevertheless, it remains unclear whether preterm infants, compared to term infants, have higher long-term mortality during childhood and adolescence or whether they differ with respect to major causes of death. Given that the survival of preterm infants has increased owing to improvements in the quality of medical care,4 their long-term prognosis, including mortality and causes of death, has become an important issue.
Previous studies reported weak correlations between birth weight and mortality after 1 year of age,5 whereas others reported positive correlations between low birth weight and mortality at all ages.6 Another study reported decreased long-term survival and reproduction in those born preterm,7 and another study reported that low birth weight was associated with mortality in infancy, late childhood, and adolescence.8 Although the mortality rate under the age of 5 is decreasing worldwide, a study predicted that preterm birth will remain a major cause of child mortality, because the mortality from preterm birth has been the slowest to decrease.9
In Korea, the rate of preterm birth has increased with the aging of mothers and the increased use of assisted reproductive technology. Survival rates for preterm infants have increased because of the technological advances and the efforts of neonatologists. With continued decreases in the numbers of births per year,10 research and concern regarding growth and development for preterm babies during and after infancy have increased. Nevertheless, cohort studies on mortality and causes of death of preterm infants after infancy have been lacking in Korea.
Given that the decrease in child mortality of preterm infants has been slow, and considering that preterm birth is a major cause of child death, accurate understanding of the differences in child mortality and causes of death by gestational age and birth weight will be helpful in developing and implementing policies to decrease child mortality. Moreover, it will provide useful information to healthcare professionals providing care to preterm infants.
Therefore, we divided the infants born in Korea into three groups according to gestational age and birth weight and analyzed the mortality rates and causes of death up to 5 years of age.
METHODS
Inclusion criteria
Anonymized data for all live births and deaths up to 5 years of age occurring in Korea between 1 January 2010 and 31 December 2012 were available. The data included gestational age, birth weight, sex, area of birth, parental age, parental educational level, parental occupation, multiple birth, parental nationality, age at death, date of death, and the cause of death. The causes of death were classified using the Korean Standard Classification of Diseases and Causes of Death (KCD-7), as this system reflects an adaptation of the International Statistical Classification of Diseases and Related Health Problems, 10th revision to fit the circumstances in Korea.11 More specifically, the KCD-7 contains specific codes and rare disease codes that reflect the health care environment in Korea.
Exclusion criteria
Among a total of 1,425,986 infants, those born before 22 weeks of gestation (73 cases), those born with a weight of < 0.3 kg (18 cases), those with missing data on gestational age or birth weight (2,663 cases), and those with substitution of missing data (319 cases) were excluded. The analysis was conducted on 1,422,913 infants.
Statistical analysis
The infants were categorized into the following three groups according to gestational age: those born before 32 weeks' gestation (< 32 weeks), those born between 32 and 36 weeks' gestation (32–36 weeks), and those born at ≥ 37 weeks' gestation (≥ 37 weeks). They were also divided into the following three groups according to birth weight: those born weighing < 1.5 kg, those born weighing ≥ 1.5 kg but < 2.5 kg, and those born weighing ≥ 2.5 kg. Infant mortality until 1 year of age and child mortality after infancy up to 5 years of age (child mortality) were analyzed according to gestational age and birth weight, and between-group differences were analyzed using an analysis of variance.
The categorical variables used for the analysis were as follows: singleton vs. multiple; born in Seoul, Gyeonggi-do, and Incheon (Seoul metropolitan area) vs. born in other areas; parental age of 20–39 years, ≤ 19 years, or ≥ 40 years; parental educational level of high school and below vs. college and above; group 1 occupations (manager, expert or related worker, office worker, service worker, salesman, functional personnel, machine operator, or assembler) vs. group 2 occupations (manual laborer expert in farming, student, housewife, unemployed); and Korean nationals vs. non-Koreans (foreign nationals and naturalized foreigners). To determine whether these variables and the sex variables have significant correlations with infant and child mortality, χ2 tests were conducted. To determine whether mortality differed by gestational age and birth weight, even after correcting for factors that were found to influence mortality through the abovementioned analysis, a Cox proportional hazard regression model was conducted, and 95% confidence intervals (CIs) and adjusted hazard ratios (HRs) were calculated.
To investigate the survival rate under 5 years of age by gestational age and birth weight, Kaplan-Meier survival curves were constructed and compared using log-rank tests. Using KCD-7 codes, the major causes of deaths in all children were analyzed, and the major causes of infant and child deaths were analyzed by gestational age and birth weight.
A P value of < 0.05 was considered statistically significant. All analyses were performed using the software package Stata version 14.0 (StataCorp., College Station, TX, USA).
Ethics statement
The data used for this study were obtained from a cohort-linked database of mortality before 5 years of age in 1,425,986 infants born between 1 January 2010 and 31 December 2012, provided by the Microdata Integrated Service (MDIS) of Statistics Korea.12 The Statistics Korea collects not only microdata of self-produced statistics, but also microdata of other statistical agencies and research institutes in one place, and provides statistical data through the MDIS.12 The study data did not contain personal information. Institutional Review Board of Konyang University Hospital approval was obtained prior to conducting the study (approval No. 2018-06-019).
RESULTS
The demographic characteristics of the participants analyzed in this study are as follows. Among the total of 1,422,913 infants, 4,930 died at the age of < 5 years; of these, 3,987 died in infancy (0.3%) and 943 (0.1%) died in childhood (Table 1).
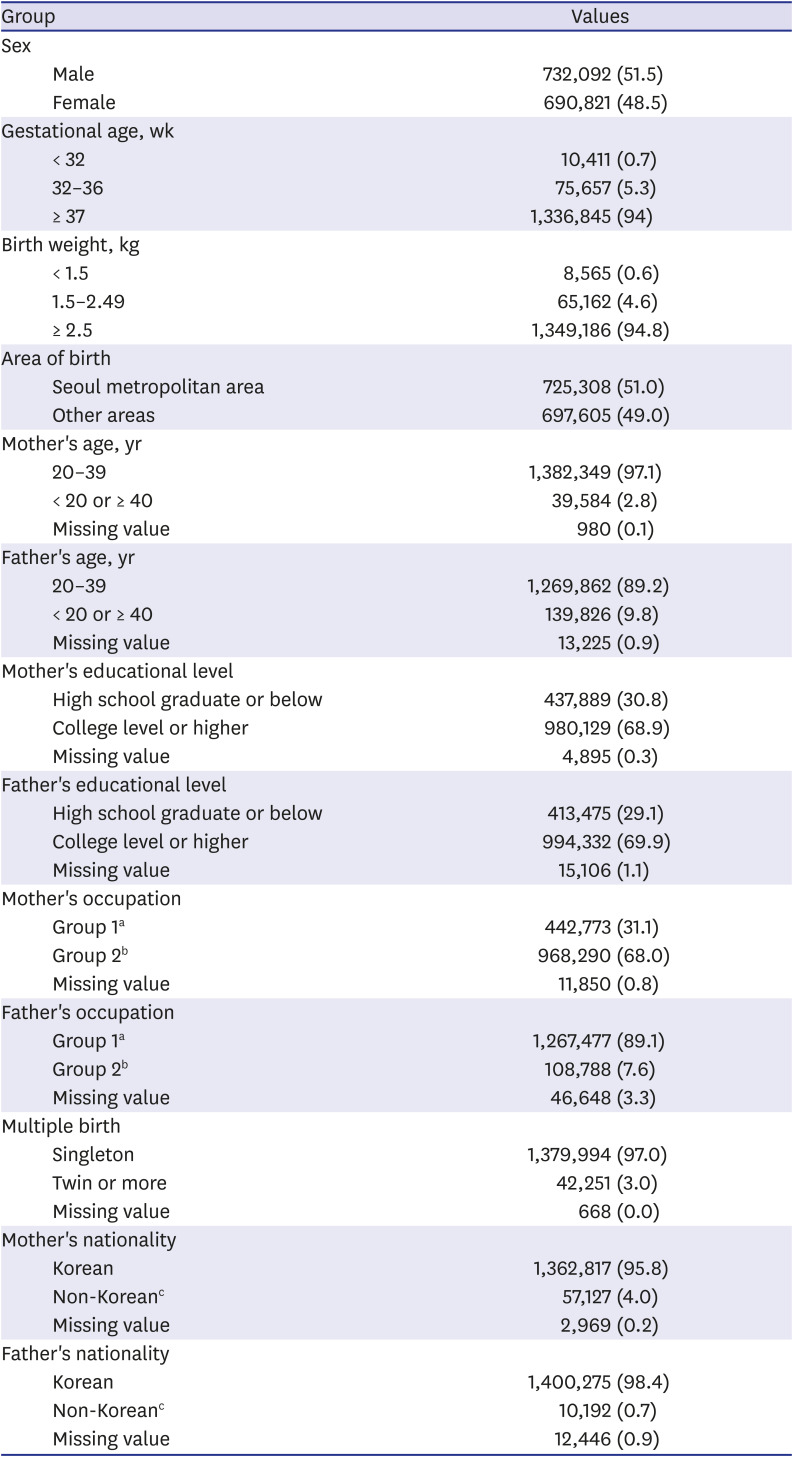
Table 1
Demographic characteristics of the study participants (n = 1,422,913)
Values are presented as number (%).
aGroup 1: manager, expert or related worker, office worker, service worker, salesman, functional personnel, machine operator or assembler; bGroup 2: manual laborer, expert in farming, students, housewife, unemployed; cNon-Korean: foreigner or naturalized foreigner.
![]()
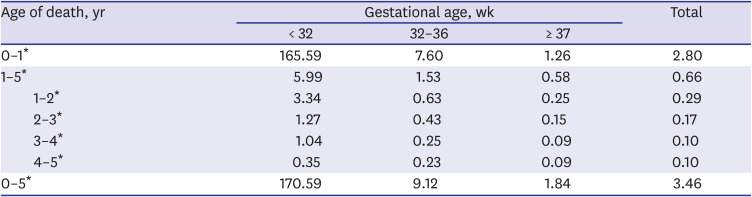
The overall mortality rate for children under 5 years of age was 3.46/1,000, with the infant mortality being 2.80/1,000 and child mortality being 0.66/1,000. Among the deaths in children under 5 years of age, the proportions of infants who died before 1 year, between 1 and 2 years, between 2 and 3 years, between 3 and 4 years, and between 4 and 5 years of age were 80.9%, 8.4%, 4.9%, 2.9%, and 2.9%, respectively. Thus, mortality tended to decrease with an increase in age.
When analyzing the data according to gestational age at the time of birth, infant mortality was 165.59/1,000 in the < 32 weeks group, 7.6/1,000 in the 32–36 weeks group, and 1.26/1,000 in the ≥ 37 weeks group. The child mortality (1–5 years of age) was 5.99/1,000 in the < 32 weeks group, 1.53/1,000 in the 32–36 weeks group, and 0.58/1,000 in the ≥ 37 weeks group. Differences according to gestational age were greater for infant mortality than for child mortality, although the child mortality was still higher in those born at an earlier gestational age. A similar pattern was observed when the mortality was compared according to birth weight (Supplementary Table 1). The differences were all statistically significant (Table 2).
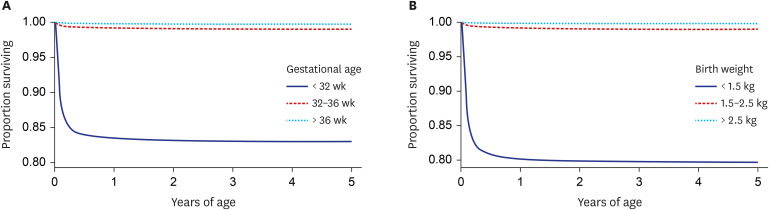
When the 5-year survival was analyzed using the survival curves for each gestational age and birth weight group, significant differences in survival were observed among the groups (Fig. 1).
We conducted a univariate analysis to investigate factors associated with mortality. Gestational age, birth weight, sex, multiple birth, area of birth, parental age, parental educational level, and parental occupation had statistically significant correlations with infant and child mortality.
Infant and child mortality were higher for children with lower gestational age, those with lower birth weight, and those who were male. Those born in multiple births (twin or more) had higher mortality rates than those born as singletons, and the mortality rate was higher for those born in areas other than the Seoul metropolitan area. The mortality rate was also higher when the parental age was < 20 or > 40 years than when the parental age was between 20 and 39 years. The mortality rate was higher in infants with parents whose educational level was high school or below than in those with parents whose educational level was college or above. The mortality rate was higher when the parental occupation was in group 2 than when the occupation was in group 1.
Although the child mortality was significantly higher when the mother was non-Korean than when the mother was Korean, no significant differences in infant mortality was observed. By contrast, the father's nationality did not yield any significant difference in terms of infant and child mortality (Table 3).
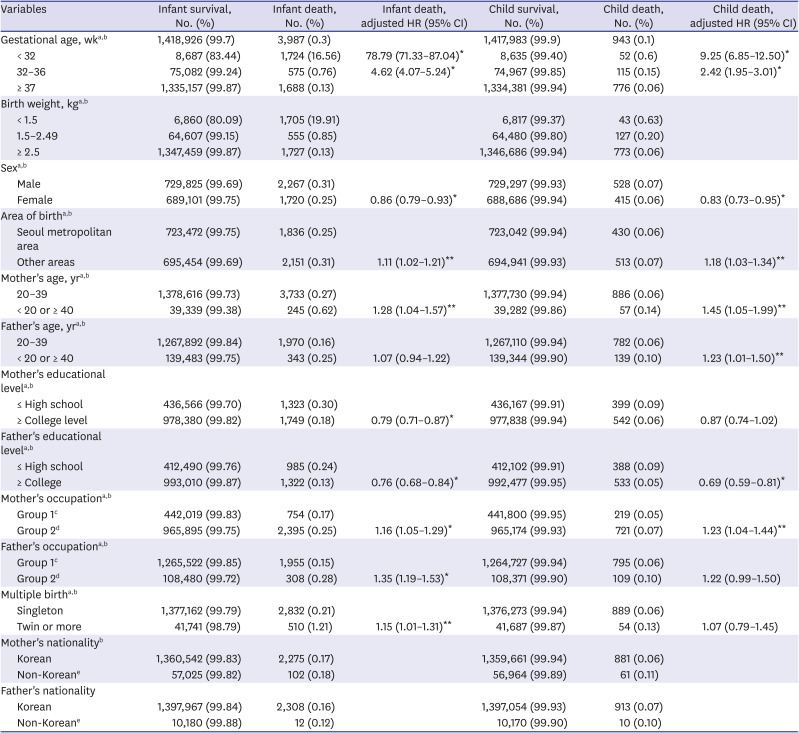
Table 3
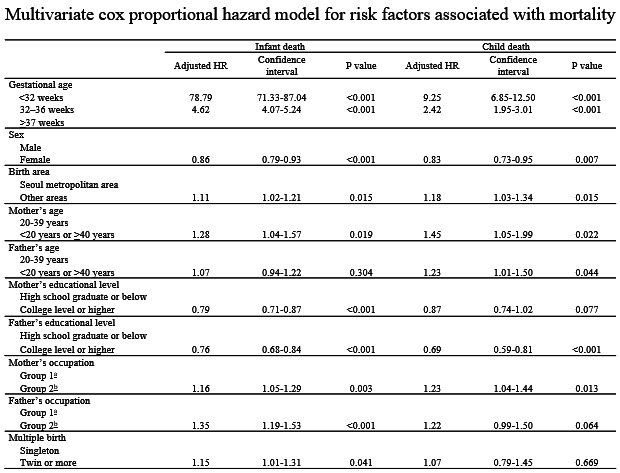
Univariate analysis of variables and multivariate cox proportional hazards model for risk factors associated with infant and child mortality
Multivariate analysis was performed on significant factors (gestational age, sex, area of birth, parental age, parental education level, parental occupation, multiple birth) in the univariate analysis.
HR = hazard ratio, CI = confidence interval.
aStatistically associated variables with infant mortality in the univariate analysis (χ2, P<0.05); bStatistically associated variables with child mortality in the univariate analysis (χ2, P < 0.05); cGroup 1: manager, expert or related worker, office worker, service worker, salesman, functional personnel, machine operator or assembler; dGroup 2: manual laborer, expert in farming, students, housewife, unemployed; eNon-Korean: foreigner or naturalized foreigner.
*P < 0.01; **P < 0.05.
![]()
In the multivariate analysis of factors that were significant in the univariate analysis, gestational age showed the highest HR for infant mortality (78.79 and 4.62 for the < 32 weeks and 32–36 weeks groups, respectively, versus the full-term group). Sex, area of birth, mother's age, parental educational level, parental occupation, and multiple birth were found to influence infant mortality rates. In the Cox proportional hazards regressions, the analysis was conducted in 1,370,652 infants, excluding 52,261 missing cases (3.7% of total cases).
Gestational age also showed the highest HR for child mortality (adjusted HR of 9.25 and 2.42 for the < 32 weeks and 32–36 weeks groups, respectively, versus the full-term group). Sex, area of birth, parental age, father's educational level, and maternal occupation had significant correlations with child mortality (Table 3). In the Cox proportional hazards regressions, the analysis was conducted in 1,368,412 children, excluding 50,514 missing cases (3.6%), out of 1,418,926 cases, excluding cases of infant deaths.
When the causes of death of the 4,930 children were confirmed, the analysis yielded the following results. Conditions originating in the perinatal period were the most common causes of death (44.1%); 59% of these were respiratory distress of newborn (19.43%) and other respiratory disorders specific to the perinatal period (6.67%). The second most common cause of death was congenital malformations, deformations, and chromosomal abnormalities (18.48%), 40% of which were cardiac congenital malformations. The third most common cause of death was unknown (9.63%), followed by injury, poisoning, and other consequences of external causes (8.66%), and diseases of the nervous system (4.52%) (Table 4).
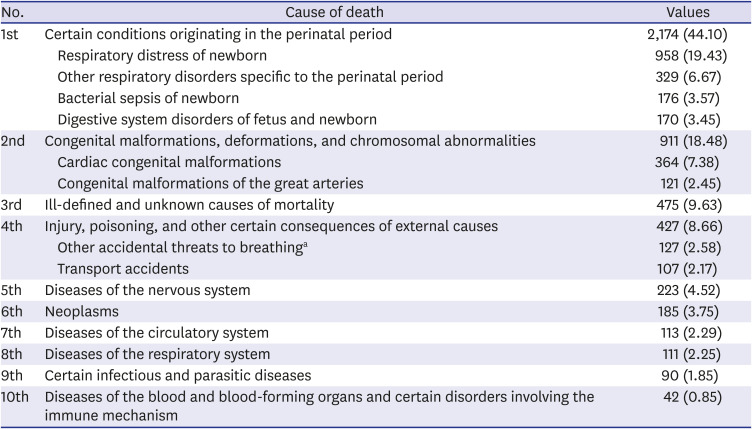
Table 4
Top 10 causes of death in children under 5 years of age
Values are presented as number (%).
aOther accidental threats to breathing are associated with the presence of foreign bodies in the airway and suffocation.
![]()
All causes of death were classified into infant and child deaths (1–5 years of age) and analyzed according to gestational age, as shown in Tables 5 and 6. Fifty-one cases of child deaths were excluded due to missing data.
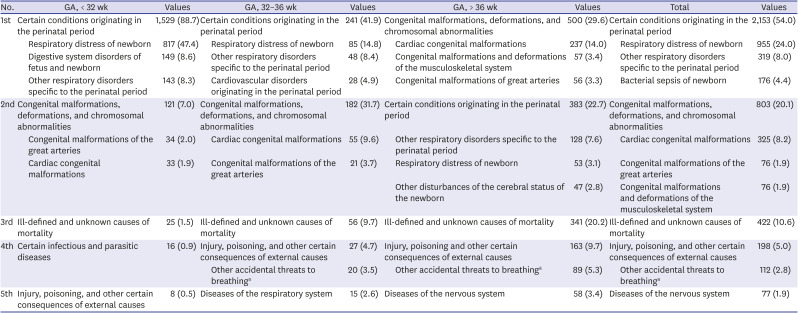
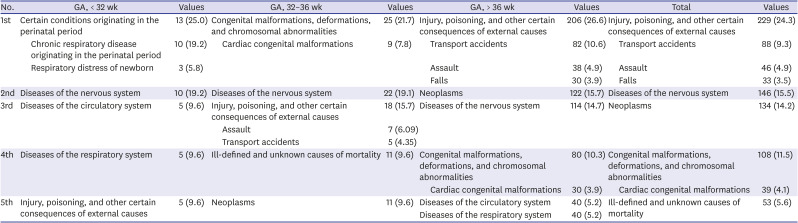
Table 5
Causes of infant death by gestational age
Values are presented as number (%).
GA = gestational age.
aOther accidental threats to breathing are associated with the presence of foreign bodies in the airway and suffocation.
![]()
Table 6
Causes of child deaths under 5 years of age by gestational age (except infant death)
![]()
Regarding the causes of infant death, perinatal conditions were the most common cause in the < 32 weeks group, accounting for 88.7% of deaths in this group. Congenital malformations, deformations, and chromosomal abnormalities followed at 7.0%. In the 32–36 weeks group, conditions originating in the perinatal period accounted for 41.9% of infant deaths, followed by congenital malformation at 31.7%. In the ≥ 37 weeks group, congenital malformations accounted for 29.6% of infant death, followed by perinatal causes at 22.7% (Table 5).
In the < 32 weeks group, conditions originating in the perinatal period accounted for 25.0% of child deaths occurring after 1 year of age and before 5 years of age, followed by diseases of the nervous system, accounting for 19.2% and diseases of the circulatory system and respiratory system, each accounting for 9.6% of deaths. In the 32–36 weeks group, congenital malformations accounted for 21.7% of child deaths, diseases of the nervous system accounted for 19.1%, and injury, poisoning, and other consequences of external causes accounted for 15.7%. In the ≥ 37 weeks group, injury, poisoning, and other certain consequences of external causes accounted for 26.6% of child deaths, neoplasms accounted for 15.7%, and diseases of the nervous system accounted for 14.7% (Table 6).
Differences in the causes of death according to birth weight were confirmed for infant and child deaths, and the results were similar to those obtained for gestational age (for the causes of death by birth weight, please refer to Supplementary Tables 2 and 3). The other less common causes of death are presented in Supplementary Tables 4 and 5.
DISCUSSION
We assessed the effects of gestational age and birth weight on mortality rates for children under 5 years of age as well as causes of death. Of all cases of under-five year deaths, 80.9% occurred in those aged < 1 year and 19.1% in those aged > 1 year. Both infant and child mortality were higher in the low gestational age and birth weight groups than in the high gestational age and birth weight groups. The adjusted HR for infant death adjusted for the effects of other variables was 4.62 in the 32–36 weeks group and was very high at 78.79 in the < 32 weeks group, when compared to the ≥ 37 weeks group; this finding was similar to the results of a previous study.13 The adjusted HR for child death was 2.42 in the 32–36 weeks group and 9.25 in the < 32 weeks group, when compared to the ≥ 37 weeks group, still showing great differences in the HR depending on gestational age. Compared to the risk from other factors that affect mortality, these risks were very much higher.
Moreover, although not shown in the results, we compared the mortality rates based on the corrected and chronological ages. Based on the corrected age, the infant mortality rate slightly increased while the child mortality rate decreased in lower gestational age groups. However, differences in mortality rates between the gestational age groups were still significant.
A previous study reported a significant correlation between low birth weight and mortality until the age of 4 years, but no similar relationship was observed after this age.14 Similarly, in our study, the differences in mortality according to gestational age and birth weight decreased with increasing age. However, another recent study reported that low birth weight was related to mortality in infancy and adolescence8; in the present study, the mortality rate for children under 5 years of age was also higher for those born preterm than for those born at term. Future studies will need to follow these infants until adolescence.
In our study, variables, other than gestational age and birth weight, that influenced infant death were maternal age, parental educational level, parental occupation, multiple birth, sex, and area of birth. Other variables associated with increased child mortality were parental age, father’s educational level, mother's occupation, sex, and area of birth. These variables serve as additional interventional targets to reduce the mortality risk of preterm infants. Mother's occupation was a factor affecting both infant and child mortality, with a higher mortality rate observed in children whose parental occupation was classified in group 2 than in those children whose parental occupation was categorized in group 1. The high mortality rate observed in children whose parental occupation was classified in group 2 that includes housewives, which still account for a large proportion of the Korean mothers' occupation, can be considered as a result of the relatively higher socioeconomic status in group 1 than in group 2. However, there is a limitation that the parent’s data is based on the time of birth and doesn’t reflect the situation afterwards.
The causes of death also varied depending on gestational age and birth weight. In terms of the causes of infant death, certain conditions originating in the perinatal period were the most common cause, accounting for 88.7% and 41.9% of infant deaths in the < 32 and 32–36 weeks groups, respectively. In contrast, in the ≥ 37 weeks group, certain conditions originating in the perinatal period accounted for 22.7% of infant deaths, following congenital malformation (29.6%); in other words, the order of causes changed, and perinatal conditions accounted for significantly less deaths compared to the pattern observed in preterm infants. These results demonstrate that most cases of infant deaths are more closely associated with perinatal causes in those born at a younger gestational age.
The causes of child deaths were more varied compared to the causes of infant deaths. In the < 32 weeks group, in contrast to the other groups, conditions originating in the perinatal period were the most common cause of death (25.0%). This suggests that infants born at a younger gestational age are influenced by perinatal factors even after infancy, similar to the results reported by Watkins et al.8 The specific perinatal causes of death after 1 year of age in the < 32 weeks group included chronic respiratory disease originating in the perinatal period and respiratory distress of the newborn; most of these involved respiratory complications, and all of the infants died before the age of 3 years. By contrast, in the 32–36 and ≥ 37 weeks groups, most cases of child deaths from conditions originating in the perinatal period involved neurological complications, including neonatal cerebral leukomalacia and hypoxic ischemic encephalopathy of the newborn (Supplementary Table 6). Such differences in perinatal causes according to gestational age suggest that immature lungs are a major cause of death in preterm infants. Of note, only a small number of cases of child deaths from conditions originating in the perinatal period were available (13 in the < 32 weeks group, 1 in the 32–36 weeks group, and 7 in the ≥ 37 weeks group), warranting the necessity of further research. Moreover, the number of deaths resulting from diseases of the circulatory (9.6%) and respiratory systems (9.6%) was higher in the < 32 weeks group than in the other gestational age groups. This may be due to the fact that the pulmonary hypertension is associated with poor cardiopulmonary outcome in preterm infants.151617 The results also support previous research findings demonstrating that pulmonary dysplasia and the complications of immature lungs continue to affect children beyond infancy and are associated with poor lung function.1819 Previous studies have reported the association between preterm birth and long-term respiratory diseases, hypertension, and metabolic diseases in adulthood, and others have reported continued respiratory impairment even in preterm infants that were not diagnosed with bronchopulmonary dysplasia.181920212223242526 In the present study, mortality rates from respiratory and circulatory diseases were relatively high among child deaths in preterm infants. These findings suggest that future studies are needed to assess the mortality and prevalence of long-term respiratory, cardiovascular, and metabolic diseases in preterm infants.
The most common cause of child deaths in the 32–36 weeks group was congenital malformation (21.7%), including cardiac malformation, followed by nervous system disease (19.1%) and injury, poisoning, and other certain consequences of external causes (15.7%). The most common cause in the ≥ 37 weeks group was injury, poisoning, and other certain consequences of external causes (26.6%), followed by neoplasms (15.7%) and nervous system diseases (14.7%). These findings suggest that the main causes of child death varied among the different gestational age groups.
This study has few limitations. First, given that the study data were limited to those aged younger than 5 years, differences in mortality rates into adolescence could not be analyzed. Second, to evaluate the long-term complications and prognosis of preterm birth, additional research and analysis of mortality as well as clinical information regarding prevalence and treatment status of common diseases is required. Third, given that our data only included socioeconomic factors and death, socioeconomic factors (environmental factors) associated with child mortality could be confirmed, and an analysis of clinical information could not be performed, limiting the extent of regression analysis on factors that might influence infant and child mortality.
Despite these limitations, using what we believe to be the largest and most recent population-based cohort that has been used to survey Korea, the present study investigated mortality rates and causes of death under 5 years of age in children born in Korea, demonstrating that gestational age and birth weight are clearly associated with infant and child mortality.
We identified varying trends in death depending on gestational age; the major causes of infant death in the < 32 weeks group were related to perinatal causes that were important even in childhood, especially respiratory complications. Circulatory and respiratory diseases were common causes of child death in this group, compared to other groups. In the 32–36 and ≥ 37 weeks groups, congenital malformations, in addition to perinatal causes, were major causes of infant deaths. Perinatal causes accounted for a very small number of cases of death after 1 year of age. In the 32–36 weeks group, congenital malformation, nervous system disease, and injury and poisoning were major causes of child deaths, whereas injury and poisoning, neoplasms, and nervous system diseases were major causes of child deaths in the ≥ 37 weeks group.
For the care of preterm infants, especially those born at < 32 weeks' gestation, particular attention and continuous monitoring are needed in consideration of the major causes of deaths (such as certain conditions originating in the perinatal period) not only in infancy but also in childhood. Proactive national healthcare policies that address the major causes of death should be implemented to further improve the survival rates, with the ultimate aim of improving the quality of health of children.
 XML Download