

 PDF
PDF Citation
 Print
Print


INTRODUCTION
The coronavirus disease 2019 (COVID-19) pandemic has posed severe global health challenges with substantial damage to the world economy. Until April 17th, 2020, approximately 2 million confirmed cases and more than 139,000 deaths were reported worldwide,1 while the global gross domestic product was estimated to have declined by 2%–4%.2 Importantly, asymptomatic cases tend to be under-reported, representing between 18%3 to more than 50%4 of all cases; hence, the extent of the disease burden could be significantly greater than the reported figures.
Korea has also experienced a COVID-19 outbreak, with the first imported case reported on January 20th. In the early phase of the epidemic, the majority of cases were imported, and only a small proportion of cases were attributed to local transmission.5 However, the number of cases surged after February 18th, following a religion-related super-spreading event.6 From February 18th to March 10th, approximately 350 new confirmed cases daily were reported on average; the number of new cases reached a peak on February 29th, with 814 confirmed cases. During this period, the rapid rise in confirmed COVID-19 cases exceeded the medical capacities.
Various non-pharmaceutical interventions (NPIs) were implemented to minimize the local transmission and flatten the epidemic curve. NPIs included suppression strategies7 such as the distribution of facial masks, social distancing campaigns, extensive diagnostic testing, and intensive contact tracing. These suppression strategies have been mostly successful, as the epidemic curve of COVID-19 in Korea was flattened more quickly than in other countries that experienced large-scale outbreaks. From March 11th to April 1st, the daily new confirmed cases declined to approximately 100, on average; as of April 2nd, the number of daily new cases has been below 100, most of which are imported cases. Considering that Korea did not implement mandatory lockdown or travel restrictions within the country, the successful epidemic control in March and April in Korea suggests the strong benefits of NPIs. In this study, we assessed the effectiveness of NPIs using mathematical simulation models. Specifically, we evaluated the effectiveness of social distancing among adults, spring semester postponement for elementary, middle and high schools, intensive contact tracing, and large-scale diagnostic testing.
METHODS
Development of a simulation model
A discrete-time compartment model was used to categorize the population into five states: susceptible (S), exposed (E), infectious (I), quarantined (Q), or hospitalized (H). Susceptible and exposed are those individuals who have never been infected with COVID-19, and those who were in the latent period after coming into contact with infectious patients, respectively. Individuals in the exposed state then transits to either quarantined or infectious state. Transition to the quarantined state means that the infected people who are in the incubation period were quarantined before they develop infectiousness by contact tracing from epidemiological investigations. Transition to the infectious state indicates the development of infectiousness to susceptible individuals. Individuals in both infectious and quarantined states transit to hospitalized state which means isolation after confirmation of COVID-19 and the end of infectiousness.
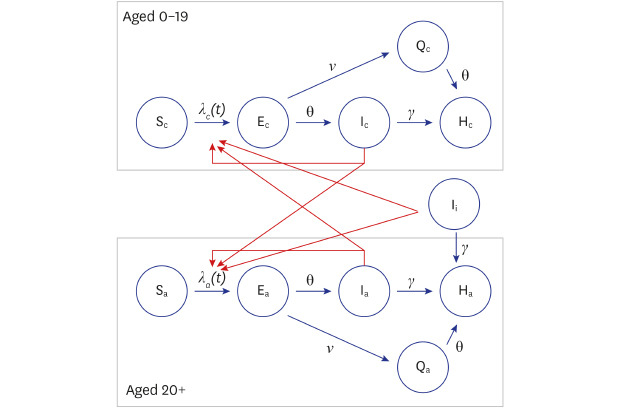
Considering that one of the purposes of this study was the effectiveness of spring semester postponement, we further stratified each group into two subgroups according to the age (0–19 and 20+). This enabled us to simulate the lack of spring semester postponement by applying higher contact rates only to individuals aged 0–19. We also included a compartment for imported cases, which increased the force of infection for both age groups. Therefore, 11 compartments were included in the analysis; S, E, I, Q, and H for each age group and the imported cases. A schematic diagram of the meta-population compartment model with the SEIQH structure is shown in Fig. 1, and incorporated equations are described in detail in Supplementary Material 1.
Fig. 1
Schematic diagram of the compartment model used in this study.
The population was categorized into five states: susceptible (S), exposed (E), infectious (I), quarantined (Q), and hospitalized (H). The population was also stratified according to age: aged 0–19 (subscript “c”) and aged 20+ (subscript “a”). Four types of parameters were used to determine the transition rates between the different states: the rate at which exposed individuals become infective (parameter θ), the detection (or isolation) rates of infectious individuals (parameter γ), quarantine probability (parameter ν), and the force of infection (parameter λ), which was time-varying and dependent on the number of infectious individuals and their effective contact rates.
![]()
Four types of parameters were included in the model: the rate at which exposed individuals become infectious (θ), detection rate (γ), quarantine probability (υ), and effective contact rate (β). The rate at which exposed individuals become infectious was reciprocal with the latent period; thus, the time between exposure and onset of infectiousness reflected the probability of transition from the exposed (E) to infectious (I) state in a given time unit. The latent period was employed as 4.5 days, considering that the incubation period was reported as 5.5 days8 and infectiousness could be developed one day before presenting symptoms.9 The detection rate was reciprocal with the infectious period, reflecting the time between the onset of symptoms and isolation. The infectious period used was 5.8 days, as the reported time gap between symptom onset and isolation is 4.8 days10 and the assumption that infected individuals start transmitting the virus one day before presenting symptoms.9 Quarantine probability was defined as the proportion of quarantined people detected by contact tracing before they became infectious. The probability was set to 4% as status quo, considering that 4% of confirmed cases were detected before symptom onset in Gyeonggi-do.10
Effective contact rate is the product of contact rate and transmission probability per contact. As we used a discrete-time model for our analyses, the effective contact rate indicated the number of people who were infected by one infectious patient per time unit (day). Due to the heterogeneity in the number of contacts between infectious individuals and between time periods, we employed time-dependent effective contact rates. Different effective contact rates were used for each week for individuals aged 20+, and for each month for individuals aged 0–9. Considering that the effective contact rate was not measurable, we estimated the time-varying effective contact rate by calibrating the model using daily reported confirmed cases. Calibration was performed using a Monte-Carlo-Markov-Chain algorithm1112 with Gibbs sampling. The parameters used in this study and their values are summarized in Table 1.
Table 1
Parameters used in this study
aLatent period was assumed as 4.5 days, considering that the reported incubation period of the virus is 5.5 days and that infected individuals start transmitting the virus one day before presenting symptoms; bInfectious period was assumed to be 5.8 days, considering that the reported time between the onset of symptoms and isolation is 4.8 days and that infected individuals start transmitting the virus one day before presenting symptoms; cQuarantine probability indicates the probability of quarantine for infected individuals before their infectiousness; dParameters for effective contact rates were estimated by calibration with reported data of confirmed COVID-19 cases using Monte-Carlo-Markov-Chain algorithm.
![]()
In this study, we included data from February 12th, six days before the first case of the religion-related large cluster was reported, reflecting the time gap between the onset of infectiousness and isolation the study period was seven weeks (until March 31st). The early phase of the COVID-19 epidemic (From January 20th to February 11th) was excluded because the local transmission was not significant at that time.
Evaluation of NPI effectiveness
In this study, we evaluated the effectiveness of various NPIs, including social distancing in adults, spring semester postponement, diagnostic testing, and contact tracing, using the developed mathematical model and scenario analysis.
Weekly effective contact rates among adults within the study period were estimated by model calibration. Regarding the estimated rates as status quo, increased effective contact rates were applied to simulate an epidemic situation by reduced intensity of social distancing in adults. To assess the effectiveness of social distancing after the religious gathering-related event, which was expected to increase the effective contact rate between weeks 1 and 2, we performed scenario analysis by applying an increased contact rate between weeks 3 and 7. As a severe-case scenario, we assumed a two times higher effective contact rate than the maximum estimated effective contact rate between weeks 3 and 7. As a mild-case scenario, we assumed an effective contact rate equal to the maximum estimated effective contact rate between weeks 3 and 7.
Spring semester initiation at the usual time (March 2nd) in elementary, middle, and high schools would have increased the contact rates among children and adolescents. Herein, by estimating the level of increase in the contact rates, we determined the effectiveness of the spring semester postponement. To this end, we used varicella incidence data from the Korea Centers for Disease Control and Prevention (KCDC). Although etiology and transmissibility differ between the two diseases, we assumed an equivalent contact rate ratio before and after the school semester. KCDC provided weekly reported varicella incidence in individuals younger than 20 years old. Using simple susceptible-exposed-infectious-recovered (SEIR) compartment model with time-dependent effective contact rate, we estimated contact rate ratio (k1) between before (January and February) and after school opening (March and April) in 2019 and contact rate ratio (k2) between January and February in 2020. The ratio “k1” represented an increased contact rate after the opening semester in the previous year (without COVID-19). The ratio “k2” was used as an estimate of contact rate decrease, by comparing the contact rate in January (when the outbreak was not severe) and February (when voluntary social distancing was rampant in Korea). In the scenario analysis, we applied a k1*(1/k2) times higher effective contact rate to child and adolescent groups from March 2nd to March 31st. The scenario analysis is described in detail in Supplementary Material 2.
Extensive contact tracing and diagnostic testing could reduce the risk of secondary transmission by quarantining exposed individuals before they become infectious and reducing the infectious period of COVID-19 patients. Non-extensive contact tracing and diagnostic testing were simulated by applying a decreased detection rate (increased infectious period) and quarantine probability. As an increased infectious period, we used 9.09 days because 8.09 days was the longest reported time between symptom onset and isolation,13 and infected individuals can start transmitting the virus one day before presenting symptoms.9 The decreased level of quarantine probability was set to 2% (half of the status quo).
Two sensitivity analyses were implemented considering uncertainty of parameters. The time gap between onset of infectiousness and symptoms was assumed as 2 days in the first sensitivity analysis. In the second sensitivity analysis the time gap between onset of symptoms to detect or isolation was assumed as 3 days following report from Ki et al.5 and the assumption for the first sensitivity analysis was also applied.
RESULTS
Model calibration and estimation of time dependent effective contact rates
The calibration results of the developed model are illustrated in Fig. 2. The simulated number of daily new confirmed cases fit, with reasonable accuracy, the reported data. A strong positive correlation was also shown with Pearson correlation coefficients of 0.915 and 0.953 for individuals aged 0–19 and 20+, respectively. The estimated time-varying effective contact rates in individuals aged 0–19 were 0.071 (95% credible interval [95% CrI] = 0.052–0.089) and 0.032 (95% CrI = 0.025–0.039) for February and March, respectively. The estimated effective contact rates among individuals aged 20+ were 6.132 (95% CrI = 5.937–6.366), 1.346 (95% CrI = 1.263–1.427), 0.000 (95% CrI = 0.000–0.002), 0.000 (95% CrI = 0.000–0.001), 0.038 (95% CrI = 0.021–0.056), 0.249 (95% CrI = 0.205–0.289), and 0.035 (95% CrI = 0.002–0.071) for each week. The convergence diagnostics and posterior distribution for each estimated parameter are provided in Supplementary Material 3.
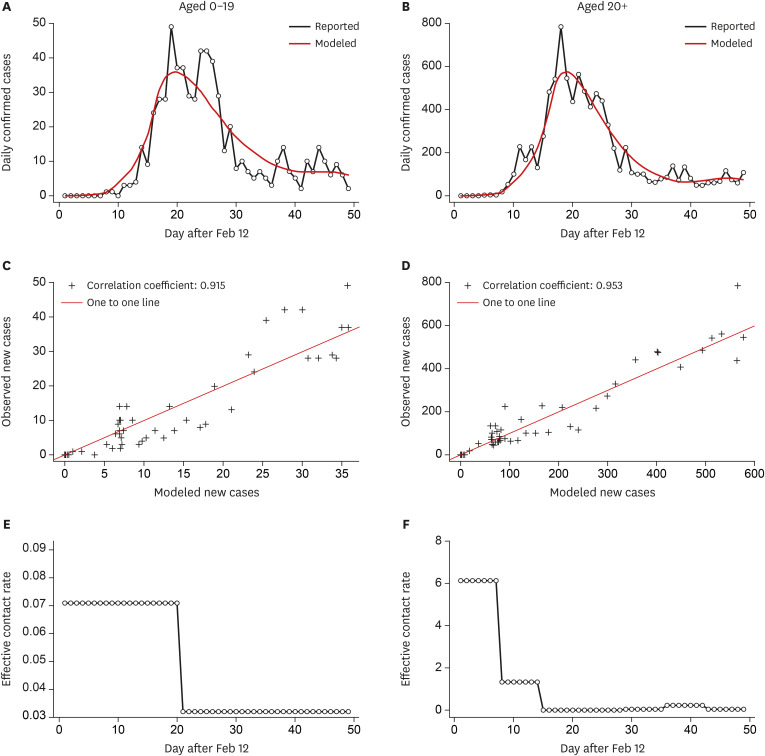
Fig. 2
Calibration of the simulation model using the number of reported confirmed cases.
(A, B) Calibration of the simulation model (red) using the daily reported new cases (black) in individuals aged 0–19 (A) and 20+ (B). (C, D) Pearson correlation analysis showing a strong positive correlation between the simulated number and the number of reported new cases. (E, F) The time-varying effective contact rates were estimated using the Monte-Carlo-Markov-Chain algorithm.
![]()
Evaluation of the effectiveness of NPI
In this study, we estimated the expected epidemic size of COVID-19 in Korea, if social distancing among adults in March was more relaxed while maintaining the effective contact rate at a higher level than the status quo (Fig. 3). The effective contact rate in week 6 (beta 8) showed the higher estimate than those in other weeks (beta 3–9). In the severe-case scenario, where the effective contact rates in weeks 3–7 were assumed as two times higher than estimated beta 8 (0.498, 95% CrI = 0.410–0.578), 252,011 cases (95% CrI = 136,882–431,181) would have been confirmed by the end of March, which is approximately 27 times more than the status quo. In the mild-case scenario, where the effective contact rates in weeks 3–7 were assumed as same as estimated beta 8, 41,688 cases (95% CrI = 30,302–56,224) would have been confirmed by the end of March, which is approximately 4.5 times more than the status quo.
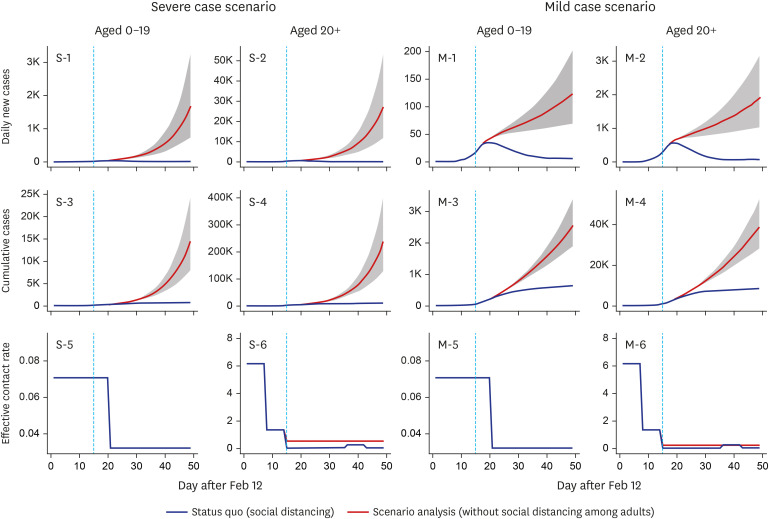
Fig. 3
Effectiveness of social distancing as determined by scenario analyses.
Note: The effectiveness of social distancing among adults was estimated by increasing the effective contact rate in individuals aged 20+. In the severe-case scenario, the effective contact rate in weeks 3–7 was assumed to be 0.497 (95% credible interval = 0.410–0.578), which was two times higher than the maximum estimated effective contact rate in weeks 3–7. In the mild-case scenario, the effective contact rate in weeks 3–7 was assumed to be 0.249 (95% credible interval = 0.205–0.289), which was equal to the maximum effective contact rate estimated for weeks 3–7.
![]()
We also simulated the epidemic size in Korea, in the case that the spring semester would begin on March 2nd, as usual (Fig. 4). Using varicella incidence in 2019 and 2020 as a model, we found that non-postponement of the semester would have increased the contact rate 2.407-fold (95% CrI = 2.140–2.688) in the severe-case scenario and 1.752-fold (95% CrI = 1.701–1.801) in the mild-case scenario (Supplementary Material 2). Using scenario analysis for the contact rate ratio of COVID-19, we showed that the number of confirmed cases among individuals aged 0–19 would have been 1,090 (95% CrI = 1,001–1,197) and 890 (95% CrI = 877–903) assuming the severe-case scenario and mild-case scenario, respectively. These estimates are 1.71 times and 1.39 times higher than the status quo, respectively.
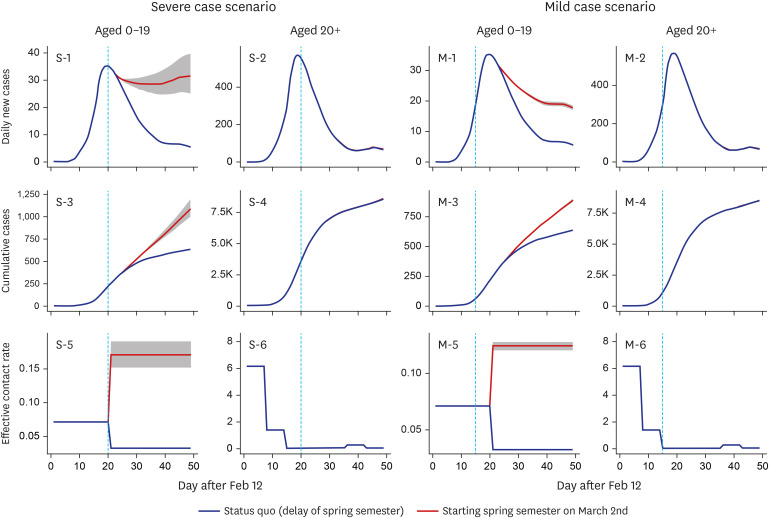
Fig. 4
Effectiveness of spring semester postponement as determined by scenario analyses.
The effectiveness of the spring semester postponement was estimated by increasing the effective contact rate among individuals aged 0–19. In the severe-case scenario, the highest effective contact rate between March 2nd and March 31st was 0.170 (95% credible interval = 0.151–0.190), which was 2.39 times higher than the effective contact rate estimated for February. In the mild-case scenario, the estimated effective contact rate from March 2nd to March 31st was 0.124 (95% credible interval = 0.120–0.127), which was 1.75 times higher than the effective contact rate estimated for February.
![]()
Less strict quarantine measures and less extensive diagnostic testing would have resulted in 12,741 confirmed cases by the end of March, which is 1.39 times higher than the status quo (Fig. 5). If the detection time (time between the onset of symptoms and isolation) was reduced to 4 days and the quarantine probability was increased to 10%, more than 3,000 cases could have been averted by the end of March. However, if the isolation of infected individuals was delayed to 8 days, and the quarantine probability was reduced to 2%, more than 2,500 additional cases would have been reported by the end of March. The parameters used in the scenario analysis are detailed in Table 2, and the results are summarized in Table 3.
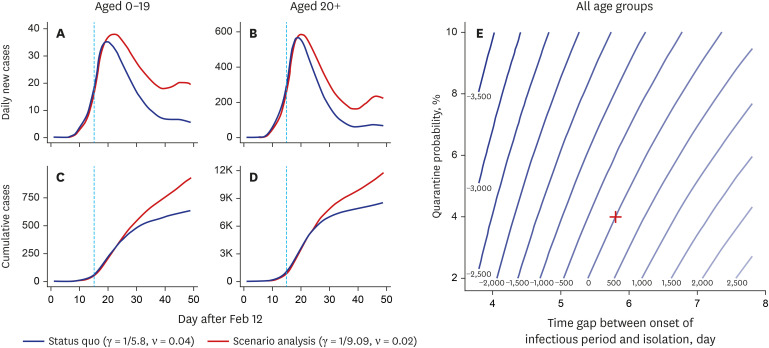
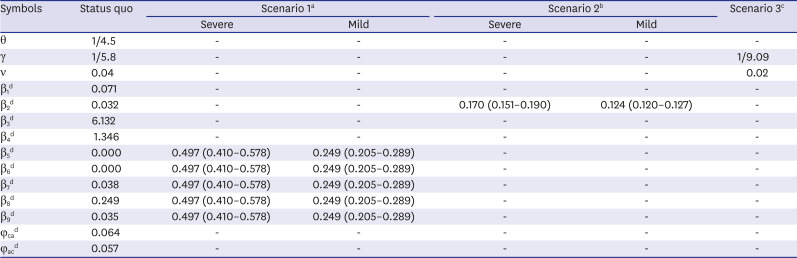
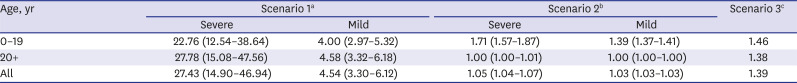
Fig. 5
Effectiveness of extensive diagnostic testing and contact tracing as determined by scenario analyses.
(A-D) The effectiveness of extensive diagnostic testing and contact tracing was estimated by decreasing the quarantine probability and detection rate. In the scenario analysis, the quarantine probability was reduced to 2%, which was half the status quo (4%). Additionally, the detection rate was reduced to 1/9.09, reflecting a longer infectious period (9.09 days) than the status quo (5.8 days). (E) Contour plot illustrating the variations in the additional cumulative cases by the end of March.
![]()
Table 2
Parameters used to evaluate the effectiveness of non-pharmaceutical interventions to control COVID-19 in Korea
aScenario 1 employed a higher effective contact rate among individuals aged 20+ in weeks 3–7 (β5 to β9) to evaluate the effectiveness of social distancing. In mild case scenario, β8 which is the highest effective contact rate among β5-9, was applied to β5-9. In severe case scenario, twice higher effective contact rates were assumed than mild case scenario; bScenario 2 employed a higher effective contact rate among individuals aged 0–19 in March (β2) to evaluate the effectiveness of school opening postponement. The increase level of effective contact rate for the school opening scenario was obtained from increase level of effective contract rate by school opening in March 2019 using a mathematical model for varicella among adolescence; cScenario 3 employed a lower detection rate (γ) and quarantine probability (ν) to evaluate the effectiveness of extensive diagnostic testing and contact tracing; dEffective contact rate-related parameters for status quo were estimated by calibration with reported data of confirmed COVID-19 cases.
![]()
Table 3
Estimated relative number of cumulative cases until the end of March in different scenarios
aScenario 1 employed a higher effective contact rate among individuals aged 20+ in weeks 3–7 (β5 to β9) to evaluate the effectiveness of social distancing; bScenario 2 employed a higher effective contact rate among individuals aged 0–19 in March (β2) to evaluate the effectiveness of school opening postponement; cScenario 3 employed a lower detection rate (γ) and quarantine probability (ν) to evaluate the effectiveness of massive diagnostic testing and contact tracing.
![]()
Results for sensitivity analyses were shown in Tables 4 and 5. In the first sensitivity analysis, where longer time gap between onset of infectiousness and symptoms was assumed, both effectiveness of social distancing and school opening postponement increased but that of contact tracing decreased. In the second sensitivity analysis, where longer time gap between onset of infectiousness and symptoms and shorter time gap between symptom onset and isolation were assumed, the effectiveness of social distancing decreased but the effectiveness of school opening postponement and contact tracing increased.
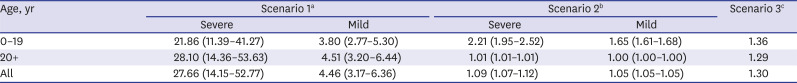
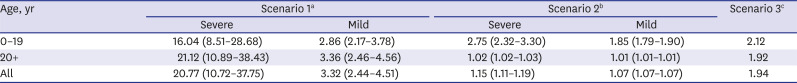
Table 4
Estimated relative number of cumulative cases until the end of March in different scenarios using increased time gap between onset of infectiousness and symptoms
The time gap between onset of infectiousness and symptoms was assumed as 2 days in a sensitivity analysis.
aScenario 1 employed a higher effective contact rate among individuals aged 20+ in weeks 3–7 (β5 to β9) to evaluate the effectiveness of social distancing; bScenario 2 employed a higher effective contact rate among individuals aged 0–19 in March (β2) to evaluate the effectiveness of school opening postponement; cScenario 3 employed a lower detection rate (γ) and quarantine probability (ν) to evaluate the effectiveness of massive diagnostic testing and contact tracing.
![]()
Table 5
Estimated relative number of cumulative cases until the end of March in different scenarios using increased time gap between onset of infectiousness and symptoms and decreased time gap between symptom onset and isolation
The time gap between onset of infectiousness and symptoms was assumed as 2 days and the time gap between symptom onset and isolation was assumed as 3 days in a sensitivity analysis.
aScenario 1 employed a higher effective contact rate among individuals aged 20+ in weeks 3–7 (β5 to β9) to evaluate the effectiveness of social distancing; bScenario 2 employed a higher effective contact rate among individuals aged 0–19 in March (β2) to evaluate the effectiveness of school opening postponement; cScenario 3 employed a lower detection rate (γ) and quarantine probability (ν) to evaluate the effectiveness of massive diagnostic testing and contact tracing.
![]()
DISCUSSION
A mathematical simulation model with a SEIQH compartment structure was developed to evaluate the effectiveness of NPI strategies for the COVID-19 epidemic in Korea, including social distancing, and extensive contact tracing and diagnostic testing. Our findings highlighted the effectiveness of the NPIs employed and indicated that a steep rise in the epidemic curve would have been observed if they had not been implemented. Notably, social distancing among adults was the most effective measure contributing to the control of the epidemic. Although the estimated effectiveness varied as different parameters were assumed, the high effectiveness of social distancing in all sensitivity analysis showed robustness of the results.
The reasonable fit of the calibrated model with reported daily new confirmed cases, from February 12th to March 31st, was shown by both visual examination and correlation analysis, although some extreme values such as 814 cases on February 29th, was not replicated by the model. Drastic reduction in the effective contact rate was estimated in both age groups in March. The decreasing trend was attributed to a decrease in contact rate rather than a decrease in transmission probability per contact because the transmissibility is not believed to be affected by the temperature.14 High contact rates among adults in weeks 1 and 2 reflected the religious super-spreading event that took place in Korea. However, the high contact rates can be overestimated because the majority of confirmed cases from the religion-related event were detected by mass diagnostic testing which increased the number of confirmed cases in a short period of time. In weeks 3 and 4, the median estimate of the contact rate was close to zero, which is unlikely in the real-life situation; hence, it should be interpreted as an extremely low mean contact rate among infectious patients. In the real-life situation, in weeks 3 and 4, extensive and large-scale diagnostic testing and preemptive quarantine were implemented, especially among the attendees of the religious gathering. Although some undetected infected individuals have spread the virus, the mean effective contact rate among all infectious individuals in that period was low. To simulate the drastic decline in new confirmed cases, a close-to-zero effective contact rate was used, which is the maximum decrease rate that the compartment model can suggest (given the constant infectious period). Although this is one of inherent limitations of compartment models, both model and real-life situation showed ‘extremely-low level’ of mean contact rate in weeks 3 and 4. In weeks 5 and 6, the effective contact rate increased; however, the rate was decreased in the subsequent week, when the Korean government recommended social distancing.
Consistent with modeling studies in different countries, scenario analysis confirmed the effectiveness of NPIs.151617 Notably, with relaxed social distancing, the number of cases could have been 4.5-27 folds higher. The estimated effectiveness reported in this study is considerably higher than a previous study that predicted a 2.6-fold higher number of infections in China in the absence of inter-city travel restrictions.17 This difference could be attributed to the early implementation of social distancing in Korea. For example, during the period of the religion-related superspreading event, strict social distancing was imposed on citizens in Daegu where the superspreading events occurred. In addition, travel to and from Daegu was reduced and voluntary social distancing had also been implemented before the government announcement of official social distancing. Consistent with this, Walker et al.7 reported that implementation of suppression strategies in the early phases of an epidemic could be five times more effective than a late phase implementation. However, the differences in methods between studies could also contribute the different results. For example, the previous study used a SEIR structure for the model but we used a SEIQH structure. In addition, the previous study estimated contact rate by population movement datasets, such as mobile phone data, which were not used in this study.
Kim et al.18 predicted that spring semester postponement would prevent at least 200 cases in March, assuming that the transmission rate would increase 10-fold after the start of the semester. This estimate was similar to the estimate of our mild-case scenario analysis, which suggested 250 additional cases among individuals aged 0–19. Additionally, both studies estimated a limited impact on adults. However, severe-case scenario analysis estimated an additional 451 cases and the new number of cases was maintained. The maintaining trend implied potential impact after beginning of the spring semester. If the number of new cases is low, then the maintaining trend would produce low-burden, but in the severe epidemic situation, the maintaining trend would give high burden.
The level of increase in the third scenario analysis was not profound, with a 1.39-fold higher predicted number of cases. Considering that a prolonged infectious period would increase the probability of super-spreading events, which was not considered in the model, the effectiveness of extensive contact tracing and diagnostic testing could have been underestimated in this study. Lai et al.17 found that early case detection and isolation could reduce the number of infections by 20%.
There are several limitations to this study. First, we added Q compartment in this study compared to SEIR model in order to evaluate the effectiveness of contact tracing. However, uncertainties for some parameters should be considered. For example, although a constant detection rate and quarantine probability were assumed, these parameters could be time-varying and can be affected by the number of daily confirmed cases. For example, high number of daily confirmed cases could exhaust capacity for epidemiological investigation which leads to a decrease in detection rate and quarantine probability. Extracting the relevant data from epidemiological studies could improve the simulation model. Second, to minimize the complexity of the model structure, we assumed a homogenous contact rate among individuals aged 20+; however, a varying contact rate among different age groups is expected.19 Third, individual characteristics, such as comorbidity, health behavior, or occupation, were not considered in our compartment models. Future agent-based model studies are required to improve the predictions reported here by incorporating individual factors. Fourth, transmissibility can be time-varying because viral load tends to change after the onset of symptoms.20 Finally, we simplified the model structure to minimize uncertainty of parameters. For example, we did not differentiate asymptomatic, pre-symptomatic and symptomatic cases in this study, and the compartment I represented all these cases for simplification. In addition, the compartments were not classified by geographical regions. Considering that the transmission probability, infectious period could be different by each type of infectious status and effective contact rate could be different by geographical regions, future studies with complex structure or microsimulation design could improve accuracy of models.
In this study, we simulated the COVID-19 epidemic in Korea from February 12th to March 31st, using a compartment model with a SEIQH structure, and estimated the time-varying effective contact rate by calibrating the model with reported daily new cases. Using the model, we estimated the effectiveness of NPIs by assuming less strict social distancing, spring semester non-postponement, or less extensive diagnostic testing and contact tracing. Without each of these NPIs, the number of COVID-19 cases would have been considerably higher, highlighting the importance of NPIs. In particular, social distancing among adults was the most effective NPI.
 XML Download