Journal List > J Korean Med Sci > v.35(38) > 1146163

Byeon, Kim, Choi, Kim, and Lee: Factors Affecting the Incidence of Hospitalized Pneumonia after Influenza Infection in Korea Using the National Health Insurance Research Database, 2014–2018: Focusing on the Effect of Antiviral Therapy in the 2017 Flu Season

Abstract

Background

This study aimed to investigate the effect of antiviral therapy following influenza outpatient episodes on the incidence of hospitalized pneumonia episodes, one of secondary complications of influenza.

Methods

In the National Health Insurance Research Database, data from July 2013 to June 2018 were used. All of the claim data with diagnoses of influenza and pneumonia were converted to episodes of care after applying 100 days of window period. With the 100-day episodes of care, the characteristics of influenza outpatient episodes and antiviral therapy for influenza, the incidence of hospitalized pneumonia episodes following influenza, and the effect of antiviral therapy for influenza on hospitalized pneumonia episodes were investigated.

Results

The crude incidence rate of hospitalized pneumonia after influenza infection was 0.57% in both males and females. Factors affecting hospitalized pneumonia included age, income level except self-employed highest (only in females), municipality, medical institution type, precedent chronic diseases except hepatitis (only in females) and antiviral therapy. In the 2017 flu season, the relative risk was 0.38 (95% confidence interval [CI], 0.29–0.50) in males aged 0–9 and 0.43 (95% CI, 0.32–0.57) in females aged 0–9 without chronic diseases, and it was 0.51 (95% CI, 0.42–0.61) in males aged 0–9 and 0.42 (95% CI, 0.35–0.50) in females aged 0–9 with one or more chronic diseases in the aspect of the effect of antiviral therapy on pneumonia. It suggests that antiviral therapy may decrease the incidence of pneumonia after influenza infection.

Conclusion

After outpatient episode incidence of influenza, antiviral treatment has been shown to reduce the incidence of hospitalized pneumonia, especially in infants and children, during pandemic season 2017. Antiviral therapy for influenza is recommended to minimize burden caused by influenza virus infection and to reduce pneumonia. In addition, medical costs of hospitalization may decrease by antiviral therapy, especially in infants and children.

Graphical Abstract

jkms-35-e318-abf001.jpg

INTRODUCTION

In Korea, the epidemic of influenza during the winter season continues every year. Surveillance monitoring of infectious disease portals operated by the Korea Centers for Disease Control and Prevention shows that the highest influenza-like-illness proportion has increased since the 2014–2015 season. In particular, the proportion of patients with 52 weeks in 2016–2017 was the highest at 86.2, and the week of 52 weeks in 2018–2019 was 73.3.1
Influenza is a high-risk patient because children under 2 years old, 65 years old or older, and people with chronic diseases are more likely to develop complications such as morbidity or pneumonia of severe influenza.2 Pneumonia due to influenza infection is a major cause of serious morbidity and mortality in children, the elderly, and chronic patients during the influenza epidemic. Primary influenza viral pneumonia occurs rarely but has a high mortality rate and secondary bacterial pneumonia is known to develop complications between 4 and 14 days3 or between 12 and 28 days4 after influenza infection.567
To reduce the incidence of complications leading to continuous medical use or pneumonia, treatment and management with antiviral agents that contains the family of neuraminidase inhibitors such as oseltamivir, zanamivir, and peramivir is important.8
Prior international studies have used claim data from medical institutions to reduce the incidence of secondary complications of respiratory diseases such as pneumonia due to the use of antiviral agents after influenza infection, and studies of the therapeutic effect of antiviral agents on influenza-related complications was confirmed to be active. On the other hand, it was difficult to find studies related to the development of pneumonia and secondary complications after influenza infection and antiviral treatment in 2009 after the H1N1 influenza in Korea. Therefore, the purpose of this study is to analyze the effects of antiviral treatment on the incidence of pneumonia, a secondary complication after influenza infection, and to use it as a basic data to reduce the incidence of influenza.
The specific purposes are to: 1) identify the epidemiological characteristics of influenza outpatient episode; 2) identify general aspects of antiviral drug prescription after influenza infection; 3) calculate the crude incidence rate (CIR) and determine the factors affecting the incidence of hospitalized pneumonia after influenza infection; and 4) identify the effect of antiviral therapy in a high-risk group on the incidence of hospitalized pneumonia in the 2017 flu season.

METHODS

The National Health Information Data of the National Health Insurance Service (NHIS) was used, and the health insurance claim data from July 2008 to June 2018 were used as of the date of medical treatment.9 Considering that the influenza disease occurs during the winter season, the measurement section was reset from July 1 each year to June 30 of the following year.
After 2009 H1N1 influenza, by checking the weekly prescription rate of antiviral drugs (oseltamivir, zanamivir) and considering the stabilizing period of the prescription rate, this study used the health insurance claims data from 2014 to 2018 (Supplementary Fig. 1). However, we used data collected from December 2016 to January 2017 to identify the effect of antiviral therapy in order to select an accurate population who received antiviral therapy based on the standard of medical care benefits. In addition, the standard of medical care benefits did not change between 2014 and 2017 and a prescription rate was the highest in December 2016 to January 2017 (Supplementary Figs. 2 and 3). The standard of medical care benefits has changed in 2018 (2017–2018 flu season).10

Constructing episode of care

Health insurance claim data are for billing purposes, in which separate claims are generated depending on the use of medical services, even though they are actually one episode. It can only be used as epidemiological data after a process of concatenating separate claims and integrating them into a single episode.
In this study, all claims diagnosed influenza and pneumonia were analyzed and grouped into one day medical episodes. The distribution of window periods showed that influenza contained 94.9% of all segregated claims and 87.8% of pneumonia within 100 days (Supplementary Figs. 4 and 5). One-hundred days were set as window periods on the assumption that claims events segregated within the same season are considered same care episode.
The conversion of billing data for each sickness to medical episode data by applying 100 days of window periods showed that although there were some differences in each year 99% of all influenza patients experienced one outbreak per year. That is, only about 1% of patients experience more than two outbreaks (Supplementary Table 1). In all cases of pneumonia, about 91% of cases experienced one outbreak per year, and only about 9% of patients experienced more than two outbreaks (Supplementary Table 2).

Case definition

All the diagnosis codes of influenza (J09–J11) and pneumonia (J12–J18) were extracted from the claims data regardless of order of diseases (Supplementary Tables 3, 4, and 5). It was because, in general, principal or secondary diagnosis is hardly assigned to influenza and pneumonia in patients with chronic diseases or inpatients (Supplementary Tables 6 and 7). The main components of oseltamivir and zanamivir are as follows (Supplementary Table 8).
From 2014 to 2018, 14,250,623 claim cases of influenza were reported in 8,484,803 cases in the same episode when grouped into cases that reclaimed within 100 days. The final influenza outpatient episode was 7,730,305 (Supplementary Table 9).
Hospitalized pneumonia after influenza infection was created using influenza outpatient episode data and pneumonia inpatient episode data. In order to measure the effect of antiviral regimen on pneumonia hospitalization after influenza outbreaks, influenza occurring concurrently or during hospitalization was excluded from the analysis. In other words, only the episodes that the first medical use of influenza through outpatient, which there were no influenza related medical treatment for at least 100 days, was analyzed. The operational definition of pneumonia hospitalization, which is highly related to influenza, was defined only as a case of pneumonia hospitalization that occurred within a maximum of 28 days after at least 1 day after influenza incidence.34 In fact, medical institutions have clearly defined the disease as a complication of pneumonia after influenza by excluding the disease code which has the same date when influenza and pneumonia occur simultaneously. The number of episodes of hospitalization of pneumonia after influenza outpatient episodes was 43,772.
Of the 7,730,305 outpatient episodes of influenza, 43,772 cases (0.6%) of pneumonia hospitalization episodes occurred within 1 to 28 days after diagnosis of influenza were analyzed (Supplementary Fig. 6).
Patients with chronic diseases are a high-risk group with a high incidence of severe influenza or complications2 and this study classified them as followed (Supplementary Table 10). In addition, before the diagnosis of influenza episodes, a claim with chronic diseases was extracted. Before the influenza diagnosis, 4,679,829 cases (60.5%) were accompanied by one or more of the chronic diseases presented in this study.
Prescription variables for antiviral drugs have been defined. The main components of oseltamivir and zanamivir of influenza therapy were used, and the number of prescription days was used (Supplementary Table 11). Presence of prescription was used as an independent variable, and it was coded ‘No’ when there was no prescription and ‘Yes’ when days of prescription was at least five. One to four days of prescriptions were excluded. Variables of hospitalized pneumonia after influenza infection have been defined. The diagnosis of influenza outpatient episodes and the diagnosis of pneumonia hospitalization episodes that exist at the same time and within in the 1 to 28-day difference of starting period, were defined as pneumonia (Supplementary Fig. 7). The variable was used as outcome. Socioeconomic factors were defined by age, type of insurer, income level by insurance type and year. Region was classified into metropolises, medium cities and rural areas. The characteristics of medical institutions were classified according to the types of medical institutions, and classified into upper general hospitals, general hospitals, and clinics. Chronic disease was a principal or secondary diagnosis, defined as tuberculosis, asthma, chronic obstructive pulmonary disease, angina pectoris, chronic ischemic heart disease, heart failure, stroke, chronic viral hepatitis, diabetes and all cancers (except thyroid cancer) (Supplementary Table 10).
Frequency analysis was performed to determine the general characteristics of influenza outpatient episodes. The χ2 test was performed to determine the difference between socioeconomic factors, medical institution characteristics, underlying comorbidity, and antiviral prescription. Finally, we confirmed the CIR of hospitalized pneumonia according to the prescription of antiviral drugs. To determine the factors affecting the incidence of hospitalized pneumonia after influenza infection, a multivariate fixed effect model analysis (poisson regression) adjusted the socioeconomic factors, medical institution characteristics, and underlying comorbidity factors was performed, and relative risk (RR) and 95% confidence intervals (CIs) were calculated. In addition, a multivariate fixed effect model analysis (poisson regression) was performed to determine the effect of antiviral therapy on incidence of hospitalized pneumonia in the 2017 flu season. All the analyzes were analyzed using SAS 9.4 (SAS Institute Inc., Cary, NC, USA), and the statistical significance level was indicated as P value less than 0.05.

Ethics statement

This study was exempted from deliberation by the Hanyang University Institutional Review Board (IRB) for the exemption from IRB deliberation that does not include personally identifiable information (HYU-2019-04-021).

RESULTS

General characteristics of influenza outpatient episodes

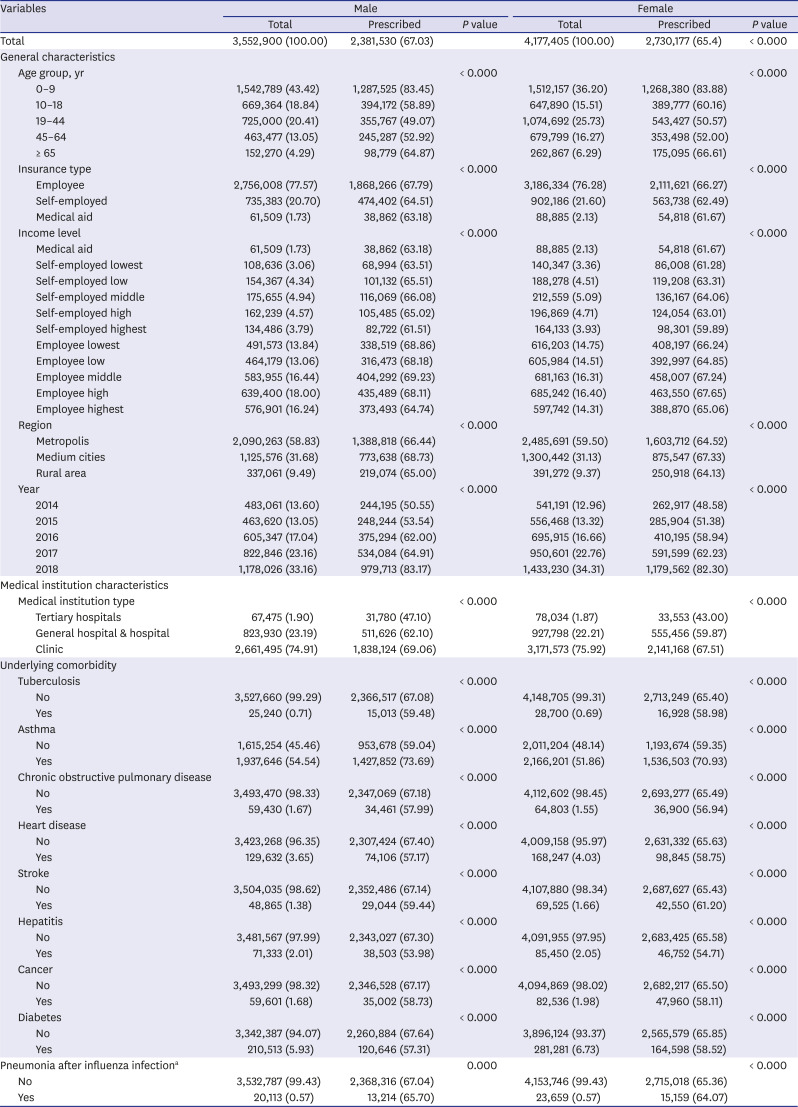
The general characteristics of influenza outpatient episodes showed that both males and females had the highest at 0–9 years of age with 43.42% and 36.20%, followed by school age (Table 1). At the income level, employee health insurance with high income were the highest, males with 18.00% and females with 16.40%. For the characteristics of medical institutions, clinics were highest among both males and females, 74.91% and 75.92%, respectively, followed by general hospitals and senior general hospitals. Preceding chronic disease in influenza outpatient episodes was highest in asthma among chronic respiratory diseases, which states 54.54% in males and 51.86% in females. In outpatient episodes of influenza, the proportion of antiviral drugs prescribed for more than five days was 67.03% for males and 65.36% for females. In addition, hospitalized pneumonia after influenza infection was 0.57% in both males and females.
Table 1

Characteristics of influenza outpatient episodes depending on antiviral prescriptions by sex

jkms-35-e318-i001
Variables Male Female
Total Prescribed P value Total Prescribed P value
Total 3,552,900 (100.00) 2,381,530 (67.03) 4,177,405 (100.00) 2,730,177 (65.4) < 0.000
General characteristics
Age group, yr < 0.000 < 0.000
0–9 1,542,789 (43.42) 1,287,525 (83.45) 1,512,157 (36.20) 1,268,380 (83.88)
10–18 669,364 (18.84) 394,172 (58.89) 647,890 (15.51) 389,777 (60.16)
19–44 725,000 (20.41) 355,767 (49.07) 1,074,692 (25.73) 543,427 (50.57)
45–64 463,477 (13.05) 245,287 (52.92) 679,799 (16.27) 353,498 (52.00)
≥ 65 152,270 (4.29) 98,779 (64.87) 262,867 (6.29) 175,095 (66.61)
Insurance type < 0.000 < 0.000
Employee 2,756,008 (77.57) 1,868,266 (67.79) 3,186,334 (76.28) 2,111,621 (66.27)
Self-employed 735,383 (20.70) 474,402 (64.51) 902,186 (21.60) 563,738 (62.49)
Medical aid 61,509 (1.73) 38,862 (63.18) 88,885 (2.13) 54,818 (61.67)
Income level < 0.000 < 0.000
Medical aid 61,509 (1.73) 38,862 (63.18) 88,885 (2.13) 54,818 (61.67)
Self-employed lowest 108,636 (3.06) 68,994 (63.51) 140,347 (3.36) 86,008 (61.28)
Self-employed low 154,367 (4.34) 101,132 (65.51) 188,278 (4.51) 119,208 (63.31)
Self-employed middle 175,655 (4.94) 116,069 (66.08) 212,559 (5.09) 136,167 (64.06)
Self-employed high 162,239 (4.57) 105,485 (65.02) 196,869 (4.71) 124,054 (63.01)
Self-employed highest 134,486 (3.79) 82,722 (61.51) 164,133 (3.93) 98,301 (59.89)
Employee lowest 491,573 (13.84) 338,519 (68.86) 616,203 (14.75) 408,197 (66.24)
Employee low 464,179 (13.06) 316,473 (68.18) 605,984 (14.51) 392,997 (64.85)
Employee middle 583,955 (16.44) 404,292 (69.23) 681,163 (16.31) 458,007 (67.24)
Employee high 639,400 (18.00) 435,489 (68.11) 685,242 (16.40) 463,550 (67.65)
Employee highest 576,901 (16.24) 373,493 (64.74) 597,742 (14.31) 388,870 (65.06)
Region < 0.000 < 0.000
Metropolis 2,090,263 (58.83) 1,388,818 (66.44) 2,485,691 (59.50) 1,603,712 (64.52)
Medium cities 1,125,576 (31.68) 773,638 (68.73) 1,300,442 (31.13) 875,547 (67.33)
Rural area 337,061 (9.49) 219,074 (65.00) 391,272 (9.37) 250,918 (64.13)
Year < 0.000 < 0.000
2014 483,061 (13.60) 244,195 (50.55) 541,191 (12.96) 262,917 (48.58)
2015 463,620 (13.05) 248,244 (53.54) 556,468 (13.32) 285,904 (51.38)
2016 605,347 (17.04) 375,294 (62.00) 695,915 (16.66) 410,195 (58.94)
2017 822,846 (23.16) 534,084 (64.91) 950,601 (22.76) 591,599 (62.23)
2018 1,178,026 (33.16) 979,713 (83.17) 1,433,230 (34.31) 1,179,562 (82.30)
Medical institution characteristics
Medical institution type < 0.000 < 0.000
Tertiary hospitals 67,475 (1.90) 31,780 (47.10) 78,034 (1.87) 33,553 (43.00)
General hospital & hospital 823,930 (23.19) 511,626 (62.10) 927,798 (22.21) 555,456 (59.87)
Clinic 2,661,495 (74.91) 1,838,124 (69.06) 3,171,573 (75.92) 2,141,168 (67.51)
Underlying comorbidity
Tuberculosis < 0.000 < 0.000
No 3,527,660 (99.29) 2,366,517 (67.08) 4,148,705 (99.31) 2,713,249 (65.40)
Yes 25,240 (0.71) 15,013 (59.48) 28,700 (0.69) 16,928 (58.98)
Asthma < 0.000 < 0.000
No 1,615,254 (45.46) 953,678 (59.04) 2,011,204 (48.14) 1,193,674 (59.35)
Yes 1,937,646 (54.54) 1,427,852 (73.69) 2,166,201 (51.86) 1,536,503 (70.93)
Chronic obstructive pulmonary disease < 0.000 < 0.000
No 3,493,470 (98.33) 2,347,069 (67.18) 4,112,602 (98.45) 2,693,277 (65.49)
Yes 59,430 (1.67) 34,461 (57.99) 64,803 (1.55) 36,900 (56.94)
Heart disease < 0.000 < 0.000
No 3,423,268 (96.35) 2,307,424 (67.40) 4,009,158 (95.97) 2,631,332 (65.63)
Yes 129,632 (3.65) 74,106 (57.17) 168,247 (4.03) 98,845 (58.75)
Stroke < 0.000 < 0.000
No 3,504,035 (98.62) 2,352,486 (67.14) 4,107,880 (98.34) 2,687,627 (65.43)
Yes 48,865 (1.38) 29,044 (59.44) 69,525 (1.66) 42,550 (61.20)
Hepatitis < 0.000 < 0.000
No 3,481,567 (97.99) 2,343,027 (67.30) 4,091,955 (97.95) 2,683,425 (65.58)
Yes 71,333 (2.01) 38,503 (53.98) 85,450 (2.05) 46,752 (54.71)
Cancer < 0.000 < 0.000
No 3,493,299 (98.32) 2,346,528 (67.17) 4,094,869 (98.02) 2,682,217 (65.50)
Yes 59,601 (1.68) 35,002 (58.73) 82,536 (1.98) 47,960 (58.11)
Diabetes < 0.000 < 0.000
No 3,342,387 (94.07) 2,260,884 (67.64) 3,896,124 (93.37) 2,565,579 (65.85)
Yes 210,513 (5.93) 120,646 (57.31) 281,281 (6.73) 164,598 (58.52)
Pneumonia after influenza infectiona 0.000 < 0.000
No 3,532,787 (99.43) 2,368,316 (67.04) 4,153,746 (99.43) 2,715,018 (65.36)
Yes 20,113 (0.57) 13,214 (65.70) 23,659 (0.57) 15,159 (64.07)
Data are presented as number (%).
aPneumonia after influenza infection: pneumonia inpatient episodes after influenza outpatient episodes.

General aspects following antiviral prescription after influenza infection

In the outpatient episodes of influenza, the general characteristics of antiviral drugs were the highest among both males and females, aged 0–9 and over 65, followed by school age and 45–64s (Table 1). At the income level, males that are employee health insurance were the highest with middle income at 69.23% and with lowest income at 68.86%. Females that are employee health insurance shown to be the highest with high income at 67.65% and middle income at 67.24%. Antiviral prescriptions were higher in recent years, with 83.17% for males and 82.30% for females in 2018. Prescriptions for antiviral drugs according to the type of medical institution were found in the order of clinics, general hospitals, and higher general hospitals. In outpatient episodes of influenza, the antiviral regimen was 73.69% and 70.93% for both males and females with asthma. Prescription for antiviral drug was high when in males, tuberculosis was 59.48%, stroke 59.44%, and in females, stroke was 61.20% and tuberculosis 58.98%. In case of hospitalized pneumonia after influenza infection, the antiviral prescription was 65.70% in males and 64.07% in females. Both males and females were found to have higher antiviral regimen in the absence of hospitalized pneumonia after influenza infection.

CIR following antiviral treatment after influenza infection

The general characteristics of incidence rate of hospitalized pneumonia after influenza infection was found to be high in males and females aged 0–9 years and over 65 years (Table 2). At the income level, males and females showed higher incidence in medical aid, and were identified as 1.06% and 1.07%, respectively. The incidence of hospitalized pneumonia was highest in both males and females in 2016, at 0.80% and 0.81%. In the type of medical institution, the incidence of hospitalized pneumonia was highest for both males and females in general hospitals at 1.26% and 1.27%, followed by senior general hospitals and clinics. In males with chronic obstructive pulmonary disease as the leading chronic disease, the incidence rate of hospitalized pneumonia was highest at 1.85%, followed by stroke 1.66% and cancer 1.23%. In females, stroke was associated with the highest incidence of 1.60%, chronic obstructive pulmonary disease 1.56%, and tuberculosis 1.28%. In case of prescribed for more than 5 days, the incidence of hospitalized pneumonia was 0.55% in males and 0.56% in females.
Table 2

Crude incidence rate of pneumonia inpatient episodes after influenza outpatient episodes by sex

jkms-35-e318-i002
Variables Male Female
Total Incidence rate Total Incidence rate
Total 3,552,900 20,113 (0.57) 4,177,405 23,659 (0.57)
General characteristics
Age group, yr
0–9 1,542,789 12,527 (0.81) 1,512,157 12,586 (0.83)
10–18 669,364 1,760 (0.26) 647,890 1,936 (0.30)
19–44 725,000 1,311 (0.18) 1,074,692 2,497 (0.23)
45–64 463,477 1,891 (0.41) 679,799 2,967 (0.44)
≥ 65 152,270 2,624 (1.72) 262,867 3,673 (1.40)
Insurance type
Employee 2,756,008 14,922 (0.54) 3,186,334 17,271 (0.54)
Self-employed 735,383 4,537 (0.62) 902,186 5,433 (0.60)
Medical aid 61,509 654 (1.06) 88,885 955 (1.07)
Income level
Medical aid 61,509 654 (1.06) 88,885 955 (1.07)
Self-employed lowest 108,636 823 (0.76) 140,347 1,115 (0.79)
Self-employed low 154,367 1,075 (0.70) 188,278 1,192 (0.63)
Self-employed middle 175,655 1,087 (0.62) 212,559 1,307 (0.62)
Self-employed high 162,239 846 (0.52) 196,869 1,053 (0.54)
Self-employed highest 134,486 706 (0.53) 164,133 766 (0.47)
Employee lowest 491,573 3,034 (0.62) 616,203 3,533 (0.57)
Employee low 464,179 3,033 (0.65) 605,984 3,643 (0.60)
Employee middle 583,955 3,501 (0.60) 681,163 4,003 (0.59)
Employee high 639,400 3,211 (0.50) 685,242 3,567 (0.52)
Employee highest 576,901 2,143 (0.37) 597,742 2,525 (0.42)
Region
Metropolis 2,090,263 10,466 (0.50) 2,485,691 12,214 (0.49)
Medium cities 1,125,576 7,067 (0.63) 1,300,442 8,372 (0.64)
Rural area 337,061 2,580 (0.77) 391,272 3,073 (0.79)
Year
2014 483,061 3,335 (0.69) 541,191 3,705 (0.69)
2015 463,620 3,094 (0.67) 556,468 3,530 (0.63)
2016 605,347 4,826 (0.80) 695,915 5,648 (0.81)
2017 822,846 3,216 (0.39) 950,601 3,880 (0.41)
2018 1,178,026 5,642 (0.48) 1,433,230 6,896 (0.48)
Medical institution characteristics
Medical institution type
Tertiary hospitals 67,475 502 (0.74) 78,034 531 (0.68)
General hospital & hospital 823,930 10,370 (1.26) 927,798 11,791 (1.27)
Clinic 2,661,495 9,241 (0.35) 3,171,573 11,337 (0.36)
Underlying comorbidity
Tuberculosis
No 3,527,660 19,831 (0.56) 4,148,705 23,292 (0.56)
Yes 25,240 282 (1.12) 28,700 367 (1.28)
Asthma
No 1,615,254 7,047 (0.44) 2,011,204 8,846 (0.44)
Yes 1,937,646 13,066 (0.67) 2,166,201 14,813 (0.68)
Chronic obstructive pulmonary disease
No 3,493,470 19,013 (0.54) 4,112,602 22,645 (0.55)
Yes 59,430 1,100 (1.85) 64,803 1,014 (1.56)
Heart disease
No 3,423,268 18,737 (0.55) 4,009,158 21,782 (0.54)
Yes 129,632 1,376 (1.06) 168,247 1,877 (1.12)
Stroke
No 3,504,035 19,302 (0.55) 4,107,880 22,545 (0.55)
Yes 48,865 811 (1.66) 69,525 1,114 (1.60)
Hepatitis
No 3,481,567 19,693 (0.57) 4,091,955 23,166 (0.57)
Yes 71,333 420 (0.59) 85,450 493 (0.58)
Cancer
No 3,493,299 19,380 (0.55) 4,094,869 22,987 (0.56)
Yes 59,601 733 (1.23) 82,536 672 (0.81)
Diabetes
No 3,342,387 18,222 (0.55) 3,896,124 21,049 (0.54)
Yes 210,513 1,891 (0.90) 281,281 2,610 (0.93)
Antiviral prescription
No 1,071,117 5,917 (0.55) 1,331,604 7,361 (0.55)
1–4 100,253 982 (0.98) 115,624 1,139 (0.99)
≥ 5 2,381,530 13,214 (0.55) 2,730,177 15,159 (0.56)
Data are presented as number (%).

Factors affecting the incidence of hospitalized pneumonia after influenza infection

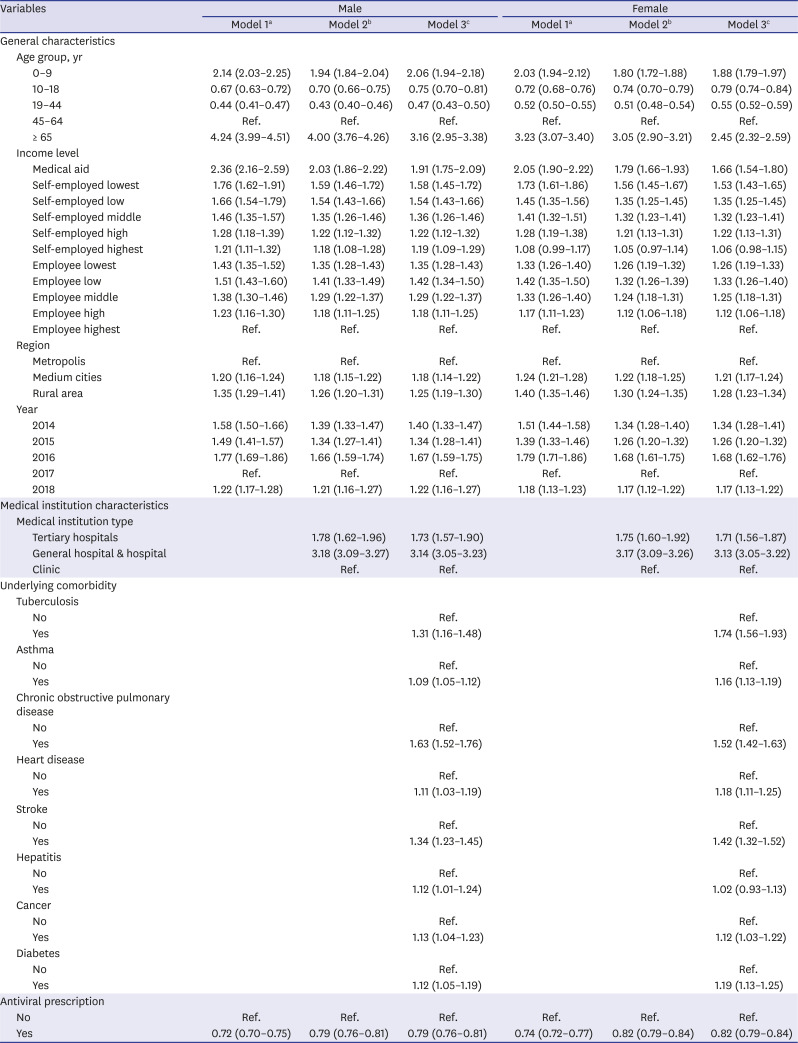
Factors influencing the incidence of hospitalized pneumonia after adjusting general characteristics, medical institution characteristics, underlying comorbidity, and based on the age group of 45–64s males were found to have the highest RR in their over 65 years old (Table 3). By age group, the RR of 0–9 years was 2.06-fold higher than that of 45–64s. Females aged 0–9 was 1.88-fold higher and over 65s had the highest RR. In terms of income level, based on employee health insurance and the highest income group, the RRs of medical aid were the highest at 1.91 and 1.66-fold for both males and females, respectively. In the region, based on large cities, the RR was 1.25-fold higher for males and 1.28-fold higher for females in rural areas. In the type of medical institution, when it is based on clinic the RR of both males and females in general hospitals were the highest with 3.14-fold and 3.13-fold, respectively. Males with advanced chronic disease showed the highest RR of chronic obstructive pulmonary disease with 1.63-fold and 1.34-fold for stroke. In females, tuberculosis showed the highest RR of 1.74-fold, followed by chronic obstructive pulmonary disease 1.52-fold. Antiviral therapy reduced the incidence of hospitalized pneumonia by 0.21-fold in males and 0.18-fold in females.
Table 3

Factors affecting the incidence of hospitalized pneumonia after influenza outpatient episodes by sex

jkms-35-e318-i003
Variables Male Female
Model 1a Model 2b Model 3c Model 1a Model 2b Model 3c
General characteristics
Age group, yr
0–9 2.14 (2.03–2.25) 1.94 (1.84–2.04) 2.06 (1.94–2.18) 2.03 (1.94–2.12) 1.80 (1.72–1.88) 1.88 (1.79–1.97)
10–18 0.67 (0.63–0.72) 0.70 (0.66–0.75) 0.75 (0.70–0.81) 0.72 (0.68–0.76) 0.74 (0.70–0.79) 0.79 (0.74–0.84)
19–44 0.44 (0.41–0.47) 0.43 (0.40–0.46) 0.47 (0.43–0.50) 0.52 (0.50–0.55) 0.51 (0.48–0.54) 0.55 (0.52–0.59)
45–64 Ref. Ref. Ref. Ref. Ref. Ref.
≥ 65 4.24 (3.99–4.51) 4.00 (3.76–4.26) 3.16 (2.95–3.38) 3.23 (3.07–3.40) 3.05 (2.90–3.21) 2.45 (2.32–2.59)
Income level
Medical aid 2.36 (2.16–2.59) 2.03 (1.86–2.22) 1.91 (1.75–2.09) 2.05 (1.90–2.22) 1.79 (1.66–1.93) 1.66 (1.54–1.80)
Self-employed lowest 1.76 (1.62–1.91) 1.59 (1.46–1.72) 1.58 (1.45–1.72) 1.73 (1.61–1.86) 1.56 (1.45–1.67) 1.53 (1.43–1.65)
Self-employed low 1.66 (1.54–1.79) 1.54 (1.43–1.66) 1.54 (1.43–1.66) 1.45 (1.35–1.56) 1.35 (1.25–1.45) 1.35 (1.25–1.45)
Self-employed middle 1.46 (1.35–1.57) 1.35 (1.26–1.46) 1.36 (1.26–1.46) 1.41 (1.32–1.51) 1.32 (1.23–1.41) 1.32 (1.23–1.41)
Self-employed high 1.28 (1.18–1.39) 1.22 (1.12–1.32) 1.22 (1.12–1.32) 1.28 (1.19–1.38) 1.21 (1.13–1.31) 1.22 (1.13–1.31)
Self-employed highest 1.21 (1.11–1.32) 1.18 (1.08–1.28) 1.19 (1.09–1.29) 1.08 (0.99–1.17) 1.05 (0.97–1.14) 1.06 (0.98–1.15)
Employee lowest 1.43 (1.35–1.52) 1.35 (1.28–1.43) 1.35 (1.28–1.43) 1.33 (1.26–1.40) 1.26 (1.19–1.32) 1.26 (1.19–1.33)
Employee low 1.51 (1.43–1.60) 1.41 (1.33–1.49) 1.42 (1.34–1.50) 1.42 (1.35–1.50) 1.32 (1.26–1.39) 1.33 (1.26–1.40)
Employee middle 1.38 (1.30–1.46) 1.29 (1.22–1.37) 1.29 (1.22–1.37) 1.33 (1.26–1.40) 1.24 (1.18–1.31) 1.25 (1.18–1.31)
Employee high 1.23 (1.16–1.30) 1.18 (1.11–1.25) 1.18 (1.11–1.25) 1.17 (1.11–1.23) 1.12 (1.06–1.18) 1.12 (1.06–1.18)
Employee highest Ref. Ref. Ref. Ref. Ref. Ref.
Region
Metropolis Ref. Ref. Ref. Ref. Ref. Ref.
Medium cities 1.20 (1.16–1.24) 1.18 (1.15–1.22) 1.18 (1.14–1.22) 1.24 (1.21–1.28) 1.22 (1.18–1.25) 1.21 (1.17–1.24)
Rural area 1.35 (1.29–1.41) 1.26 (1.20–1.31) 1.25 (1.19–1.30) 1.40 (1.35–1.46) 1.30 (1.24–1.35) 1.28 (1.23–1.34)
Year
2014 1.58 (1.50–1.66) 1.39 (1.33–1.47) 1.40 (1.33–1.47) 1.51 (1.44–1.58) 1.34 (1.28–1.40) 1.34 (1.28–1.41)
2015 1.49 (1.41–1.57) 1.34 (1.27–1.41) 1.34 (1.28–1.41) 1.39 (1.33–1.46) 1.26 (1.20–1.32) 1.26 (1.20–1.32)
2016 1.77 (1.69–1.86) 1.66 (1.59–1.74) 1.67 (1.59–1.75) 1.79 (1.71–1.86) 1.68 (1.61–1.75) 1.68 (1.62–1.76)
2017 Ref. Ref. Ref. Ref. Ref. Ref.
2018 1.22 (1.17–1.28) 1.21 (1.16–1.27) 1.22 (1.16–1.27) 1.18 (1.13–1.23) 1.17 (1.12–1.22) 1.17 (1.13–1.22)
Medical institution characteristics
Medical institution type
Tertiary hospitals 1.78 (1.62–1.96) 1.73 (1.57–1.90) 1.75 (1.60–1.92) 1.71 (1.56–1.87)
General hospital & hospital 3.18 (3.09–3.27) 3.14 (3.05–3.23) 3.17 (3.09–3.26) 3.13 (3.05–3.22)
Clinic Ref. Ref. Ref. Ref.
Underlying comorbidity
Tuberculosis
No Ref. Ref.
Yes 1.31 (1.16–1.48) 1.74 (1.56–1.93)
Asthma
No Ref. Ref.
Yes 1.09 (1.05–1.12) 1.16 (1.13–1.19)
Chronic obstructive pulmonary disease
No Ref. Ref.
Yes 1.63 (1.52–1.76) 1.52 (1.42–1.63)
Heart disease
No Ref. Ref.
Yes 1.11 (1.03–1.19) 1.18 (1.11–1.25)
Stroke
No Ref. Ref.
Yes 1.34 (1.23–1.45) 1.42 (1.32–1.52)
Hepatitis
No Ref. Ref.
Yes 1.12 (1.01–1.24) 1.02 (0.93–1.13)
Cancer
No Ref. Ref.
Yes 1.13 (1.04–1.23) 1.12 (1.03–1.22)
Diabetes
No Ref. Ref.
Yes 1.12 (1.05–1.19) 1.19 (1.13–1.25)
Antiviral prescription
No Ref. Ref. Ref. Ref. Ref. Ref.
Yes 0.72 (0.70–0.75) 0.79 (0.76–0.81) 0.79 (0.76–0.81) 0.74 (0.72–0.77) 0.82 (0.79–0.84) 0.82 (0.79–0.84)
Data are presented as relative risk (95% confidence interval).
aModel 1: adjusted general characteristics; bModel 2: adjusted general characteristics, medical institution characteristics; cModel 3: adjusted general characteristics, medical institution characteristics, underlying comorbidity.

The effect of antiviral therapy on hospitalized pneumonia in the 2017 flu season

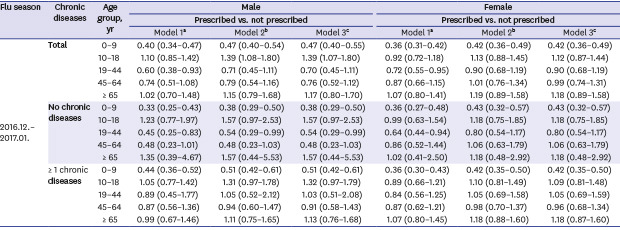
In patients at high risk in the 2017 flu season, medical care benefits of antiviral therapy were granted with or without test results (Table 4). In view of that, we investigated the effect of antiviral therapy on incidence of pneumonia in the high-risk group in the flu season. The RR was 0.38-fold (95% CI, 0.29–0.50) in males aged 0–9 and 0.43-fold (95% CI, 0.32–0.57) in females aged 0–9 without chronic diseases, and it was 0.51-fold (95% CI, 0.42–0.61) in males aged 0–9 and 0.42-fold (95% CI, 0.35–0.50) in females aged 0–9 with one or more chronic diseases. It suggests that antiviral therapy may decrease the incidence of pneumonia after influenza infection.
Table 4

Effect of antiviral therapy on pneumonia inpatient episodes after influenza outpatient episodes depending on chronic diseases by age group, 2017 flu season

jkms-35-e318-i004
Flu season Chronic diseases Age group, yr Male Female
Prescribed vs. not prescribed Prescribed vs. not prescribed
Model 1a Model 2b Model 3c Model 1a Model 2b Model 3c
2016.12.–2017.01. Total 0–9 0.40 (0.34–0.47) 0.47 (0.40–0.54) 0.47 (0.40–0.55) 0.36 (0.31–0.42) 0.42 (0.36–0.49) 0.42 (0.36–0.49)
10–18 1.10 (0.85–1.42) 1.39 (1.08–1.80) 1.39 (1.07–1.80) 0.92 (0.72–1.18) 1.13 (0.88–1.45) 1.12 (0.87–1.44)
19–44 0.60 (0.38–0.93) 0.71 (0.45–1.11) 0.70 (0.45–1.11) 0.72 (0.55–0.95) 0.90 (0.68–1.19) 0.90 (0.68–1.19)
45–64 0.74 (0.51–1.08) 0.79 (0.54–1.16) 0.76 (0.52–1.12) 0.87 (0.66–1.15) 1.01 (0.76–1.34) 0.99 (0.74–1.31)
≥ 65 1.02 (0.70–1.48) 1.15 (0.79–1.68) 1.17 (0.80–1.70) 1.07 (0.80–1.41) 1.19 (0.89–1.58) 1.18 (0.89–1.58)
No chronic diseases 0–9 0.33 (0.25–0.43) 0.38 (0.29–0.50) 0.38 (0.29–0.50) 0.36 (0.27–0.48) 0.43 (0.32–0.57) 0.43 (0.32–0.57)
10–18 1.23 (0.77–1.97) 1.57 (0.97–2.53) 1.57 (0.97–2.53) 0.99 (0.63–1.54) 1.18 (0.75–1.85) 1.18 (0.75–1.85)
19–44 0.45 (0.25–0.83) 0.54 (0.29–0.99) 0.54 (0.29–0.99) 0.64 (0.44–0.94) 0.80 (0.54–1.17) 0.80 (0.54–1.17)
45–64 0.48 (0.23–1.01) 0.48 (0.23–1.03) 0.48 (0.23–1.03) 0.86 (0.52–1.44) 1.06 (0.63–1.79) 1.06 (0.63–1.79)
≥ 65 1.35 (0.39–4.67) 1.57 (0.44–5.53) 1.57 (0.44–5.53) 1.02 (0.41–2.50) 1.18 (0.48–2.92) 1.18 (0.48–2.92)
≥ 1 chronic diseases 0–9 0.44 (0.36–0.52) 0.51 (0.42–0.61) 0.51 (0.42–0.61) 0.36 (0.30–0.43) 0.42 (0.35–0.50) 0.42 (0.35–0.50)
10–18 1.05 (0.77–1.42) 1.31 (0.97–1.78) 1.32 (0.97–1.79) 0.89 (0.66–1.21) 1.10 (0.81–1.49) 1.09 (0.81–1.48)
19–44 0.89 (0.45–1.77) 1.05 (0.52–2.12) 1.03 (0.51–2.08) 0.84 (0.56–1.25) 1.05 (0.69–1.58) 1.05 (0.69–1.59)
45–64 0.87 (0.56–1.36) 0.94 (0.60–1.47) 0.91 (0.58–1.43) 0.87 (0.62–1.21) 0.98 (0.70–1.37) 0.96 (0.68–1.34)
≥ 65 0.99 (0.67–1.46) 1.11 (0.75–1.65) 1.13 (0.76–1.68) 1.07 (0.80–1.45) 1.18 (0.88–1.60) 1.18 (0.87–1.60)
Data are presented as relative risk (95% confidence interval).
aModel 1: adjusted general characteristics; bModel 2: adjusted general characteristics, medical institution characteristics; cModel 3: adjusted general characteristics, medical institution characteristics, underlying comorbidity.

DISCUSSION

Influenza is epidemic every winter season, and those exposed to viral infections need antiviral treatment. Antiviral agents such as oseltamivir and zanamivir can be expected to reduce the duration of morbidity, hospitalization rate, complications of pneumonia after influenza infection, inhibit viral growth, and delay the spread of early disease outbreaks. In addition, treatment and management with antiviral agents within 48 hours after the onset of symptoms are very important in order to reduce the damage caused by influenza infection and complications leading to pneumonia.
This study measured the incidence of pneumonia inpatient episodes after outpatient episodes of influenza by reconstructing episode data to make use into epidemiological data, which were the claims of diagnosed influenza and pneumonia from the 2014–2018 NHIS's DB. Factors affecting the incidence of pneumonia inpatient episodes after influenza outpatient episodes were investigated and confirmed the effect of antiviral treatment to the pneumonia hospitalization episode in the 2017 flu season.
A CIR of hospitalized pneumonia after influenza infection was found to be 0.57% in both males and females. In addition, factors affecting the incidence of hospitalized pneumonia were identified as age, income level except self-employed highest (only in females), municipality, medical institution type, precedent chronic diseases except hepatitis (only in females) and antiviral therapy. In the Garg et al.11 study, 29% of adults hospitalized with influenza had pneumonia, and related factors were age 75 and older, chronic lung disease, asthma, and etc. In the Simmerman et al.12 study, it was shown that older patients or those with certain underlying diseases are more likely to develop pneumonia among hospitalized patients. According to the Chu et al.13 study, the incidence of pneumonia after influenza infection in hospitalized patients was 65.7%. Risk factors for the development of pneumonia were identified by age, respiratory disease, and underlying disease.1314 When investigating factors affecting incidence of pneumonia after influenza infection, the result from our study using the claims data included age, preceding chronic diseases, and underlying diseases. It was similar to that from previous studies using medical records of hospitals. The immune system of patients with preceding chronic diseases is commonly depressed, resulting in high susceptibility to influenza infection to increase a risk of pneumonia, organ failure, and deterioration of underlying diseases. It is easy for patients with chronic diseases to have more severe diseases or be dead. Thus, early antiviral therapy is important after diagnosis of influenza.
In the result of multivariate analysis adjusting general characteristics, characteristics of medical institutions, and preceding chronic diseases, the incidence of hospitalized pneumonia, in the outpatient episodes of influenza from 2014 to 2018, decreased by 21% (95% CI, 0.76–0.81) in males and 18% (95% CI, 0.79–0.84) in females due to antiviral therapy provided for at least five days. In the standard of medical care benefits on prescription of antiviral agents between 2014 and 2017, prescription of antiviral agents for high-risk groups was approved based on symptoms without test results in the flu season as well as in positive cases. We used data collected from December 2016 to January 2017, which showed high prescription rates, to identify the effect of antiviral therapy in order to select an accurate population with prescription of antiviral agents based on the standard of medical care benefits. Then, we investigated the effect of antiviral therapy on the incidence of pneumonia in high-risk groups. Antiviral therapy decreased the incidence of pneumonia in males and females aged 0–9 with or without chronic diseases. There was no significant difference in patients aged 65 or older. To assess the effect of antiviral therapy, it was needed to select an accurate population with prescription related to influenza, and to appropriately prescribe antiviral agents based on the standard of the medical care benefits. The standard of medical care benefits on influenza diagnosis and antiviral agents has changed in the 2017–2018 flu season. In our results, antiviral therapy did not decrease the incidence of pneumonia in the elderly, and therefore further studies for patients aged 65 or older who got prescription of antiviral agents are required. In addition, studies on healthy adults with prescription related to influenza would be needed.
The Peters et al.15 study has shown that treatment of oseltamivir at all ages reduces the risk of pneumonia diagnosis by 15%, using inpatient and outpatient data. The Nordstrom et al.16 study has shown that the use of oseltamivir lowers the risk of pneumonia by 28%. The Gums et al.17 study found that prescribing in children and adolescents reduced the risk of pneumonia to 26% and 36% at 6–12 years of age. It was not statistically significant in the age of 18 or more.
In other studies of the effect of antiviral agents using claims data, antiviral therapy decreased incidence of outpatient and hospitalized pneumonia. A similar result was also shown in our study. In particular, antiviral therapy had a greater effect in children. In the randomized controlled trial (RCT) using clinical data, secondary complications such as pneumonia, bronchitis, sinusitis and otitis media decreased by 50% due to antiviral therapy,18 and complications in the lower respiratory tract decreased by 34%.19 Studies using clinical data could use the data of accurate diagnoses and severity, and verify administration of oseltamivir used within 36 hours after the start of symptoms. This controlled setting might make the effect of antiviral therapy greater, which is one of our limitations.1620
International studies of prior RCT have shown that median duration of illness decreased by 1.5 days when oseltamivir was administered among infected children aged 1–12.2122 In addition, inhalation of zanamivir among influenza-infected children aged 5–12 years reduced the median time to symptom alleviation by 1.25 days.23 Infants and school age children are vulnerable to influenza virus infection. Influenza is a disease of droplet infection, and school-age children who live in groups are more susceptible to viral exposure, so antiviral therapy is very important to prevent the spread of the disease during the early epidemic.
Oseltamivir is an effective treatment for influenza patients of all ages, patients with respiratory disease.24 Welliver et al.25 and Hayden et al.26 study suggests that treatment with oseltamivir is an effective way to prevent influenza transmission within the households during community outbreaks because it is a significant site of influenza virus transmission. Zanamivir treatment has also been shown to reduce the risk of influenza-related complications,27 and reduce the incidence of secondary infections requiring antibiotics.28 Zanamivir has also been shown to be effective in preventing influenza types A and B at home.29 Early antiviral medications are thought to reduce the duration and severity of symptoms after influenza infection, reduce the incidence of secondary complications, and reduce the economic loss due to medical use.
The limitations of this study are as followed: first, because the NHIS's data were billing data, it was possible to confirm the influenza and pneumonia diagnosis information only with the sickness code. The clinical data of medical institutions reflect the accuracy of diagnosis of influenza due to the test results, the number of severity and severity of influenza infections caused by the virus type, but the claim data could not confirm the clinical results. In addition, it could not be identified whether the type of pneumonia after influenza infection was viral or bacterial. Second, the antiviral effect was shown to be most effective as early as possible within 48 hours after symptom onset.817 However, the data used in this study were medical billing data, and the onset of symptoms was not known. Instead, the date of first diagnosis and the date of first antiviral therapy were identified using the first day of medical treatment and the first day of medication. Third, medical institutions prescribe drugs of oseltamivir, zanamivir, and peramivir, which are antiviral agents used in the treatment of influenza, in the family of neuraminidase inhibitors. Of these, peramivir was prescribed as non-payment and could not be confirmed by health insurance claims. The antiviral agents of this study were oseltamivir and zanamivir, and 99.9% of oseltamivir and 0.1% of zanamivir were found. Lastly, the NHIS recorded the antiviral prescription as a billing data, but it was not possible to confirm whether the patient actually took the prescribed antiviral drugs.
Multivariate analysis confirmed that antiviral therapy lowered the risk of hospitalized pneumonia in influenza outpatient episodes. In particular, the incidence of hospitalized pneumonia was the lowest at the age of 0–9 years in the 2017 flu season. Early exposure to antiviral drugs is recommended to minimize the damage caused by infection and to reduce the occurrence of secondary complications when symptoms occur due to exposure to influenza viruses. In addition, early antiviral therapy may reduce the incidence of influenza's most common pneumonia complications, and reduce the medical cost of hospitalization.

Notes

Funding: This work was supported by a grant from the National Institute of Environment Research (NIER), funded by the Ministry of Environment (MOE) of the Republic of Korea (NIER-2019-04-02-071).

This study was supported by the Government-wide R&D Fund project for infectious disease research (HG18C0088), Republic of Korea.

Disclosure: The authors have no potential conflicts of interest to disclose.

Author Contributions:

  • Conceptualization: Byeon KH, Kim J, Choi BY.

  • Data curation: Kim J, Byeon KH.

  • Formal analysis: Kim J, Byeon KH.

  • Methodology: Kim J, Byeon KH.

  • Writing - original draft: Byeon KH.

  • Writing - review & editing: Kim J, Byeon KH, Choi BY, Kim JY, Lee N.

References

1. Korea Centers for Disease Control and Prevention. Updated 2020. Accessed May 10, 2019. http://www.cdc.go.kr/npt/.
2. Baek JH, Seo YB, Choi WS, Kee SY, Jeong HW, Lee HY, et al. Guideline on the prevention and control of seasonal influenza in healthcare setting. Korean J Intern Med. 2014; 29(2):265–280. PMID: 24648817.
crossref
3. Wright PF, Kirkland KB, Modlin JF. When to consider the use of antibiotics in the treatment of 2009 H1N1 influenza-associated pneumonia. N Engl J Med. 2009; 361(24):e112. PMID: 19940288.
crossref
4. Heo JY, Song JY, Noh JY, Choi MJ, Yoon JG, Lee SN, et al. Effects of influenza immunization on pneumonia in the elderly. Hum Vaccin Immunother. 2018; 14(3):744–749. PMID: 29135343.
crossref
5. Ryu SW, Suh IB, Ryu SM, Shin KS, Kim HS, Kim J, et al. Comparison of three rapid influenza diagnostic tests with digital readout systems and one conventional rapid influenza diagnostic test. J Clin Lab Anal. 2018; 32(2):e22234.
crossref
6. Almond MH, McAuley DF, Wise MP, Griffiths MJ. Influenza-related pneumonia. Clin Med (Lond). 2012; 12(1):67–70. PMID: 22372228.
crossref
7. Rothberg MB, Haessler SD, Brown RB. Complications of viral influenza. Am J Med. 2008; 121(4):258–264. PMID: 18374680.
crossref
8. Choi WS, Lee J, Lee HY, Baek JH, Kim YK, Kee SY, et al. Clinical practice guideline for antiviral treatment and chemoprophylaxis of seasonal influenza. Infect Chemother. 2012; 44(4):233–249.
crossref
9. National Health Insurance Service. Updated 2020. Accessed December 28, 2017. https://nhiss.nhis.or.kr/bd/ad/bdada033cv.do.
10. Health Insurance Review & Assessment Service. Updated 2020. Accessed January 9, 2018. http://opendata.hira.or.kr/op/opc/olap3thDsInfo.do.
11. Garg S, Jain S, Dawood FS, Jhung M, Pérez A, D'Mello T, et al. Pneumonia among adults hospitalized with laboratory-confirmed seasonal influenza virus infection-United States, 2005-2008. BMC Infect Dis. 2015; 15:369. PMID: 26307108.
crossref
12. Simmerman JM, Chittaganpitch M, Levy J, Chantra S, Maloney S, Uyeki T, et al. Incidence, seasonality and mortality associated with influenza pneumonia in Thailand: 2005-2008. PLoS One. 2009; 4(11):e7776. PMID: 19936224.
crossref
13. Chu S, Park SJ, Koo SM, Kim YK, Kim KU, Uh ST, et al. Incidence and risk factors of pneumonia in hospitalized patients with seasonal influenza A or B. Tuberc Respir Dis. 2017; 80(4):392–400.
crossref
14. Kang SH, Cheong HJ, Song JY, Noh JY, Jeon JH, Choi MJ, et al. Analysis of risk factors for severe acute respiratory infection and pneumonia and among adult patients with acute respiratory illness during 2011-2014 influenza seasons in Korea. Infect Chemother. 2016; 48(4):294–301. PMID: 27883375.
crossref
15. Peters PH, Moscona A, Schulman KL, Barr CE. Study of the impact of oseltamivir on the risk for pneumonia and other outcomes of influenza, 2000-2005. Medscape J Med. 2008; 10(6):131. PMID: 18679536.
16. Nordstrom BL, Sung I, Suter P, Szneke P. Risk of pneumonia and other complications of influenza-like illness in patients treated with oseltamivir. Curr Med Res Opin. 2005; 21(5):761–768. PMID: 15969875.
crossref
17. Gums JG, Pelletier EM, Blumentals WA. Oseltamivir and influenza-related complications, hospitalization and healthcare expenditure in healthy adults and children. Expert Opin Pharmacother. 2008; 9(2):151–161. PMID: 18201141.
crossref
18. Treanor JJ, Hayden FG, Vrooman PS, Barbarash R, Bettis R, Riff D, et al. Efficacy and safety of the oral neuraminidase inhibitor oseltamivir in treating acute influenza: a randomized controlled trial. JAMA. 2000; 283(8):1016–1024. PMID: 10697061.
19. Kaiser L, Wat C, Mills T, Mahoney P, Ward P, Hayden F. Impact of oseltamivir treatment on influenza-related lower respiratory tract complications and hospitalizations. Arch Intern Med. 2003; 163(14):1667–1672. PMID: 12885681.
crossref
20. Blumentals WA, Schulman KL. Impact of oseltamivir on the incidence of secondary complications of influenza in adolescent and adult patients: results from a retrospective population-based study. Curr Med Res Opin. 2007; 23(12):2961–2970. PMID: 17939881.
crossref
21. Whitley RJ, Hayden FG, Reisinger KS, Young N, Dutkowski R, Ipe D, et al. Oral oseltamivir treatment of influenza in children. Pediatr Infect Dis J. 2001; 20(2):127–133. PMID: 11224828.
crossref
22. Barr CE, Schulman K, Iacuzio D, Bradley JS. Effect of oseltamivir on the risk of pneumonia and use of health care services in children with clinically diagnosed influenza. Curr Med Res Opin. 2007; 23(3):523–531. PMID: 17355734.
crossref
23. Hedrick JA, Barzilai A, Behre U, Henderson FW, Hammond J, Reilly L, et al. Zanamivir for treatment of symptomatic influenza A and B infection in children five to twelve years of age: a randomized controlled trial. Pediatr Infect Dis J. 2000; 19(5):410–417. PMID: 10819336.
crossref
24. Singh S, Barghoorn J, Bagdonas A, Adler J, Treanor J, Kinnersley N, et al. Clinical benefits with oseltamivir in treating influenza in adult populations : results of a pooled and subgroup analysis. Clin Drug Investig. 2003; 23(9):561–569.
25. Welliver R, Monto AS, Carewicz O, Schatteman E, Hassman M, Hedrick J, et al. Effectiveness of oseltamivir in preventing influenza in household contacts: a randomized controlled trial. JAMA. 2001; 285(6):748–754. PMID: 11176912.
26. Hayden FG, Belshe R, Villanueva C, Lanno R, Hughes C, Small I, et al. Management of influenza in households: a prospective, randomized comparison of oseltamivir treatment with or without postexposure prophylaxis. J Infect Dis. 2004; 189(3):440–449. PMID: 14745701.
crossref
27. Lalezari J, Campion K, Keene O, Silagy C. Zanamivir for the treatment of influenza A and B infection in high-risk patients: a pooled analysis of randomized controlled trials. Arch Intern Med. 2001; 161(2):212–217. PMID: 11176734.
28. Monto AS, Webster A, Keene O. Randomized, placebo-controlled studies of inhaled zanamivir in the treatment of influenza A and B: pooled efficacy analysis. J Antimicrob Chemother. 1999; 44 Suppl B:23–29. PMID: 10877459.
29. Monto AS, Pichichero ME, Blanckenberg SJ, Ruuskanen O, Cooper C, Fleming DM, et al. Zanamivir prophylaxis: an effective strategy for the prevention of influenza types A and B within households. J Infect Dis. 2002; 186(11):1582–1588. PMID: 12447733.
crossref

SUPPLEMENTARY MATERIALS

Supplementary Table 1

Number of episodes for 100 days' window period diagnosed with influenza, by year
jkms-35-e318-s001.doc

Supplementary Table 2

Number of episodes for 100 days' window period diagnosed with pneumonia, by year
jkms-35-e318-s002.doc

Supplementary Table 3

Disease coding of influenza and pneumonia
jkms-35-e318-s003.doc

Supplementary Table 4

Number of case definition, influenza
jkms-35-e318-s004.doc

Supplementary Table 5

Number of case definition, pneumonia
jkms-35-e318-s005.doc

Supplementary Table 6

Position of disease coding, influenza
jkms-35-e318-s006.doc

Supplementary Table 7

Position of disease coding, pneumonia
jkms-35-e318-s007.doc

Supplementary Table 8

Main component codes of antiviral drug
jkms-35-e318-s008.doc

Supplementary Table 9

The number of antiviral drug for influenza
jkms-35-e318-s009.doc

Supplementary Table 10

High-risk group with a high incidence of severe influenza or complications
jkms-35-e318-s010.doc

Supplementary Table 11

Prescription days of antiviral drug
jkms-35-e318-s011.doc

Supplementary Fig. 1

Prescription rate of antiviral drug, by weekly.
jkms-35-e318-s012.doc

Supplementary Fig. 2

Prescription rate of antiviral drugs depending on age group by monthly, male.
jkms-35-e318-s013.doc

Supplementary Fig. 3

Prescription rate of antiviral drugs depending on age group by monthly, female.
jkms-35-e318-s014.doc

Supplementary Fig. 4

Distribution of number of claims depending on window period for influenza.
jkms-35-e318-s015.doc

Supplementary Fig. 5

Distribution of number of claims depending on window period for pneumonia.
jkms-35-e318-s016.doc

Supplementary Fig. 6

Flow chart for selecting study subjects.
jkms-35-e318-s017.doc

Supplementary Fig. 7

Incidence period of hospitalized pneumonia after influenza outpatient episodes.
jkms-35-e318-s018.doc
TOOLS
Similar articles