

 PDF
PDF Citation
 Print
Print


INTRODUCTION
In December 2019, severe acute respiratory syndrome coronavirus 2 (SARS-CoV-2) was first identified in Wuhan, China. Since then, the novel coronavirus disease 2019 (COVID-19) rapidly spread to neighboring countries. On March 11, 2020, the World Health Organization (WHO) formally declared the COVID-19 outbreak a pandemic.1 As of May 20, 2020, 4,892,550 people have been infected worldwide, and 322,821 people have died.2 Patients with COVID-19 are often asymptomatic or mildly symptomatic, however, some of the patients progress to develop severe pneumonia and need oxygen treatments. They may also be admitted to the intensive care unit (ICU), requiring ventilator care, or they may even die from the disease. Therefore, it is a challenge to effectively triage patients in this emergent pandemic situation. Recent studies reported clinical findings including older age, underlying disease, and elevated inflammatory blood markers as risk factors for poor prognosis in COVID-19.3,4 Currently, chest computed tomography (CT) scans are not recommended for primary screening or diagnosis because of their low positive predictive value (1.5%–30.7%).5-7 The Fleischner Society states that imaging could be of help to rapidly triage COVID-19 patients with worsening respiratory symptoms in resource-constrained environments.5 If imaging, particularly an initial CT, can predict the severity of COVID-19, it may help to rapidly triage COVID-19 patients in a resource-constrained setting. Several recent studies reported imaging findings of patients with adverse outcomes.8-10 However, there are insufficient studies on the radiologic features that predict poor prognosis. Therefore, the purpose of this study was to investigate the adverse initial CT features to predict poor prognosis in COVID-19.
Go to : 
METHODS
Patients
We included confirmed COVID-19 patients diagnosed through real time polymerase chain reaction admitted in our hospital, with CT scans taken within the first week of hospitalization. Exclusion criterion was patients with no CT or patients who had severe pneumonia before performing the CT scan.
Among 709 patients admitted in the COVID-19 hospital cohort between February 22, 2020 and April 3, 2020, 347 patients underwent chest CT (Fig. 1) within one week of admission. We excluded 66 patients who already exhibited severe pneumonia when undergoing CT scan. Demographic data, underlying diseases, symptom type, date of symptom onset and diagnosis, and initial laboratory findings (complete blood count with differential, C-reactive protein [CRP], lactate dehydrogenase [LDH]) were reviewed.
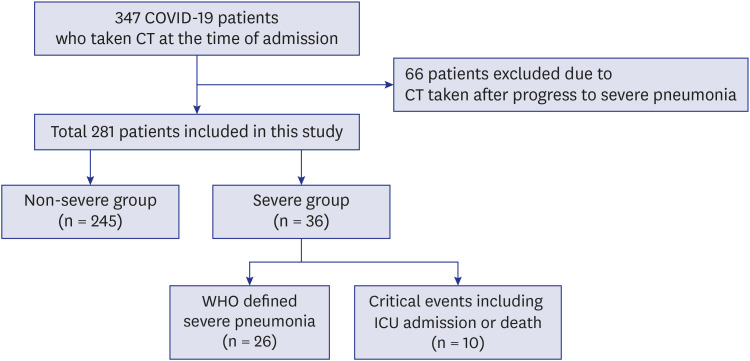
We divided the patients into two groups based on clinical criteria, namely, severe and non-severe groups. The inclusion criteria for the severe group was 1) severe pneumonia according to the WHO criteria11 (fever or suspected respiratory infection plus one of the following: respiratory rate > 30 breaths/min, severe respiratory distress, or peripheral oxygen saturation ≤ 93% on room air), 2) admitted to the ICU, 3) or death due to COVID-19. In this study, the critical events were admission to the ICU and death. COVID-19 patients who did not progress to severe pneumonia were included in the non-severe group. Among the 281 included patients, three patients had an unknown medical history, and the symptom type was unknown in two patients due to difficulties in communication.
Chest CT protocol
The study was conducted in a COVID-19 cohort hospital, the whole hospital area was designated as an isolation zone. Radiographers wore personal protective equipment to enter the hospital for CT scanning. Chest CT was performed using 128-slice dual-source CTs (Definition Flash; Siemens, Munich, Germany). The parameters for the CT were: tube voltage, 120 kVp; tube current, reference 60 mAs, with automatic exposure control; slice thickness 1.0 mm; and filter b50f. CT images were obtained in the supine position without contrast enhancement. The scan range was from the inferior neck to both adrenal glands.
Image analysis
Two radiologists (3 years and 9 years of experience) reviewed the chest CT independently in a blinded manner. The presence of increased opacity (ground glass opacity [GGO], consolidation, or mixed GGO and consolidation), crazy-paving appearance of lesion, distribution of lesions, effusion, extent (location and number of involved lobes or segments), and presence of atypical findings (nodules, halo sign, reverse halo sign) were reviewed. Peripheral distribution was diagnosed when the pneumonia in the outer one-third was greater than that in the inner two-third of the lung.12 The amount of pleural effusion was estimated using the anteroposterior (AP) quartile method.13 According to the method, the first AP-quartile effusion is considered small, second AP-quartile effusion is moderate, and third or fourth AP-quartile effusion is large. In the cases of inter-reader discrepancies, a consensus was reached through discussion. We used the CT score recommended by Yang et al.14 According to the anatomical structure, both lungs were divided into 20 segments (left apicoposterior segment subdivided into the apical and posterior segments, left anteromedial basal segment subdivided into the anterior basal and medial basal segments). The lung opacity in 20 segments were visually evaluated and scored as 0 (no involvement), 1 (less than 50% involvement), and 2 (more than 50% involvements), and the scores were summed up. The total score was ranging from 0 to 40.14
Statistical analysis
Categorical variables were presented in percentage numbers, and continuous variables were presented as means with standard deviations or medians with 25th to 75th percentiles. Differences between the two groups were analyzed using the χ2 or Fisher's exact tests for categorical variables. The Student's t-test or Mann-Whitney U test were used for continuous variables. Interobserver agreement was evaluated using intraclass correlation coefficients (ICCs) for continuous variables. The cut-off values of continuous variables were set by receiver operating characteristic curve analysis for the severe group. Univariate and multivariate logistic regressions were used to investigate the prognostic factors of the severe group and the critical events. In the multivariate analysis, we selected four variables to predict the severe group according to the rule of thumb, that is, ten events per variables.15 We selected three variables to predict critical events. Because, there were four CT factors, we divided them into two categories as follows: factors not related to the appearance of pneumonia (model 1): CT score and pleural effusion; and factors related to the appearance of pneumonia (model 2): consolidation opacity and crazy-paving appearance. Additional clinical variables were entered by assessing goodness of fit in a regression model. Therefore, age and CRP were entered to investigate prognostic factors of the severe group, and age was entered to investigate prognostic factors of critical events in the multivariate regression analysis. P values < 0.05 were considered statistically significant. Statistical analyses were performed using MedCalc 19.2.1 (Ostend, Ostend, Belgium).
Ethics statement
This retrospective cohort study was approved by the Institutional Review Board of the Keimyung University Dongsan Hospital and informed consent requirement was waived (2020-04-061).
Go to :
RESULTS
Patients
A total of 281 patients (mean age: 61.5 years, 75 male/206 female) were included in this study. There were more female patients (206/75, 73.3%) in this cohort. Of them, 36 patients (12.8%) were classified into the severe group and 245 patients (87.2%) were classified into the non-severe group (Fig. 1). Among the 36 patients in the severe group, 5 patients (13.9%) were admitted to the ICU and 5 patients (13.9%) died because of worsening of COVID-19 pneumonia. The clinical characteristics of the severe and non-severe groups are summarized in Table 1. Patients in the severe group were significantly older than those in the non-severe group (median age 78 years vs. 60 years, respectively, P < 0.001). Fever was significantly more common in the severe group than in the non-severe group (P = 0.001). However other symptoms were not significantly different between the two groups (P > 0.05). Patients in the severe group had significantly more underlying diseases such as hypertension, cardiovascular disease, neurologic disease and malignancy, than those in the non-severe group (all, P < 0.05). Patients in the severe group showed a higher white blood cell count, higher absolute neutrophil count, lower absolute lymphocyte count (ALC), higher CRP, and higher LDH than non-severe patients (all, P < 0.05).
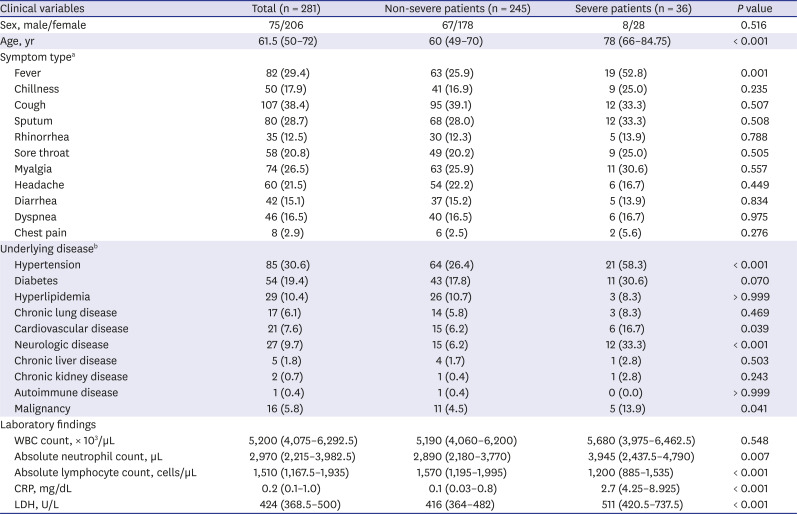
Table 1
Clinical characteristics of coronavirus disease patients
Data are presented as the number of patients (%) and median (25th–75th percentile).
WBC = white blood cell, CRP = C-reactive protein, LDH = lactate dehydrogenase.
aUnable to know the symptom type in two patients; bUnable to know the underlying disease history in three patients.
![]()
CT findings of severe and non-severe COVID-19 patients
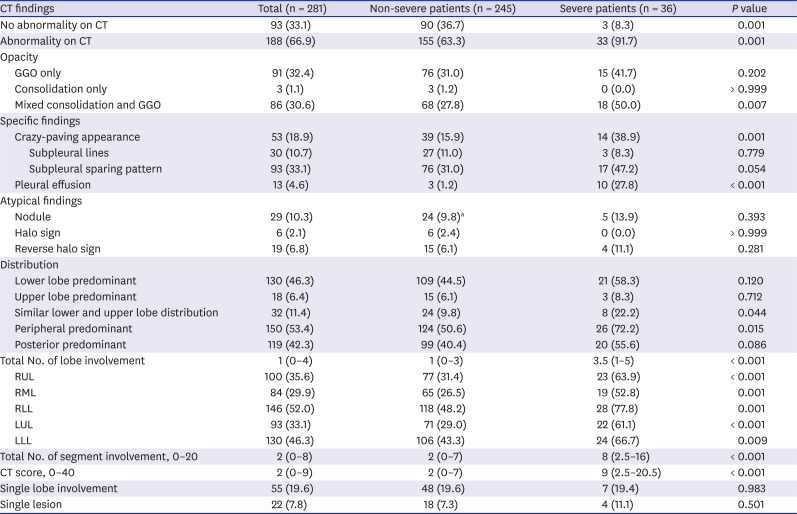
The CT findings are summarized in Table 2. The chest CT was taken in a median of one day (25th to 75th percentile, 0–1 day) after admission and median of 7 days (25th to 75th percentile, 2–13 days) after symptom onset. There was no significant difference in the time intervals from the symptom onset to CT scan for the severe and non-severe groups (severe group: median 6 days vs. non-severe group: 7 days, P = 0.104). In the severe group, patients progressed to severe pneumonia in median 2 days (25th to 75th percentile, 1–5 days) after the CT scan, and critical events (ICU admission and death) occurred after a median of 6.6 days (25th to 75th percentile, 3–6 days) after the CT scan. In the non-severe patients, 36.7% of patients had no abnormalities on the CT scans, while only 8.3% in the severe group had no abnormalities. Pneumonia with only GGO opacity was not significantly different between the two groups (P = 0.202). Pneumonia which only showed consolidation (Fig. 2) was rare (1.1%) and mainly mixed with GGO (30.6%). Mixed consolidation and GGO opacity (50.0% vs. 27.8%, P = 0.007), crazy-paving appearance (38.9% vs. 15.9%, P = 0.001) and pleural effusion (27.8% vs. 1.2%, P < 0.001) (Figs. 3-5) were significantly more frequent in the severe group. Most pleural effusions (10/13, 76.9%) were small in quantity. The number of involved lobes and segments were significantly higher in the severe group (3.5 lobes vs. 1 lobe, and 8 segments vs. 2 segments, both P < 0.001). The CT scores were also significantly higher in the severe group (median 9 score vs. 2 score, P < 0.001). The right lower lobe was the most frequently (52% in the total population) involved lobe in COVID-19 pneumonia. Pneumonia was commonly observed as a peripheral (53.4%), posterior (42.3%) and lower lobe (46.3%) distributed pattern. The ICC for CT score was excellent (ICC: 0.994; 95% CI, 0.992–0.995). Among the 188 CT scans with abnormalities, there were 14 discrepant between readers, and consensus was achieved by reviewing the cases in conjunction.
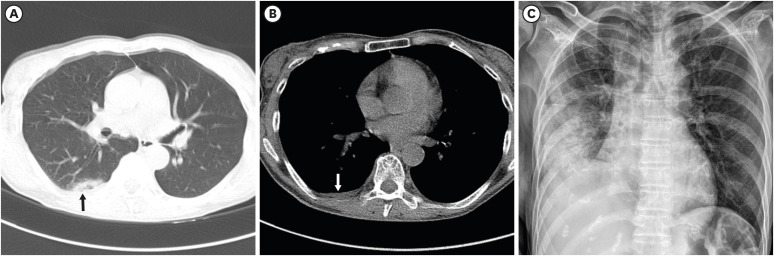
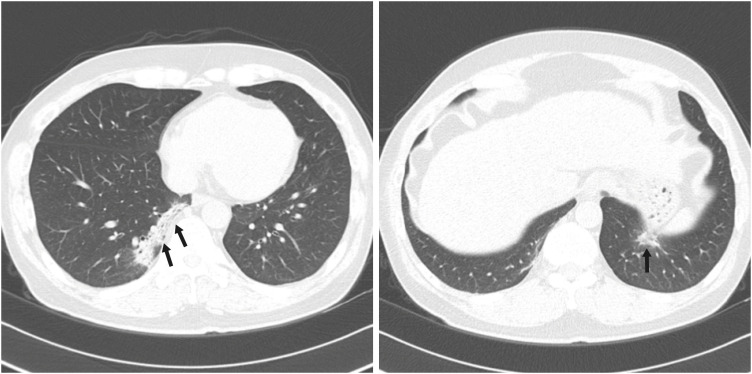 | Fig. 2A 54-year-old male patient with non-severe COVID-19 pneumonia. He had a history of hypertension and ischemic heart disease. Initial chest computed tomography taken one day after admission (arrow) shows a focal peripheral consolidation at both lower lobes. Three segments were involved, and the CT score was 5. There is no pleural effusion. During hospitalization, peripheral oxygen saturation was maintained above 95%.COVID-19 = coronavirus disease 2019, CT = computed tomography.
|
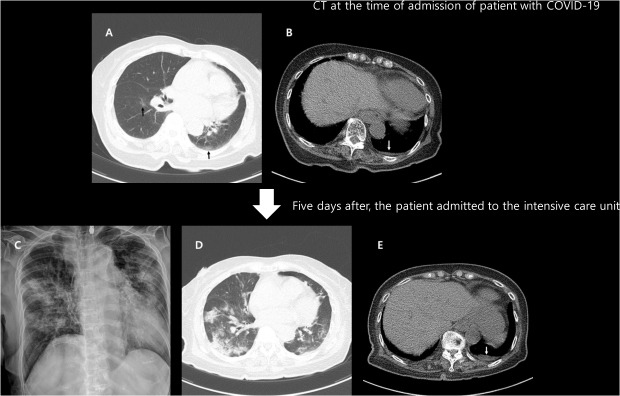
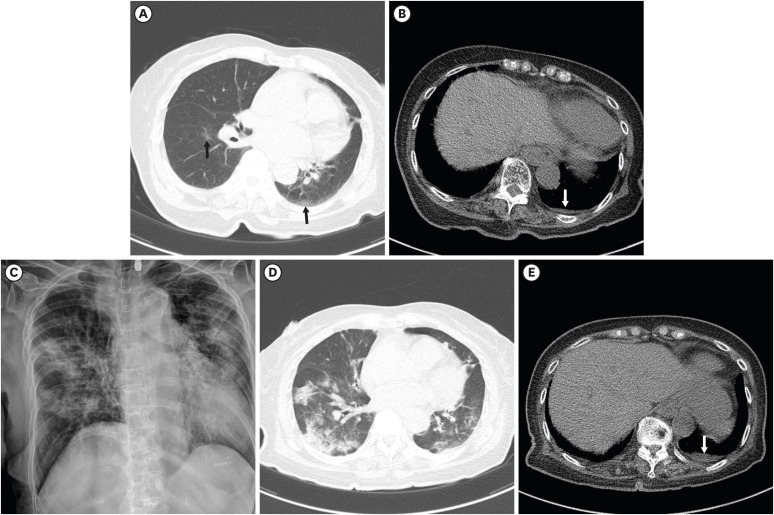 | Fig. 3An 81-year-old female with COVID-19 in the intensive care unit. She had a history of stroke. Initial chest CT one day after admission (A) shows focal GGO at the superior segment of the left lower lobe and the right lower lobe (black arrows), and a small amount of left pleural effusion (B; white arrow). Two segments were involved, and the CT score was 2. Five days after the initial CT, chest radiograph (C) shows an aggravation of the pneumonia. The peripheral oxygen saturation decreased to 88%, and oxygen supply treatment was started. The patient was admitted to the intensive care unit for close monitoring. Follow-up CT (D, E) after treatment showed multifocal consolidation and GGO in both the lungs, and a small amount of left pleural effusion (white arrow) is observed.COVID-19 = coronavirus disease 2019, CT = computed tomography, GGO = ground glass opacity.
|
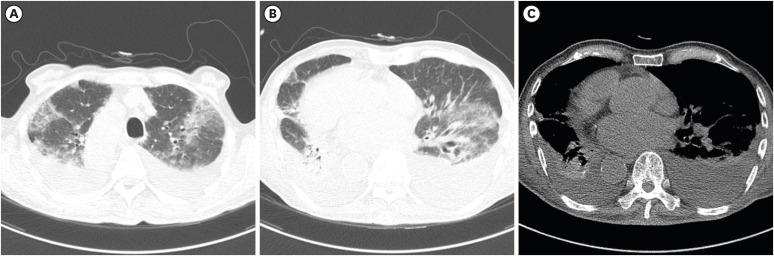 | Fig. 5Death of a 92-year-old male with COVID-19. He had a history of stroke, diabetes, and situs inversus totalis. Initial chest CT on the day of admission shows bilateral COVID-19 pneumonia (A, B), and a moderate amount of pleural effusion (C) is observed. All 20 segments were involved, and the CT score was 33. On the next day, peripheral oxygen saturation decreased by 90%. The patient refused active treatment or resuscitation, and died after 15 days due to respiratory failure.COVID-19 = coronavirus disease 2019, CT = computed tomography.
|
Table 2
Comparison of chest CT findings of coronavirus disease patients between two groups
Data are presented as the number of patients (%) or median (25th–75th percentile).
CT = computed tomography, GGO = ground glass opacity, RUL = right upper lobe, RML = right middle lobe, RLL = right lower lobe, LUL = left upper lobe, LLL = left lower lobe.
aAmong 24 non-severe patients, 8 patients showed a nodule only without consolidation or GGO, and the remaining 16 patients showed both nodules and consolidation or GGO.
![]()
Prognostic imaging and clinical factor for severe COVID-19
The results of the univariate and multivariate regression analyses to investigate the prognostic factors are summarized in Table 3. In the univariate logistic regression, CT findings including pleural effusion (odds ratio [OR], 22.03; 95% confidence interval [CI], 5.64–86.06; P < 0.001), consolidation opacity (OR, 2.34; 95% CI, 1.15–4.76; P = 0.019), crazy-paving appearance (OR, 2.19; 95% CI, 1.01–4.78, P = 0.048) and CT score > 5 (OR, 4.81; 95% CI, 2.28–10.13, P < 0.001) were all statistically significant factors to predict worsening to severe COVID-19. Other clinical factors including age older than 77 years (OR, 13.33; 95% CI, 6.02–29.53; P < 0.001); underlying disease including hypertension (OR, 3.89; 95% CI, 1.89–8.01; P < 0.001), cardiovascular disease (OR, 3.03; 95% CI, 1.09–8.40, P = 0.033), neurologic disease (OR, 7.57; 95% CI, 3.18–18.02; P < 0.001), and malignancy (OR, 3.39; 95% CI, 1.10–10.40; P = 0.033); and abnormal laboratory finding including decreased ALC (OR, 3.12; 95% CI, 1.52–6.42; P = 0.002), elevated CRP (OR, 6.77; 95% CI, 3.10–14.78; P < 0.001) and elevated LDH (OR, 5.15; 95% CI, 2.44–10.87; P < 0.001) were also significant factors that could predict severe COVID-19.
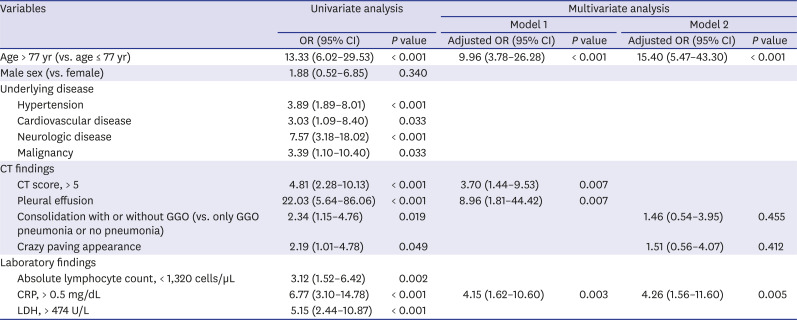
Table 3
Univariate and multivariate logistic regression analyses were performed to investigate clinical and CT imaging factors related to severe disease in coronavirus disease patients
CT = computed tomography, OR = odds ratio, CI = confidence interval, GGO = ground glass opacity, CRP = C-reactive protein, LDH = lactate dehydrogenase.
![]()
In multivariate analysis model 1, pleural effusion (adjusted OR, 8.96; 95% CI, 1.81–44.42; P = 0.007), CT score > 5 (adjusted OR, 3.70; 95% CI, 1.44–9.53; P = 0.007), and age > 77 years (adjusted OR, 9.96; 95% CI, 3.78–26.28; P < 0.001) were found to be significant prognostic factors of severe COVID-19. However, in multivariate analysis model 2, consolidation opacity and crazy-paving appearance were not found to be a significant prognostic factors of severe COVID-19.
The results of the univariate and multivariate regression analyses investigating the prognostic factors of the critical events are summarized in Table 4. In the univariate analysis, CT findings including pleural effusion (OR, 19.41; 95% CI, 4.65–81.02; P < 0.001), crazy-paving appearance (OR, 7.15; 95% CI, 1.94–26.33; P = 0.003) and CT score > 5 (OR, 8.32; 95% CI, 1.73–39.99; P = 0.008) were significant predictors of the critical events. Consolidation opacity, however, was not found to be a significant prognostic factor for the critical events (OR, 3.25; 95% CI, 0.89–11.84; P = 0.074). Other clinical factors including age > 77 years, underlying disease including neurologic disease and malignancy, abnormal laboratory findings including low ALC, high CRP, and high LDH were also significant contributing factors to critical events. In multivariable analysis model 1, pleural effusion (adjusted OR, 5.67; 95% CI, 1.04–30.8; P = 0.045) and CT score > 5 (adjusted OR, 7.29; 95% CI, 1.37–38.68; P = 0.020) were significantly predicted critical events along with age > 77 years (adjusted OR, 8.60; 95% CI, 1.80–41.0; P = 0.007). However, in multivariate analysis model 2, consolidation opacity and crazy-paving appearance were not found to be significant to predict the critical events.
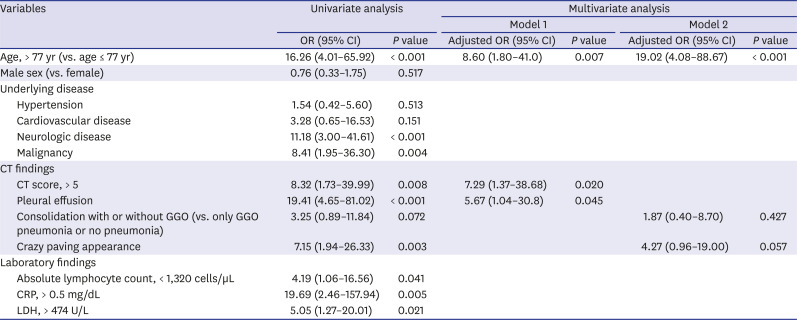
Table 4
Univariate and multivariate logistic regression analyses were performed to investigate clinical and CT imaging factors related to critical events (ICU admission and death) in coronavirus disease patients
CT = computed tomography, OR = odds ratio, CI = confidence interval, GGO = ground glass opacity, CRP = C-reactive protein, LDH = lactate dehydrogenase.
![]()
Go to :
DISCUSSION
In this retrospective cohort study, we found that the presence of a pleural effusion and a CT score higher than 5 at the time of admission were prognostic independent factors for COVID-19, along with other known clinical factors such as an older age (> 77 years) and a high CRP (> 0.5 mg/dL). Although consolidation opacity was frequently observed in patients in the severe group, it was not found to be a predictor of poor prognosis in this study.
Pleural effusion has been found to be rare in COVID-19 pneumonia.16-18 Also, pleural effusion was observed only in 13 patients (4.6%) and majority of them (10/13, 76.9%) were severe patients. We found that pleural effusion is the best prognostic factor (adjusted OR, 8.96; P = 0.007) to predict the severity of COVID-19 compared to opacity or the appearance of pneumonia. In the case of the Middle East respiratory syndrome (MERS) and SARS, pleural effusion has also been reported to be a significant prognostic factor.19-22 Interestingly, before progressing to severe pneumonia, pleural effusion was observed only in small amounts. As shown in Figs. 3 and 4, there was a small amount of effusion and the pneumonia was localized. Nevertheless, the patients progressed to severe pneumonia in the follow-up. Therefore, we suggest that, even though the amount of effusion in COVID-19 pneumonia patients is small, careful monitoring and early appropriate treatment is needed since this is a sign of progress toward a severe case. A previous animal model study reported a pleural effusion resulting from alveolar edema in severe MERS pneumonia.23 However, the exact cause and mechanism of the development of effusion in COVID-19 has not yet been investigated. Future studies on the pathophysiology of pleural effusion development in COVID-19 pneumonia are needed.
 | Fig. 4A 52-year-old female with severe COVID-19 pneumonia. She had a history of hypertension and dementia. An initial chest CT scan on the day of admission shows focal subpleural consolidation (black arrow) with ground-glass opacity at the right lower lobe superior segment (A). A small amount of right pleural effusion is also noted (B; white arrow). One segment was involved, and the CT score was 1. Pneumonia is seen aggravated on the follow-up chest radiograph nine days after the initial CT (C). Peripheral oxygen saturation decreased to 92%, and 2 L nasal prong oxygen therapy was initiated.COVID-19 = coronavirus disease 2019, CT = computed tomography.
|
The CT score is another prognostic imaging factor which directly reflects the extent of pneumonia. Diffuse involvement of pneumonia is also a previously known prognostic factor in MERS and SARS pneumonia.24 According to a recent study, the aerated lungs less than < 73% is a predictor of ICU admission and death.25 Therefore, quantifying the pneumonia burden using the CT score, a quantification software, or even roughly by using the number of lobes or segments, would help classify the severity of patients.25 However, considering the progression of COVID-19 pneumonia, the extent of pneumonia on CT scans can differ considerably depending on the timing of the CT scan as in our cases (Figs. 3 and 4). Previous studies reported that 56% of the CT scans were normal at the early phase (0–2 days after symptom onset), and abnormal CT findings became more frequent at 6–11 days after symptom onset.26,27 In this study, we analyzed the CT scans taken at the time of admission in an early phase of the disease. Although a CT score above 5 at the time of admission does not necessarily indicate diffuse pneumonia, it should not be overlooked and the patient should be monitored carefully to check the progression of the severe pneumonia.
This study found that opacity in pneumonia was not a significant predictor of COVID-19 severity, although consolidation and a crazy-paving appearance were significantly common in the severe group than in the non-severe group. Other studies also reported that consolidation was seen frequently in patients with an adverse outcome.8,9 However, our study suggests that the extent of pneumonia and presence of effusion are more important factors than the opacity itself. In the non-severe cases (Fig. 2), patients who showed pneumonia with consolidation on initial CT scans had a non-severe disease course. Therefore, the extent of pneumonia (CT score > 5) and presence of pleural effusion on CT scans at the time of admission are ominous signs, especially in patients of an older age with rising CRP.
There are several limitations in this study. First, this was a retrospective single center study with a relatively small number of patients included. Second, the sample size of the severe group and critical events were relatively small, therefore, further studies with more patient, especially severe patients are needed. Third, we did not consider treatment information in this study. Fourth, although the CT was taken at the time of admission, the symptom period from the onset to the time of admission was in the range of 2–13 days among the patients.
In conclusion, pleural effusion and a higher CT score on CT scan at the time of admission are imaging predictors of poor prognosis in COVID-19 patients. These CT findings may help triage COVID-19 patients in resource-constrained environments.
Go to :
 XML Download